. 2025 Mar 6;112(3):709-723.
doi: 10.1016/j.ajhg.2025.01.020. Epub 2025 Feb 18.

Single-cell transcriptomics reveals inter-ethnic variation in immune response to Falciparum malaria

Affiliations

Single-cell transcriptomics reveals inter-ethnic variation in immune response to Falciparum malaria

Tala Shahin et al. Am J Hum Genet. .

Abstract

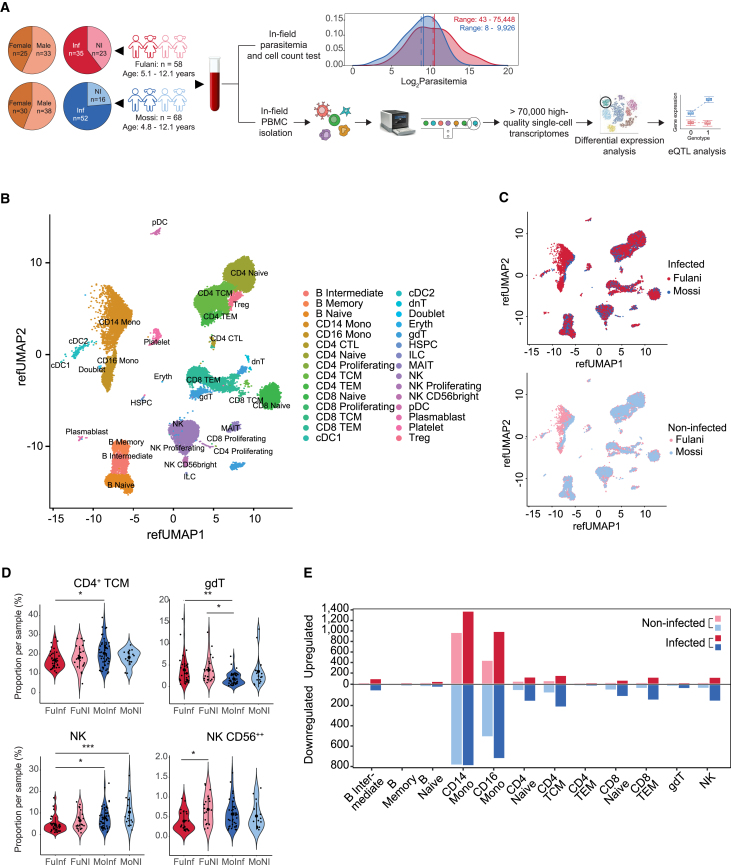
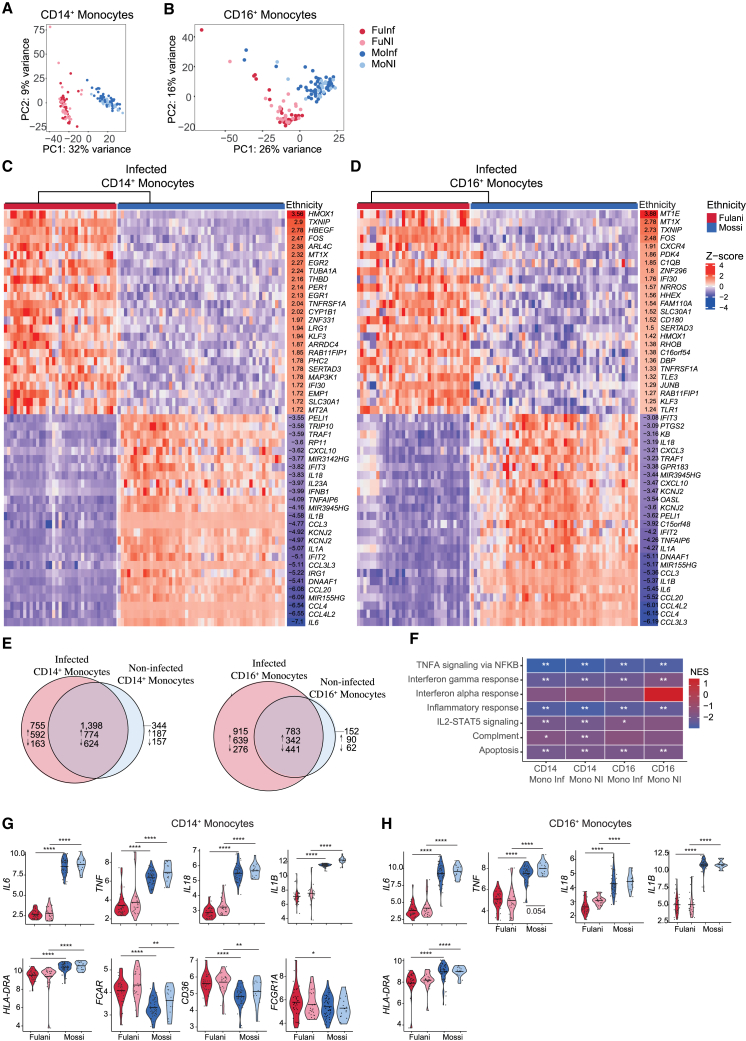
Africa's environmental, cultural, and genetic diversity can profoundly shape population responses to infectious diseases, including malaria caused by Plasmodium falciparum. Differences in malaria susceptibility among populations are documented, but the underlying mechanisms remain poorly understood. Notably, the Fulani ethnic group in Africa is less susceptible to malaria compared to other sympatric groups, such as the Mossi. They exhibit lower disease rates and parasite load as well as enhanced serological protection. However, elucidating the molecular and cellular basis of this protection has been challenging in part due to limited immunological characterization at the cellular level. To address this question, we performed single-cell transcriptomic profiling of peripheral blood mononuclear cells from 126 infected and non-infected Fulani and Mossi children in rural Burkina Faso. This analysis generated over 70,000 single-cell transcriptomes and identified 30 distinct cell subtypes. We report a profound effect of ethnicity on the transcriptional landscape, particularly within monocyte populations. Differential expression analysis across cell subtypes revealed ethnic-specific immune signatures under both infected and non-infected states. Specifically, monocytes and T cell subtypes of the Fulani exhibited reduced pro-inflammatory responses, while their B cell subtypes displayed stronger activation and inflammatory profiles. Furthermore, single-cell expression quantitative trait locus (eQTL) analysis in monocytes of infected children revealed several significant regulatory variants with ethnicity-specific effects on immune-related genes, including CD36 and MT2A. Overall, we identify ethnic, cell-type-specific, and genetic regulatory effects on host immune responses to malaria and provide valuable single-cell eQTL and transcriptomic datasets from under-represented populations.

Keywords: African genomics; Fulani; Mossi; immune response; malaria; sc-eQTL; single-cell RNA-seq.


Conflict of interest statement

Declaration of interests The authors declare no competing interests.

Figures

None
Graphical abstract
Figure 1
Figure 1
Single-cell RNA sequencing of PBMCs from children of the Fulani and Mossi ethnic groups with and without asymptomatic malaria (A) Illustration of study participants with 58 (infected [Inf]: 35, non-infected [NI]: 23) Fulani and 68 (Inf: 52, NI: 16) blood samples from Mossi children. Age, sex, infection status, distribution of log2 parasitemia measured in the samples, and the steps taken for scRNA-seq analysis are shown. Red, infected Fulani (FuInf); pink, non-infected Fulani (FuNI); blue, infected Mossi (MoInf); light blue, non-infected Mossi (MoNI). (B) Reference UMAP of the combined scRNA-seq dataset comprising 71,784 cells from Fulani and Mossi children colored by level-2 predicted cell subtypes. (C) Same reference UMAP from (B) split into two plots based on infection status (top: infected; bottom: non-infected) and colored by ethnicity (red, FuInf; pink, FuNI; blue, MoInf; light blue, MoNI). (D) Violin plots showing the proportions of four cell types, CD4+ TCM, γδT, NK, and CD56++ NK cells, per individual PBMC sample from children corresponding to one of the four groups (FuInf, FuNI, MoInf, MoNI). Pairwise comparisons were performed by one-way ANOVA with post hoc Tukey honest significant difference (HSD) (p ≤ 0.05; ∗∗p ≤ 0.01, ∗∗∗p ≤ 0.001). (E) Barplot of significant upregulated (top; red and pink) and downregulated (bottom; dark and light blue) DEGs (|log2FC| > 0.263; padj < 0.05) in the Fulani relative to the Mossi across 12 cell subtypes in the infected (red and blue) and non-infected (pink and light blue) states. PBMC, peripheral blood mononuclear cell; eQTL, expression quantitative trait locus; refUMAP, reference UMAP; Mono, monocytes; CTL, cytotoxic T; TCM, central memory T; TEM, effector memory T; cDC, conventional dendritic cell; dnT, double-negative T; Eryth, erythroid cell; gdT, γδT; HSPC, hematopoietic stem and progenitor cell; ILC, innate lymphoid cell; MAIT, mucosal associated invariant T; NK, natural killer; pDC, plasmacytoid dendritic cell; Treg, regulatory T.
Figure 2
Figure 2
Analysis of transcriptomic changes in infected CD14+ and CD16+ monocytes (A and B) Principal-component (PC) analysis plots of the pseudobulk transcriptomes of CD14+ and CD16+ monocytes from the four groups (FuInf, FuNI, MoInf, MoNI), with PC1 and PC2 explaining 41% and 42% of the total variance in each cell subtype, respectively. (C and D) One-way hierarchical heatmap of the top 25 upregulated and top 25 downregulated genes in the Fulani infected CD14+ and CD16+ monocytes, respectively, relative to those of the Mossi (padj < 0.05). Log2FC values for each gene are denoted on the left of the heatmaps. Normalized (variant stabilizing transformation [VST]) expression values are represented as Z scores (scale bar on the left) and calculated per gene. (E) Venn diagrams showing the number of overlapping upregulated and downregulated genes between ethnic group comparisons in the infected and non-infected states in CD14+ (left) and CD16+ (right) monocytes. (F) GSEA of hallmark pathways from MSigDB, taking into account the fold changes of significant DEGs (padj < 0.05) between Fulani and Mossi children for each monocyte cell type and infection state. Normalized enrichment score (NES) > 0 indicates pathway enrichment in the Fulani relative to the Mossi (false discovery rate [FDR] < 0.1, ∗∗FDR < 0.05). (G and H) Violin plots showing normalized VST expression values of IL6, TNF, IL18, IL1β, and HLA-DRA in CD14+ and CD16+ monocytes per group (red, FuInf; pink, FuNI; blue, MoInf; light blue, MoNI), in addition to FCAR, CD36, and FCGR1 in CD14+ monocytes. Adjusted p values from multiple correction testing following DGEA are indicated on the bars for the comparison of ethnic groups per infection status and the comparison of infection states per ethnic group, as shown in Tables S10 and S11 (padj.loc < 0.05, ∗∗padj.loc < 0.01, ∗∗∗padj.loc < 0.001, ∗∗∗∗padj.loc < 0.0001). FuInf, infected Fulani; FuNI, non-infected Fulani; MoInf, infected Mossi; MoNI, non-infected Mossi.
Figure 3
Figure 3
Analysis of transcriptomic changes in T cells and B cells (A) Dotplot showing the relative (scale bar) and percentage (size of dot) expression of genes involved in T cell activation, cytokines, interferon, NF-κB, AP-1, and JAK-STAT pathway signaling in CD4+ naive (top) and CD4+ TCM (bottom) cells in each of the four groups (FuInf, FuNI, MoInf, MoNI). (B) GSEA of hallmark pathways from MSigDB, taking into account the fold changes of significant DEGs (padj < 0.05) between Fulani and Mossi children for each NK and T cell subtype and infection state. Normalized enrichment score (NES) > 0 indicates pathway enrichment in the Fulani relative to the Mossi (FDR < 0.1; ∗∗FDR < 0.05). (C) Violin plots showing normalized VST expression values of CD69, IRF1, STAT3, and PDCD1 in CD4+ TCM cells per group (red, FuInf; pink, FuNI; blue, MoInf; light blue, MoNI). (D) Dotplot showing the relative expression of genes involved in B cell activation and homing, cytokine, interferon, NF-κB, and AP-1 signaling in B naive (top) and B intermediate (bottom) cells in each of the four groups (FuInf, FuNI, MoInf, MoNI). (E) Violin plots showing normalized VST expression values of CXCR5, CD79B, IRF1, and TSC22D3 in B intermediate cells per group. (F) Ingenuity pathway analysis (IPA) taking into account the fold changes of significant DEGs (padj < 0.05) between Fulani and Mossi children for infected B intermediate cells. Z score >0 indicates pathway activation, and Z score <0 indicates pathway inhibition in cells of the Fulani relative to the Mossi (padj < 0.05, shown on the scale bar). (G) Pearson correlation between normalized expression values of MT1X and MT2A (left) as well as MT1X and SLC30A1 (right) in Fulani (red) and Mossi (blue) pseudobulk samples. The 95% confidence intervals (CIs) of the line of best fit are shaded. Adjusted p values from multiple correction testing following DGEA are indicated on the bars of (C) and (E) for the comparison of ethnic groups per infection status and the comparison of infection states per ethnic group, as shown in Tables S10 and S11 (padj.loc < 0.05, ∗∗padj.loc < 0.01, ∗∗∗padj.loc < 0.001, ∗∗∗∗padj.loc < 0.0001). FuInf, infected Fulani; FuNI, non-infected Fulani; MoInf, infected Mossi; MoNI, non-infected Mossi; TCM, T central memory; TEM, T effector memory; NK, natural killer; Inf, infected; NI, non-infected.
Figure 4
Figure 4
Expressive quantitative trait locus (eQTL) analysis of CD14+ and CD16+ monocytes (A) Mirrored Manhattan plot depicting the strength of statistical associations of genotype (above 0 line) and genotype-ethnicity interaction (below 0 line) effects between cis-localized SNPs and transcript abundance in CD14+ (top) and CD16+ (bottom) monocytes. The highlighted markers in orange indicate a Bonferroni gene-wise corrected p value <0.05 significance, with a triangle denoting the strongest association for a specific gene. G×E, gene by ethnicity. (B) Fine-mapped eQTL results for CD36 gene using rs1049654 SNP marker (left) and MT2A gene using rs1049654 SNP marker (right). Transcript abundance (95% CI of means shown) changes as a function of minor allele dosage and ethnicity. Allelic dosage 0 corresponds to major allele homozygous individuals, while 1 corresponds to individuals carrying at least one minor allele copy.

References

    1. Sirugo G., Hennig B.J., Adeyemo A.A., Matimba A., Newport M.J., Ibrahim M.E., Ryckman K.K., Tacconelli A., Mariani-Costantini R., Novelli G., et al. Genetic studies of African populations: An overview on disease susceptibility and response to vaccines and therapeutics. Hum. Genet. 2008;123:557–598. doi: 10.1007/S00439-008-0511-y. - DOI - PubMed
    1. Campbell M.C., Tishkoff S.A. AFRICAN GENETIC DIVERSITY: Implications for Human Demographic History, Modern Human Origins, and Complex Disease Mapping. Annu. Rev. Genomics Hum. Genet. 2008;9:403–433. doi: 10.1146/annurev.genom.9.081307.164258. - DOI - PMC - PubMed
    1. Pereira L., Mutesa L., Tindana P., Ramsay M. African genetic diversity and adaptation inform a precision medicine agenda. Nat. Rev. Genet. 2021;22:284–306. doi: 10.1038/S41576-020-00306-8. - DOI - PubMed
    1. Sirugo G., Williams S.M., Tishkoff S.A. The Missing Diversity in Human Genetic Studies. Cell. 2019;177:26–31. doi: 10.1016/j.cell.2019.02.048. - DOI - PMC - PubMed
    1. Temba G.S., Kullaya V., Pecht T., Mmbaga B.T., Aschenbrenner A.C., Ulas T., Kibiki G., Lyamuya F., Boahen C.K., Kumar V., et al. Urban living in healthy Tanzanians is associated with an inflammatory status driven by dietary and metabolic changes. Nat. Immunol. 2021;22:287–300. doi: 10.1038/s41590-021-00867-8. - DOI - PubMed

MeSH terms