. 2025 Feb 19;15(1):6063.
doi: 10.1038/s41598-025-90125-w.

Micro-CT analysis reveals porosity driven growth banding in Caribbean coral Siderastrea siderea

Affiliations

Micro-CT analysis reveals porosity driven growth banding in Caribbean coral Siderastrea siderea

James Vincent et al. Sci Rep. .

Abstract

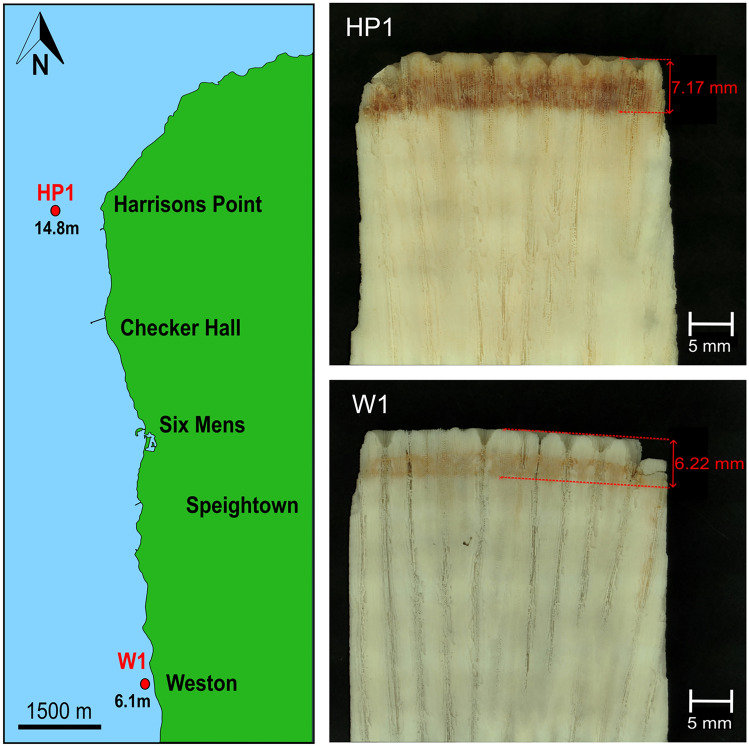
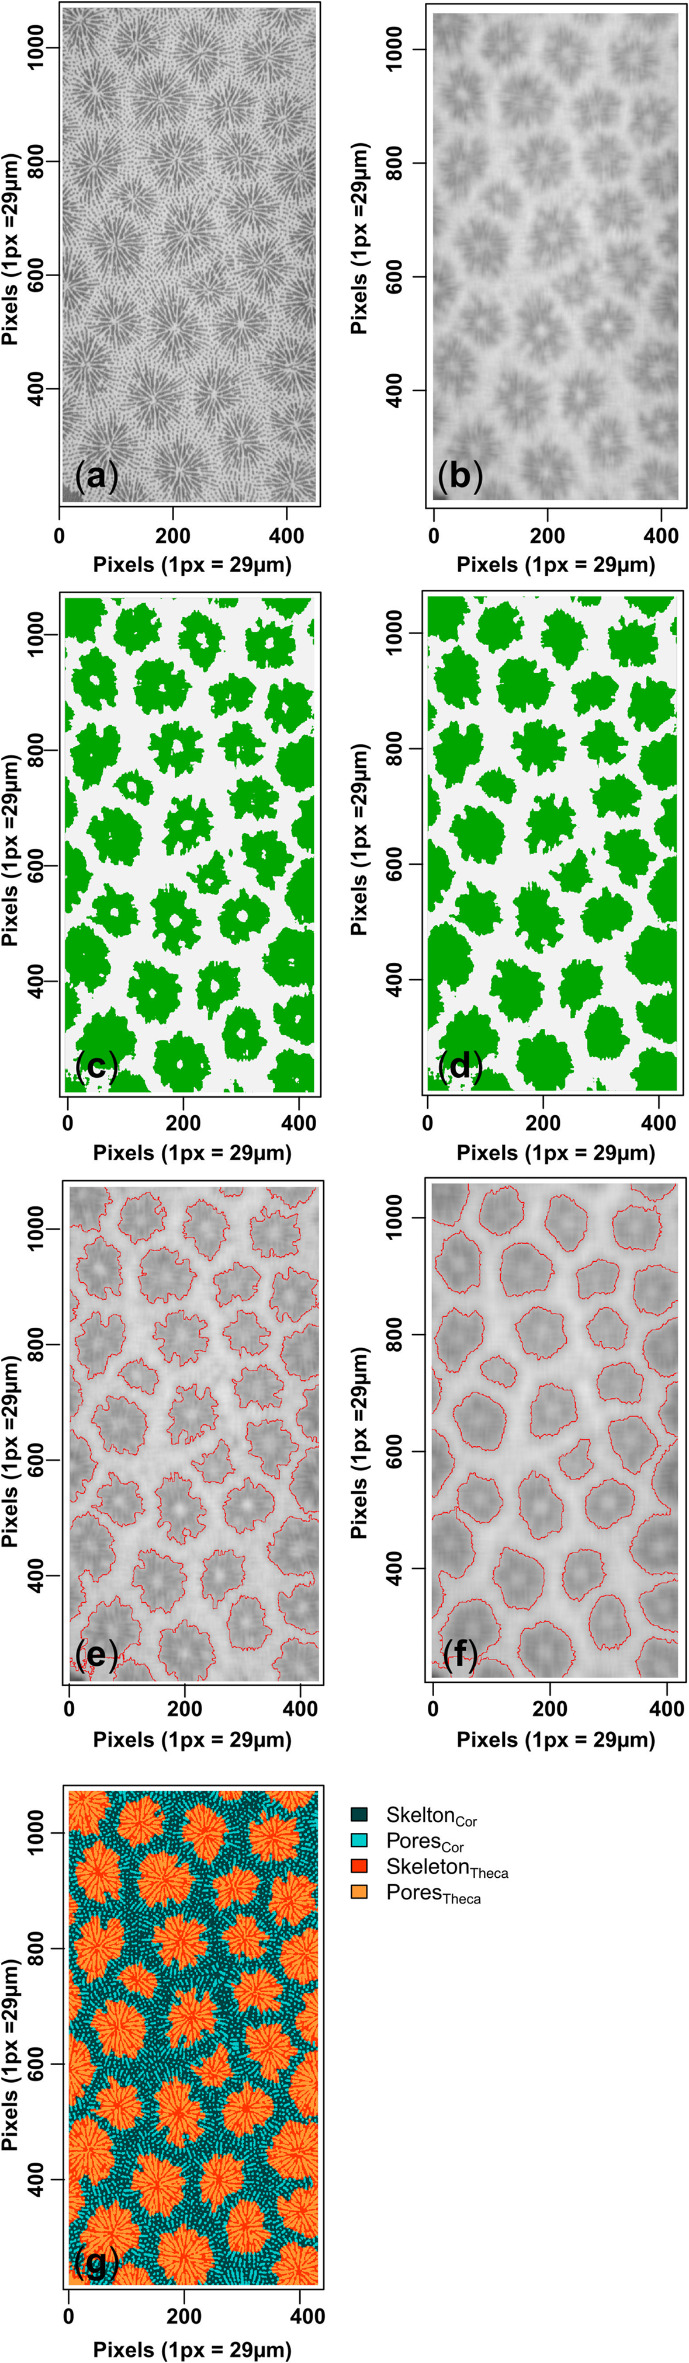
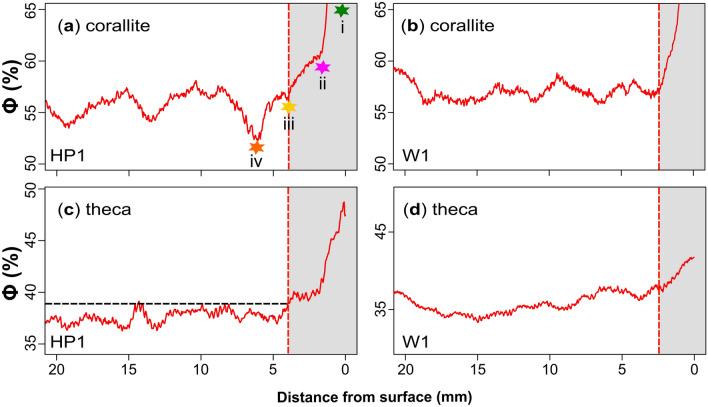
X-radiography of massive scleractinian coral skeletons reveal light and dark couplets termed "growth bands", which are commonly related to seasonal fluctuations in environmental parameters including insolation and sea surface temperature (SST). Massive corals grow by extension of skeletal structures followed by thickening within the surface tissue layer. Therefore, an understanding of the depth in which skeletal thickening occurs is important to aid the interpretation of seasonal banding patterns. In this study, two colonies of Caribbean coral Siderastrea siderea were sampled from the north-west coast of Barbados at water depths of 5 and 15 m. The three-dimensional skeletal structure of each sample was reconstructed at high spatial resolutions using micro-computed tomography (µCT) scanning. A pixel segmentation algorithm was developed to classify different microstructures within the skeleton and to quantify spatial variations in corallite and theca porosity at the micrometer scale. The porosity reconstructions of the deeper sample reveal clearer growth banding, with a more dominant signal originating from within the corallite. Skeletal thickening occurs within the top two-thirds of the total depth of soft tissues and the rate of thickening varies between microstructures. Seasonality in the shallower sample is less clear, although porosity variability with depth is more similar across microstructures. The difference in signal origin and clarity between the two samples is attributed to the varying stability of water depth-dependent variables (i.e., insolation and wave energy). This study provides a new, powerful method of reconstructing and understanding growth strategies in massive scleractinian corals.

Keywords: Caribbean; Density banding; Scleractinian; Seasonality; Segmentation; Tomography.


Conflict of interest statement

Declarations. Competing interests: The authors declare no competing interests. Consent for publication: All authors have read and approved the final version of the manuscript and consent to its submission for publication. Samples were imported with CITES permit number 24EB000707-AS.

Figures

Fig. 1
Fig. 1
Left: Map of the north-west coast of Barbados showing the locations and depths of S. siderea samples HP1 and W1 (red circles). Right: Images of the major growth axis of HP1 (top) and W1 (bottom) illustrating the depth of soft tissue penetration (orange stain) at the growth surface. Note the thicker tissue thickness in HP1.
Fig. 2
Fig. 2
Visualisation of the image segmentation process on example slice #01127 from HP1. An area of the raw µCT slice is defined to avoid edge-related porosity effects (panel a). The area is smoothed using the pre-set S-value (i.e., S = 15 in panel b). The image segmentation algorithm is initiated on the smoothed slice (k = 2), clustering darker and lighter pixels into corallite and theca areas (green and white respectively in panel c). Internal clumps of lighter pixels (columella) are (mis)identified within the darker clusters (panel c) and are re-labelled as corallite (panel d). Panels e and f illustrate the effect of S (S = 15 and S = 25 respectively) on the corallite-theca boundaries. The area is then un-smoothed and the algorithm is reinitiated (k = 2) within the defined boundaries (i.e., in panel e) whereby red pixels correspond to corallite skeleton (SkeletonCor), orange pixels to corallite pores (PoresCor), dark blue pixels correspond to theca skeleton (SkeletonTheca) and light blue for theca pores (PoresTheca) in panel g.
Fig.3
Fig.3
Graphs showing the reconstructed porosities of HP1 within the theca (panel a) and corallite (panel b) areas for both the larger (blue) and smaller (red) smoothing areas (S = 25 and S = 15 respectively) through the growth axis of the sample. Both graphs display the complete porosity reconstruction (i.e., combined theca and corallite porosities: black line) as a reference between the theca and corallite microstructures. The initial and terminal elevated porosities correspond to the edge-effected top and bottom surfaces of the sample (greyed-out). The 95th percentile of values between the edge effect is illustrated by the horizontal, hashed red line (panel a). The grey box (panels a and b) corresponds to the growth surface porosity reconstructions in Figure 6a and 6c. The bulk skeletal density from the reconstructed radiograph of HP1 is shown in panel c. The bulk density reconstruction corresponds to the same area used in the porosity reconstructions in panels a and b. The density units are arbitrary as they represent the average of a one-dimension profile along the radiograph. The minimum (Min ρ) and maximum (Max ρ) skeletal density in panel d correspond to the greyscale values of pixels classified as skeleton (red and blue lines respectively). Note that the y-axis in panels c and d is inversed for better comparison to the porosity reconstructions.
Fig. 4
Fig. 4
Graphs showing the reconstructed porosities of W1 within the theca (panel a) and corallite (panel b) areas for both the larger (blue) and smaller (red) smoothing areas (S = 29 and S = 17 respectively) through the depth of the sample. Both graphs display the complete porosity reconstruction (i.e., combined theca and corallite porosities: black line) as a reference between the microstructures. The initial and terminal elevated porosities correspond to the edge-effected top and bottom surfaces of the sample (greyed-out). The grey box (panels a and b) corresponds to the growth surface porosity reconstructions in Figure 6b and 6d. The bulk skeletal density from the reconstructed radiograph of W1 is shown in panel c. The bulk density reconstruction corresponds to the same area used in the porosity reconstructions in panels a and b. The density units are arbitrary as they represent the average of a one-dimension profile along the radiograph. The minimum (Min ρ) and maximum (Max ρ) skeletal density in panel d correspond to the greyscale values of pixels classified as skeleton (red and blue lines respectively). Note that the y-axis in panels c and d is inversed for better comparison to the porosity reconstructions.
Fig. 5
Fig. 5
Graphs showing the total mean corallite area through the major growth axis of HP1 (a) and W1 (b) when smoothed over small and large areas (blue and red lines, respectively). The variability of the total corallite area in HP1 shows a stationary signal. In contrast, the total corallite area in W1 reveals relatively longer-term variability and a general decreasing signal towards the growth surface. Note that the different smoothing areas in HP1 causes little offset between corallite area (red and blue lines in panel a) whereas in W1, smoothing diverges the two area reconstructions (panel b). The greyed-out box represents the growth surface edge effect in each panel.
Fig. 6
Fig. 6
Corallite and theca surface porosity profiles for HP1 (panels a and c correspond to the grey boxes in Fig. 3a-b, respectively) and W1 (panels b and d correspond to the grey boxes in Fig. 4a-b, respectively). The coloured stars (i–iv in panel a) are used to illustrate the key depths in which porosity is reconstructed within the corallites of HP1. The green star (i) marks the growth surface. The pink star (ii) corresponds to the depth in which the plane of reconstruction reaches the bottom of corallite-cups. The transition between the pink and yellow star (ii–iii) correspond to the depth in which skeleton is thickened beneath the corallite cup. Skeletal thickening is also observed in the theca porosity profile (panel c). The vertical, red hashed line (panels a and c) correspond to the same thickening depth. The horizontal dashed black line in the theca reconstruction (panel c) represents the 95th percentile of theca porosity between the edge-effected slices (greyed-out box). The yellow star (iii in panel a) marks the most recent growth band formation at the time the sample was collected. The orange star (iv) corresponds to the winter HDB. Although less clear, these porosity transitions in W1 at the growth surface is evident in the corallite and theca porosity profiles (panels b and d respectively).
Fig. 7
Fig. 7
Four µCT slices (a-d) correspond to the corallite thickening interval illustrated by coloured stars in Figure 6a. A schematic representation (e) reconstructs the thickening stages which are illustrated by the same coloured stars with depth. The horizontal red hashed line (panel e) corresponds to the vertical red hashed line in Figure 6a, 6c. The higher porosities exhibited at the start of the reconstruction correspond to partially filled/hollow corallites and uneven surfaces (green star in panels a and e). The corallite microstructures are reconstructed at a 1.56 mm depth whereby the porosity cyclicity begins (violet star in panels b and e). The corallite microstructures are thickened between 1.56 to 4.35 mm depth which correspond to the environmental conditions at the time of sample extraction (yellow star in panels c and e). The porosity minima (orange star in panel d) corresponds to the previous winter.

References

    1. Barnes, D. J. & Lough, J. M. Systematic variations in the depth of skeleton occupied by coral tissue in massive colonies of Porites from the Great barrier reef. J. Exp. Mar. Biol. Ecol.159(1), 113–128. 10.1016/0022-0981(92)90261-8 (1992).
    1. Mollica, N. R. et al. Skeletal records of bleaching reveal different thermal thresholds of Pacific coral reef assemblages. Coral. Reefs38(4), 743–757. 10.1007/s00338-019-01803-x (2019).
    1. DeCarlo, T. M. & Cohen, A. L. Dissepiments, density bands and signatures of thermal stress in Porites skeletons. Springer10.1007/s00338-017-1566-9 (2017).
    1. Tierney, J. E. et al. Tropical sea surface temperatures for the past four centuries reconstructed from coral archives. Paleoceanography30(3), 226–252. 10.1002/2014PA002717 (2015).
    1. Tanzil, J. T. I. et al. Luminescence and density banding patterns in massive Porites corals around the Thai-Malay Peninsula, Southeast Asia. Limnol Oceanogr61(6), 2003–2026. 10.1002/lno.10350 (2016).

LinkOut - more resources