. 2025 Feb 19;16(1):112.
doi: 10.1038/s41419-025-07422-5.

Inhibition of Atg7 in intestinal epithelial cells drives resistance against Citrobacter rodentium

Affiliations

Inhibition of Atg7 in intestinal epithelial cells drives resistance against Citrobacter rodentium

David Cune et al. Cell Death Dis. .

Abstract

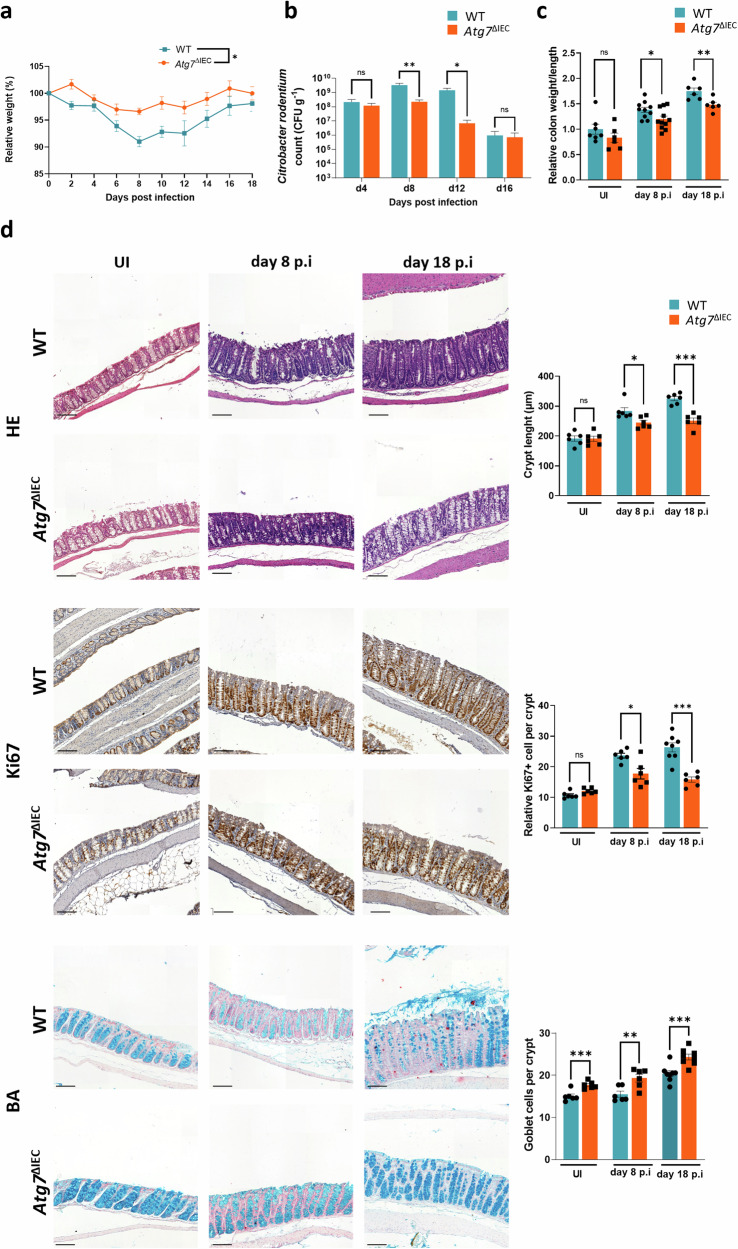
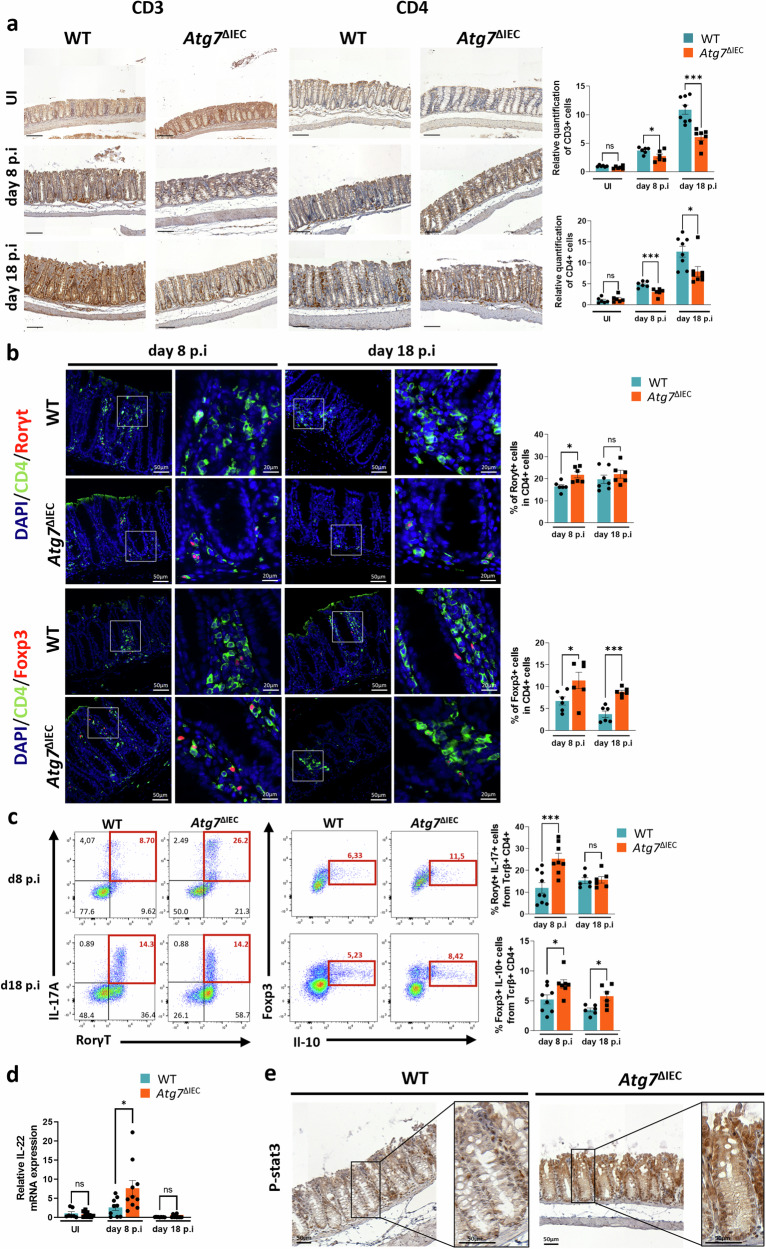
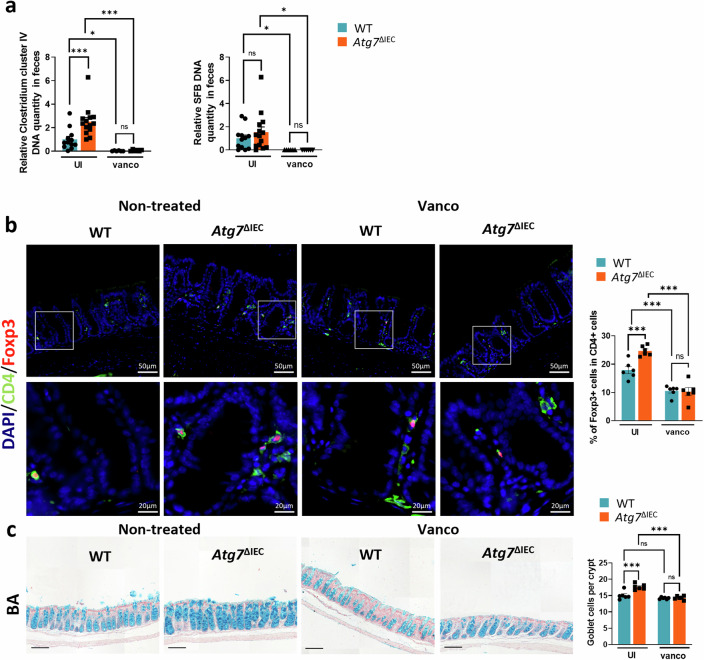
Autophagy, a cytoprotective mechanism in intestinal epithelial cells, plays a crucial role in maintaining intestinal homeostasis. Beyond its cell-autonomous effects, the significance of autophagy in these cells is increasingly acknowledged in the dynamic interplay between the microbiota and the immune response. In the context of colon cancer, intestinal epithelium disruption of autophagy has been identified as a critical factor influencing tumor development. This disruption modulates the composition of the gut microbiota, eliciting an anti-tumoral immune response. Here, we report that Atg7 deficiency in intestinal epithelial cells shapes the intestinal microbiota leading to an associated limitation of colitis induced by Citrobacter rodentium infection. Mice with an inducible, intestinal epithelial-cell-specific deletion of the autophagy gene, Atg7, exhibited enhanced clearance of C. rodentium, mitigated hyperplasia, and reduced pathogen-induced goblet cell loss. This protective effect is linked to a higher proportion of neutrophils and phagocytic cells in the early phase of infection. At later stages, it is associated with the downregulation of pro-inflammatory pathways and an increase in Th17 and Treg responses-immune responses known for their protective roles against C. rodentium infection, modulated by specific gut microbiota. Fecal microbiota transplantation and antibiotic treatment approaches revealed that the Atg7-deficiency-shapped microbiota, especially Gram-positive bacteria, playing a central role in driving resistance to C. rodentium infection. In summary, our findings highlight that inhibiting autophagy in intestinal epithelial cells contributes to maintaining homeostasis and preventing detrimental intestinal inflammation through microbiota-mediated colonization resistance against C. rodentium. This underscores the central role played by autophagy in shaping the microbiota in promoting immune-mediated resistance against enteropathogens.


Conflict of interest statement

Competing interests: The authors declare no competing interests.

Figures

Fig. 1
Fig. 1. Atg7 deletion in colonic epithelium protects against C. rodentium infection.
a Body weight changes in WT and Atg7ΔIEC mice after oral infection with C. rodentium (n = 9 WT and n = 10 Atg7ΔIEC from two independent experiments). Two-way ANOVA with Greenhouse–Geisser correction. b Quantification of bacterial burden in stool (CFU/g) over time from WT and Atg7ΔIEC mice (n = 6 WT and n = 8 Atg7ΔIEC from two independent experiments). c Relative quantification of colon weight/length ratio from WT and Atg7ΔIEC mice before (uninfected, UI) and after infection at day 8 and day 18 p.i (UI: n = 7 WT, n = 6 Atg7ΔIEC; at day 8 p.i: n = 10 WT, n = 11 Atg7ΔIEC; and at day 18 p.i: n = 6 WT, n = 6 Atg7ΔIEC mice from two independent experiments). d Histological analysis of WT and Atg7ΔIEC colonic epithelium after C. rodentium infection. Representative hematoxylin & eosin (H&E), Ki67 and alcian blue (BA) staining on colonic sections from WT and Atg7ΔIEC mice before and after infection at day 8 and day 18 p.i. Scale bar = 100 µm. Quantification of colonic crypts length (n = 6 mice per condition from two independent experiments), Ki67 positive cells per crypts (UI: n = 6 WT, n = 6 Atg7ΔIEC, at day 8: n = 6 WT and n = 6 Atg7ΔIEC, at day 18 p.i: n = 8 WT and n = 6 Atg7ΔIEC day 18 p.i. from two independent experiment) and BA-positive cells per crypts (UI: n = 6 WT mice, n = 6 Atg7ΔIEC mice; at day 8 p.i: n = 6 WT mice, n = 6 Atg7ΔIEC mice and at day 18 p.i: n = 8 WT mice, n = 6 Atg7ΔIEC mice from two independent experiments). Significant differences: *p < 0.05, **p < 0.01, ***p < 0.001, ns not significant, determined by unpaired t-test. Mean ± SEM.
Fig. 2
Fig. 2. Atg7 deficiency alters the immune transcriptional response during C. rodentium infection.
RNA-seq analysis of whole colonic tissues from WT and Atg7ΔIEC mice was conducted before (UI) and after infection at day 8 and day 18 p.i (at UI: n = 3 WT mice, n = 3 Atg7ΔIEC mice; at day 8 p.i: n = 4 WT mice, n = 4 Atg7ΔIEC mice; at day 18 p.i: n = 5 WT mice, n = 5 Atg7ΔIEC mice). a Venn diagrams displaying the number of genes with significantly increased expression on day 8 and day 18 in WT, Atg7ΔIEC, or both, compared to their non-infected counterpart (UI). b ClueGO analysis of the top ten biological pathways of genes commonly upregulated in WT and Atg7ΔIEC colons compared to UI of the same genotype at day 8 p.i. c ClueGO analysis of the top ten biological pathways of up and downregulated genes in Atg7ΔIEC colon compared to WT at day 8 p.i. d Heatmap displaying the expression values of genes associated with interleukin, chemokine, and interferon in colonic sections of WT and Atg7ΔIEC at day 8 p.i based on RNA-seq data. e Enrichment plot generated by GSEA for hallmark TNFα signaling via NFKB, IFNγ response, IFNα response, inflammatory response, IL-6/Stat3 signaling, complement response, and IL-2/Stat5 genes sets based on RNA-seq data from colonic tissues of WT and Atg7ΔIEC mice at day 8 p.i. f Enrichment plot generated by GSEA for hallmark TNFα signaling via NFKB, IFNγ response and IFNα response genes sets based on RNA-seq data from colonic tissues of WT and Atg7ΔIEC mice at day 18 p.i. g Assessment of relative IL-1α, IL-1β and IL-6 mRNA levels by qRT-PCR on colonic sections of WT and Atg7ΔIEC mice before and after infection at day 8 and day 18 p.i (UI: n = 8 WT mice, n = 7 Atg7ΔIEC mice; at day 8 p.i: n = 9 WT mice; n = 8 Atg7ΔIEC mice; at day 18 p.i: n = 10 WT mice, n = 10 Atg7ΔIEC mice from two independent experiments). h Elisa analysis for IL-1β, IL-6, and TNFα secretion by colon explant cultures of WT and Atg7ΔIEC mice before (UI) and after C. rodentium infection (UI: n = 6 WT mice, n = 5 Atg7ΔIEC; day 8 p.i: n = 5 WT mice, n = 5 Atg7ΔIEC mice; day 18 p.i: n = 5 WT mice, n = 5 Atg7ΔIEC). Significant difference: *p < 0.05, ***p < 0.001, ns not significant, determined by unpaired t-test. Differentially expressed genes from RNA-seq are defined by a p < 0.01 and a fold change > ±1.5. Mean ± SEM. GSEA get set enrichment analysis, NES normalized enrichment score.
Fig. 3
Fig. 3. Loss of Atg7 modulates T lymphocytes recruitment and shapes Th17/Treg responses during C. rodentium infection.
a Representative IHC staining for CD3 and CD4 on colonic sections from WT and Atg7ΔIEC mice before and after infection at day 8 and day 18 p.i. Quantification of CD3-positive cells (UI: n = 6 WT mice, n = 6 Atg7ΔIEC mice; at day 8 p.i: n = 6 WT mice, n = 6 Atg7ΔIEC mice; at day 18 p.i: n = 8 WT mice and n = 7 Atg7ΔIEC mice from two independent experiments) and CD4+ cells (UI: n = 6 WT mice, n = 6 Atg7ΔIEC mice; at day 8 p.i: n = 6 WT mice, n = 6 Atg7ΔIEC mice; at day 18 p.i: n = 8 WT mice and n = 7 Atg7ΔIEC mice from two independent experiments). b Representative IF staining for CD4/Rorγt and CD4/Foxp3 on colonic sections from WT and Atg7ΔIEC mice at day 8 and day 18 p.i. Quantification of CD4 and Rorγt double-positive cells (at day 8 p.i: n = 6 WT mice, n = 6 Atg7ΔIEC mice; at day 18 p.i : n = 7 WT mice and n = 6 Atg7ΔIEC mice from two independent experiments) and CD4 and Foxp3 double-positive cells (at day 8 p.i: n = 6 WT mice, n = 6 Atg7ΔIEC mice and at day 18 p.i : n = 6 WT mice, n = 6 Atg7ΔIEC mice from two independent experiments). c Fluorescence-activated cell sorting (FACS) analysis of T effector cells harvested from colonic lamina propria during C. rodentium infection. Representative flow cytometry plots of Rorγt+ IL-17A+ cells (Th17) and Foxp3+IL-10+ cells (Treg) within CD4+ Tcrβ+ cells from the colon of WT and Atg7ΔIEC mice at day 8 and day 18 p.i. Quantification of Rorγt+ IL-17A+ cells (Th17) (at day 8: n = 9 WT mice, n = 8 Atg7ΔIEC mice; at day 18 p.i: n = 6 WT mice, n = 6 Atg7ΔIEC mice from two independent experiments) and Foxp3+IL-10+ cells (Treg) (at day 8: n = 8 WT mice, n = 7 Atg7ΔIEC mice; at day 18 p.i: n = 6 WT mice, n = 6 Atg7ΔIEC mice from two independent experiments) in the lamina propria. d Relative IL-22 mRNA levels assessed by qRT-PCR on colonic epithelium from UI, day 8 or day 18p.i from WT and Atg7ΔIEC mice (UI: n = 7 WT mice, n = 9 Atg7ΔIEC mice; at day 8 p.i: n = 9 WT mice, n = 10 Atg7ΔIEC mice; at day 18 p.i: n = 9 WT mice and n = 10 Atg7ΔIEC mice from two independent experiments). e Representative phospho-STAT3 staining of colonic sections from WT and Atg7ΔIEC mice at day 8 p.i. Black scale bar =100 µm. Significant differences: *p < 0.05, **p < 0.01, ***p < 0.001, ns not significant, determined by unpaired t-test. Mean ± SEM.
Fig. 4
Fig. 4. Microbiota transplantation of Atg7 deficient mice protects WT mice from C. rodentium infection.
a Principal component analysis of bacterial diversity of feces from WT and Atg7ΔIEC mice (n = 6 WT mice, n = 6 Atg7ΔIEC from two independent experiments, permanova p-value = 0.006), b Body weight changes after oral infection with C. rodentium of WT, Atg7ΔIEC mice and WT mice with fecal transplantation from Atg7ΔIEC mice (WT + FMT) (n = 6 mice per condition, from two independent experiments). Two-way ANOVA with Greenhouse-Geisser correction. c Quantification of bacterial burden in stool (CFU/g) over time from WT, Atg7ΔIEC and WT + FMT mice (n = 6 mice per condition from two independent experiments). d Relative quantification of colon weight/length ratio from WT, Atg7ΔIEC and WT + FMT mice at day 18 p.i (n = 6 mice per condition from two independent experiments). e Representative hematoxylin & eosin (H&E), alcian blue (BA), Ki67 staining on colonic sections from WT, Atg7ΔIEC and WT + FMT mice at day 18 p.i. Quantification of colonic crypts length, Ki67 positive cells per crypts and BA-positive cells per crypt (n = 6 mice per condition from two independent experiments). f Percentage of Rorγt+ IL-17A+ cells (Th17) and Foxp3+IL-10+ cells (Treg) within the CD4+ cells obtained by FACS analysis from the lamina propria of the colon of WT, Atg7ΔIEC and WT + FMT mice at day 8 p.i (n = 3 WT mice, n = 4 Atg7ΔIEC mice, n = 4 WT + FMT mice). g Quantification by immunostainings of CD4 and Rorγt double-positive cells (n = 6 mice per condition from two independent experiments) and CD4 and Foxp3 double-positive cells (n = 6 mice per condition from two independent experiments) from the colon of WT, Atg7ΔIEC and WT + FMT mice at day 18 p.i. h Levels of free sialic acid in feces from WT, Atg7ΔIEC and WT + FMT mice before infection (UI) and after C. rodentium infection at day 4 p.i and 8 p.i (UI: n = 6 WT, n = 6 Atg7ΔIEC n = 5 WT + FMT; day 4 p.i: n = 6 WT mice, n = 6 Atg7ΔIEC mice, n = 5 WT + FMT; day 8 p.i: n = 5 WT mice, n = 6 Atg7ΔIEC mice, n = 5 WT + FMT mice). Black scale bar = 100 µm. Mean ± SEM. Significant differences: *p < 0.05, **p < 0.01, ***p < 0.001, ns not significant, determined by unpaired t-test.
Fig. 5
Fig. 5. Treg and goblet cell induction conferred by Atg7 inhibition is abolished by vancomycin treatment.
a Impact of vancomycin treatment on the abundance of Clostridium cluster IV (C. leptum group) and Segmented Filamentous Bacteria (SFB) in WT and Atg7ΔIEC mice. Bacterial DNA was extracted from feces (n = 12 WT mice, n = 14 Atg7ΔIEC mice, n = 6 WT+vanco mice, n = 6 Atg7ΔIEC+vanco mice). b Representative IHC stainings for Foxp3 and CD4 on colonic sections from WT and Atg7ΔIEC mice non-treated and treated with vancomycin. Quantification of CD4 and Foxp3 double-positive cells in the lamina propria (n = 6 mice per condition from two independent experiments). c Representative alcian blue (BA) staining on colonic sections from WT and Atg7ΔIEC mice non-treated and treated with vancomycin. Quantification of BA-positive cells per crypt (n = 6 mice per condition from two independent experiments). Black scale bar = 100 µm. Mean ± SEM. Significant differences: *p < 0.05, **p < 0.01, ***p < 0.001, ns not significant, determined by unpaired t-test.
Fig. 6
Fig. 6. Vancomycin treatment alters resistance to C. rodentium in Atg7 mutant and WT mice.
a Body weight changes of WT and Atg7ΔIEC mice infected with C. rodentium after vancomycin treatment (n = 5 WT mice, n = 4 Atg7ΔIEC mice, n = 4 WT+vanco mice, n = 3 Atg7ΔIEC+vanco mice). Two-way ANOVA with Greenhouse-Geisser correction. b Quantification of bacterial burden in stool (CFU/g) at day 8 after C. rodentium infection from WT and Atg7ΔIEC mice non-treated and vancomycin-treated (n = 4 WT, n = 4 Atg7ΔIEC, n = 5 WT + vanco, n = 4 Atg7ΔIEC + vanco). c Relative quantification of colon weight/length ratio from WT and Atg7ΔIEC mice non-treated and vancomycin-treated at day 18 p.i (n = 4 WT mice, n = 4 Atg7ΔIEC mice, n = 5 WT + vanco mice, n = 3 Atg7ΔIEC+vanco mice). d Representative hematoxylin & eosin (H&E), Ki67, alcian blue (BA), CD3, and CD4 staining of colonic sections from WT and Atg7ΔIEC mice non-treated and vancomycin-treated at day 18 p.i. Quantification of colonic crypts length (n = 6 WT mice, n = 3 Atg7ΔIEC mice, n = 5 WT + vanco mice and n = 3 Atg7ΔIEC+vanco mice). Quantification of Ki67 positive cells per crypts (n = 5 WT mice, n = 4 Atg7ΔIEC mice, n = 5 WT + vanco mice and n = 3 Atg7ΔIEC + vanco mice). Quantification of BA-positive cells per colonic section (n = 5 WT mice, n = 4 Atg7ΔIEC mice, n = 5 WT + vanco mice and n = 3 Atg7ΔIEC + vanco mice). Quantification of CD3 positive cells per crypt (n = 4 WT mice, n = 4 Atg7ΔIEC mice, n = 5 WT + vanco mice and n = 3 Atg7ΔIEC + vanco mice). Quantification of CD4 positive cells per colonic section (n = 6 WT mice, n = 4 Atg7ΔIEC mice, n = 5 WT+vanco mice, n = 3 Atg7ΔIEC + vanco mice). e Representative IHC staining for CD4 and Foxp3 on colonic sections from non-treated and vancomycin-treated WT and Atg7ΔIEC mice at day 18 p.i. Quantification of CD4 and Foxp3 double-positive cells per colonic sections (n = 4 WT mice, n = 4 Atg7ΔIEC mice, n = 5 WT+vanco differences: *p < 0.05, **p < 0.01, ***p < 0.001, ns not significant, determined by unpaired t-test.

References

    1. Kamada N, Seo SU, Chen GY, Nunez G. Role of the gut microbiota in immunity and inflammatory disease. Nat Rev Immunol. 2013;13:321–35. - PubMed
    1. Levy J, Cacheux W, Bara MA, L’Hermitte A, Lepage P, Fraudeau M, et al. Intestinal inhibition of Atg7 prevents tumour initiation through a microbiome-influenced immune response and suppresses tumour growth. Nat Cell Biol. 2015;17:1062–73. - PubMed
    1. Clay SL, Fonseca-Pereira D, Garrett WS. Colorectal cancer: the facts in the case of the microbiota. J Clin Investig. 2022;132:e155101. - PMC - PubMed
    1. Roberti MP, Yonekura S, Duong CPM, Picard M, Ferrere G, Tidjani Alou M, et al. Chemotherapy-induced ileal crypt apoptosis and the ileal microbiome shape immunosurveillance and prognosis of proximal colon cancer. Nat Med. 2020;26:919–31. - PubMed
    1. Mizushima N. A brief history of autophagy from cell biology to physiology and disease. Nat Cell Biol. 2018;20:521–7. - PubMed

MeSH terms

Substances

LinkOut - more resources