. 2025 Feb 19;16(1):108.
doi: 10.1038/s41419-025-07420-7.

Unravelling genotype-phenotype correlations in Stargardt disease using patient-derived retinal organoids

Affiliations

Unravelling genotype-phenotype correlations in Stargardt disease using patient-derived retinal organoids

Avril Watson et al. Cell Death Dis. .

Abstract

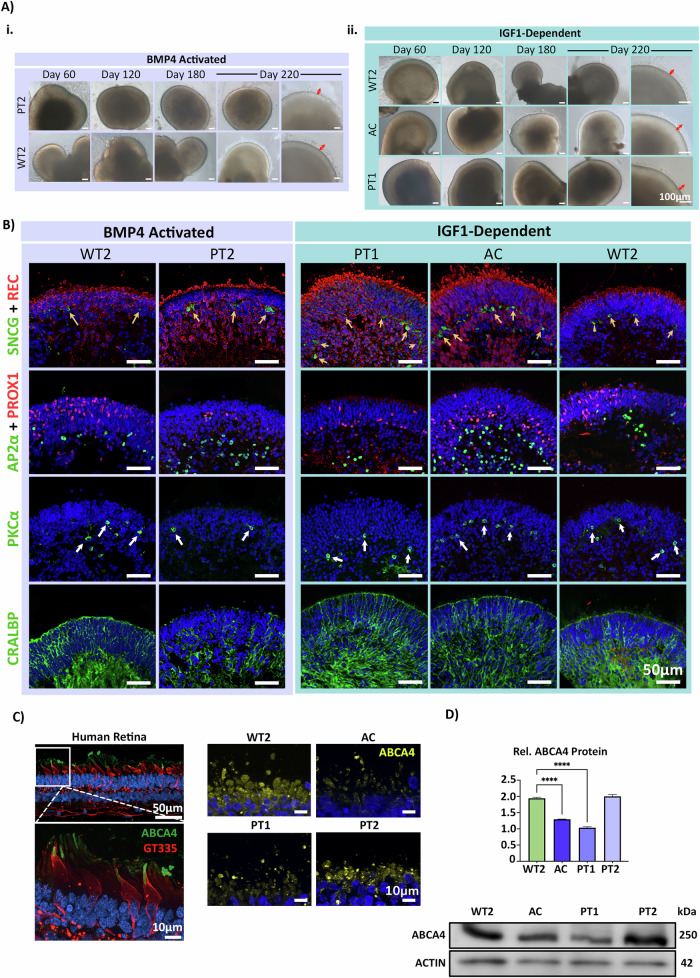
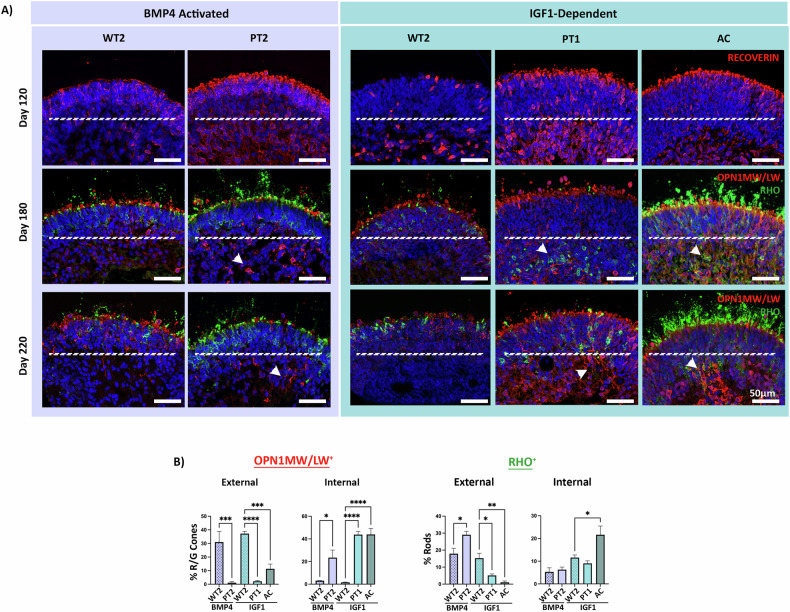
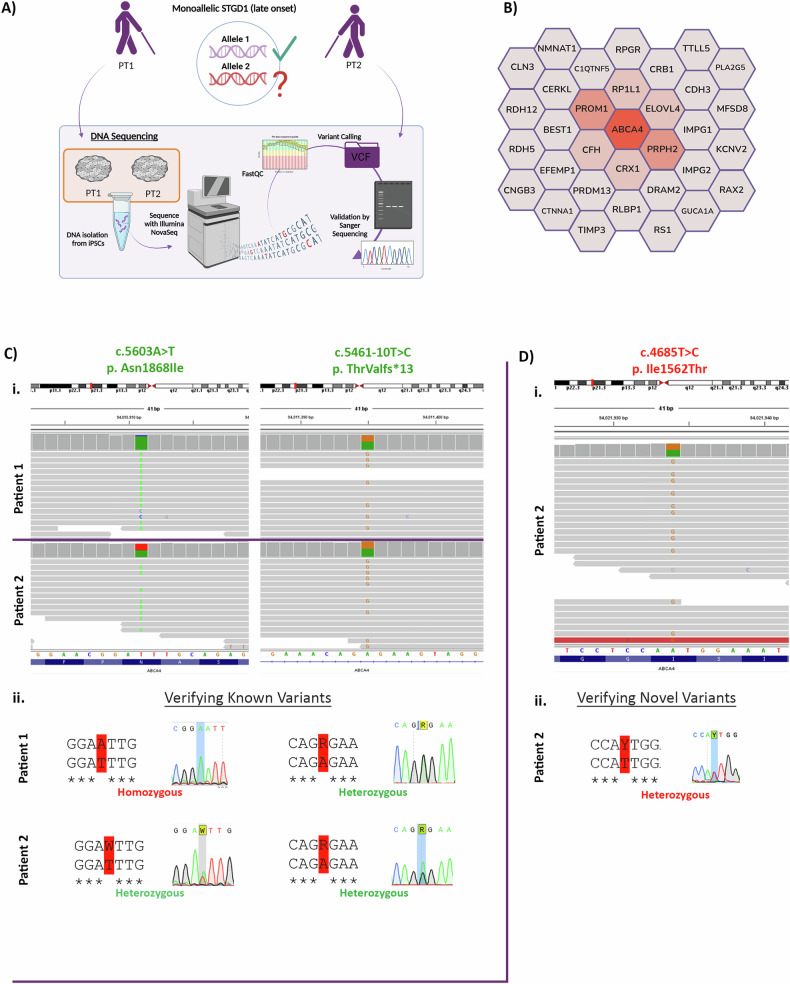
Stargardt disease is an inherited retinopathy affecting approximately 1:8000 individuals. It is characterised by biallelic variants in ABCA4 which encodes a vital protein for the recycling of retinaldehydes in the retina. Despite its prevalence and impact, there are currently no treatments available for this condition. Furthermore, 35% of STGD1 cases remain genetically unsolved. To investigate the cellular and molecular characteristics associated with STGD1, we generated iPSCs from two monoallelic unresolved (PT1 & PT2), late-onset STGD1 cases with the heterozygous complex allele - c.[5461-10 T > C;5603 A > T]. Both patient iPSCs and those from a biallelic affected control (AC) carrying -c.4892 T > C and c.4539+2001G > A, were differentiated to retinal organoids, which developed all key retinal neurons and photoreceptors with outer segments positive for ABCA4 expression. We observed patient-specific disruption to lamination with OPN1MW/LW+ cone photoreceptor retention in the retinal organoid centre during differentiation. Photoreceptor retention was more severe in the AC case affecting both cones and rods, suggesting a genotype/phenotype correlation. scRNA-Seq suggests retention may be due to the induction of stress-related pathways in photoreceptors. Whole genome sequencing successfully identified the missing alleles in both cases; PT1 reported c.-5603A > T in homozygous state and PT2 uncovered a rare hypomorph - c.-4685T > C. Furthermore, retinal organoids were able to recapitulate the retina-specific splicing defect in PT1 as shown by long-read RNA-seq data. Collectively, these results highlight the suitability of retinal organoids in STGD1 modelling. Their ability to display genotype-phenotype correlations enhances their utility as a platform for therapeutic development.


Conflict of interest statement

Competing interests: The authors declare no competing interests Ethics approval and consent to participate: All participants in this research study were identified and enlisted with informed consent by collaborators in the Marie-Skłodowska Curie Innovative Training Network – StarT (Grant no: 813490). All samples were collected in accordance with the tenets of the Declaration of Helsinki and written informed consent was obtained for all patients participating in the study.

Figures

Fig. 1
Fig. 1. STGD1 ROs develop typically with expression of all key retinal neurons and demonstrate expression of ABCA4 on transcript and protein level.
A Representative ROs derived using the BMP4-activated method of RO differentiation are displayed in the purple shaded box. PT2 and WT2 are displayed at various timepoints of differentiation spanning Day 60 to Day 220. Similarly, representative ROs derived from the IGF1-dependent method of differentiation are displayed in the green shaded box. Across all lines and protocols, clearly defined RO structures are developed by Day 120 of differentiation. By Day 180, the characteristic inner and outer segment brush border is apparent on the organoid’s apical edge and continues to develop longer structures by the final timepoint of Day 220 as evidenced by the red arrows in the final column. B All iPSC-derived ROs display expression of markers for REC (photoreceptor cells), SNCG (RGCs, yellow arrows), PROX1 (HCs), AP2α (ACs), PKCα (bipolar cells, white arrows) and CRALBP (Müller glia). REC+ cells appear to mislocalise to the central part of the ROs in a patient-specific manner. C ABCA4 (green) and cone-specific GT335 (red) protein expression in post-mortem retina tissue sample. The ABCA4 protein localises specifically to the POS tips of cone photoreceptor cells. ABCA4 (yellow) protein expression in nascent photoreceptor inner segments (PIS) and POS in Day 220 ROs. Staining patterns appear more diffuse throughout the PIS and POS likely due to immature disc stacking in this developmental model. The degree of observable ABCA4 fluorescence appears to correlate with the estimated residual protein levels determined via the severity of patient line genotype. AC displays the lowest intensity of fluorescence, followed by PT1, PT2 and the unaffected control WT2. D Representative western blotting revealed an abundance of protein at the expected size of ~250 kDa. The intensity of the bands correlated with the severity of genotype possessed by each patient case. The intensity of the ABCA4 protein bands was normalised against ACTIN (ACTB) and quantified. One-way ANOVA test revealed a significant reduction in ABCA4 expression in AC and PT1 samples. Whilst PT2 ABCA4 protein levels remained relatively close to WT2 samples. N = 16 ROs per sample. **** = p-value < 0.0001.
Fig. 2
Fig. 2. STGD1 ROs display a patient-specific photoreceptor mislocalisation that positively correlates with disease severity.
A At Day 120, basally located REC+ photoreceptors are apparent in both patient and control ROs, as expected during this stage of retinogenesis. This phenotype persists at Day 180 in a patient-specific manner with the majority of photoreceptors having migrated to the apex (above white dashed line) as expected in WT2. OPN1MW/LW+ red/green cones being the most affected (white arrowheads). AC and PT1 ROs also display RHO+ rod mislocalisation. There is evidence of correctly aligned photoreceptors on the RO’s apical edge alongside positively stained OS in patient ROs also (shown above the dashed line) suggesting not all photoreceptors are affected. B Mislocalised OPN1MW/LW+ and RHO+ photoreceptors were quantified at Day 220 by counting the number of externally and internally positioned photoreceptor nuclei. External/Internal boundaries are defined by the white line across the central region of the RO. A significant decrease in external OPN1MW/LW+ cones in PT2, PT1 and AC was observed when compared with their respective WT2 controls. In contrast, internal OPN1MW/LW+ cones displayed a significant increase in PT2, PT1 and AC ROs. Significance was highest for the AC ROs which displayed the most enhanced phenotype. External RHO+ cells displayed a higher number of RHO+ cells in PT2 when compared with WT2, whilst AC ROs showed a significant decrease in externally aligned RHO+ cells. Statistics: One-way ANOVA. N = 5 ROs per triplicate - comparing only within protocol groups (e.g., BMP4-activated PT2 vs WT2). * = p-val 0.05, ** = p-val 0.01, *** = p-val 0.001, **** = p-val 0.0001.
Fig. 3
Fig. 3. scRNA-Seq shows pathomechanism of photoreceptor mislocalisation to be likely secondary to activation of stress-response in STGD1 ROs.
A Schematic depicting the scRNA-Seq experimental process. Briefly, ROs are derived from iPSCs and matured to Day 200 where all retinal neurons are expected to be developed. scRNA-Seq library prep is conducted on RNA transcripts from dissociated single cells of the STGD1 ROs and barcoded mRNA transcripts are sequenced using Illumina NextSeq 500 platform. B An analysis of cell cycle progression in STGD1 ROs. Histograms display the 3 phases of the cell cycle (G1, G2M and S phase) in both cone and rod photoreceptors of PT2, AC and WT ROs (WT = WT2 and WT3 ROs pooled). Cone and rod photoreceptors in both PT2 and AC ROs show reduced numbers of cells in G1 phase of cell cycle, and instead show increased cell numbers in the intermediatory phases S and/or G2M phase. Fisher’s Exact test was performed to measure the variance in abundance of cells in different phases of the cycle. * = p-val 0.05, *** = p-val 0.001. C An analysis of apoptotic gene expression in STGD1 ROs reveals elevated expression of apoptosis-related genes in PT2 cones when compared with WT control. In rods, there appears to significantly lower expression of apoptosis-related genes in both PT2 and AC ROs. D DEG analysis revealed several affected disease pathways in STGD1 ROs. The dot plot represents the most significantly altered pathways ranging from 10-30% (blue to red gradient) of overall genes differentially expressed between patient and control cone and rod photoreceptors. The significance of affection is depicted as the overall size of the dot ranging from a -log p-value range of 10-30. Common pathways affected include EIF2 signalling, oxidative phosphorylation, mitochondrial dysfunction and granzyme A signalling which are all involved in stress response. Phototransduction was also significantly altered across all photoreceptors. Figures were created using BioRender.com.
Fig. 4
Fig. 4. Detection of missing alleles in PT1 and PT2 cases with WGS.
A Schematic of DNA sequencing strategy. Briefly, DNA was isolated from PT1 and PT2 iPSCs and sequenced with the Illumina NovaSeq to yield WGS datasets for the identification of missing inheritance in PT1 and PT2 samples. B Macular disease gene panel of 33 genes used in the filtering of WGS to identify missing variants in the monoallelic STGD1 cases included in this study. Likely to least-likely genes causative of disease phenotype are arranged spatially from the centre to periphery and colour coded red to grey respectively. C (i). IGV view of the c.5461-10 T > C and c.5603 A > T variant in ABCA4. Read depth appears to be approx. 50% in both PT1 and PT2 indicating heterozygosity of c.5461-10 T > C validating previous reports with these patients. Read depth appears to be approx. 50% in PT2 for c.5603 A > T indicating heterozygosity of this variant validating previous reports. However, almost 100% read depth in PT1 suggests homozygosity of the variant thereby providing biallelic resolution for PT1. ABCA4 is viewed in 3’←5’ orientation on IGV and so variants are read in reverse complement. (ii). Sanger sequence traces verifying the variant identified in NGS analysis. D (i). IGV view of the c.4685 T > C variant in ABCA4. Read depth appears to be approx. 50% in PT2 indicating heterozygosity of this variant, potentially resolving the missing allele in PT2 case. (ii). Sanger sequence traces verifying the variant identified in NGS analysis. Figures were created using BioRender.com.
Fig. 5
Fig. 5. Validation of WGS-identified variants in LRS.
A Schematic of LRS strategy for assessing RNA defects in PT1 and PT2 cases. RNA transcripts are isolated from 220-day old ROs to ensure capture of tissue-specific ABCA4 isoforms. B HiFi reads displayed in IGV browser for LRS data derived from Day 220 ROs. WT2 displays no defect, whereas PT1 and PT2 display the A > T variant change. The green boxes correspond to the nucleotide A, which on the reverse strand is T. The variant is homozygous in PT1 and appears to be dominantly expressed in PT2 despite its heterozygous status, except for one read (red box) which is unaltered. C HiFi reads displayed in IGV browser for LRS data derived from Day 220 ROs. The c.4685 T > C variant is present in one read of PT2 transcripts. The orange read within the red box shows a nucleotide change to ‘G’, which in the reverse strand is ‘C’ consistent with the reported variant. The reduced incidence of reads containing this variant are likely due to transcript degradation or perhaps ASE. Figures were created using BioRender.com.
Fig. 6
Fig. 6. Functional effects of c.5461-10 T > C intronic variant on ABCA4 expression in STGD1 ROs.
A HiFi reads displayed in IGV browser for LRS data derived from Day 220 ROs. Intronic variants are not typically observed in sequenced reads unless the intron is retained. PT1 has evidence of one intron-retaining read containing the mutation in question (brown nucleotide in navy box). The brown nucleotide corresponds to G, which is C on the reverse strand. B Sashimi plot indicating the number of long reads (PacBio HiFi reads) supporting the skipping of exon 39 or exons 39 + 40 (associated with the c.5461-10 T > C variant) in ABCA4 from WT2, PT1 and PT2.

References

    1. Blacharski. Fundus flavimaculatus. Retinal dystrophies and degenerations. 1988:135–59.
    1. Runhart EH, Dhooge P, Meester-Smoor M, Pas J, Pott JWR, van Leeuwen R, et al. Stargardt disease: monitoring incidence and diagnostic trends in the Netherlands using a nationwide disease registry. Acta Ophthalmol. 2022;100:395–402. - PMC - PubMed
    1. Rotenstreich Y, Fishman GA, Anderson RJ. Visual acuity loss and clinical observations in a large series of patients with Stargardt disease. Ophthalmology. 2003;110:1151–8. - PubMed
    1. Allikmets R, Singh N, Sun H, Shroyer NF, Hutchinson A, Chidambaram A, et al. A photoreceptor cell-specific ATP-binding transporter gene (ABCR) is mutated in recessive Stargardt macular dystrophy. Nat Genet. 1997;15:236–46. - PubMed
    1. Lenis TL, Hu J, Ng SY, Jiang Z, Sarfare S, Lloyd MB, et al. Expression of ABCA4 in the retinal pigment epithelium and its implications for Stargardt macular degeneration. Proc Natl Acad Sci. 2018;115:E11120–E7. - PMC - PubMed

Substances

LinkOut - more resources