. 2025 Feb 19;15(1):6081.
doi: 10.1038/s41598-025-87537-z.

Metformin inhibits the growth of SCLC cells by inducing autophagy and apoptosis via the suppression of EGFR and AKT signalling

Affiliations

Metformin inhibits the growth of SCLC cells by inducing autophagy and apoptosis via the suppression of EGFR and AKT signalling

Hong Xia et al. Sci Rep. .

Abstract

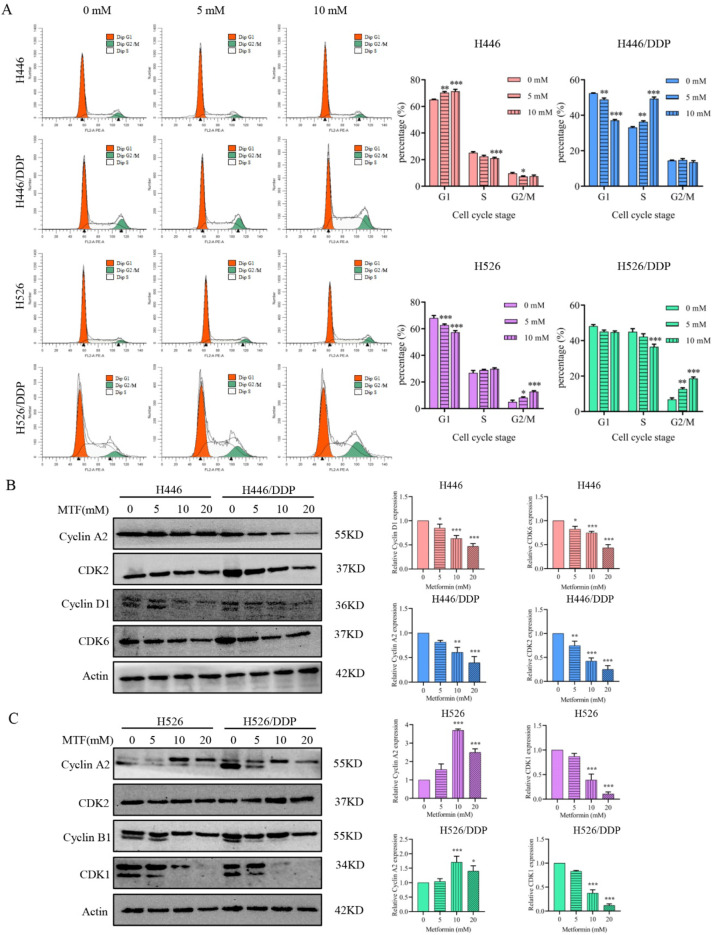
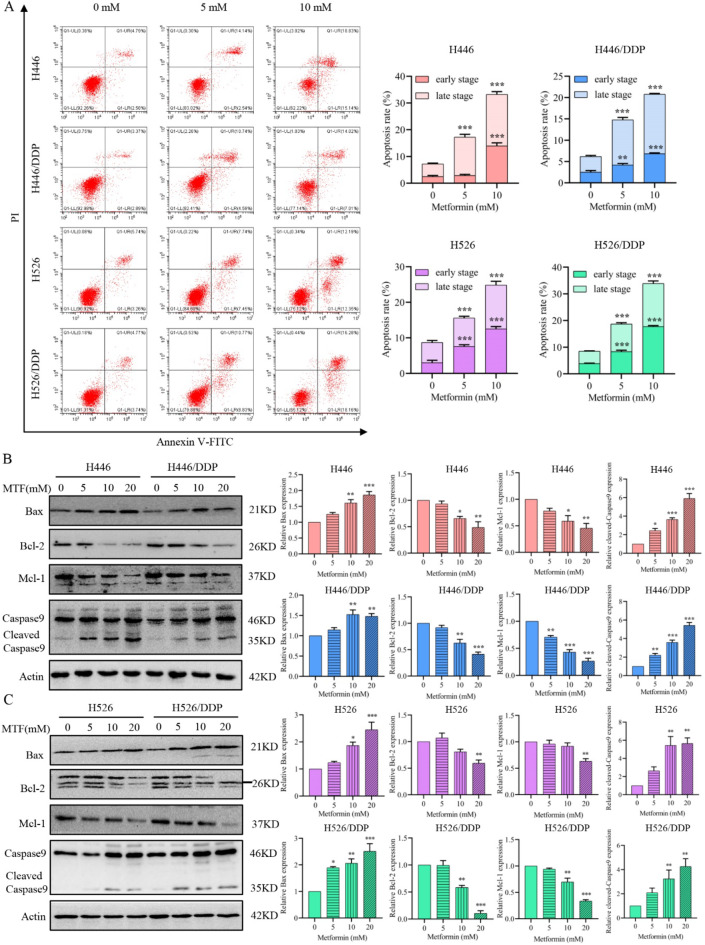
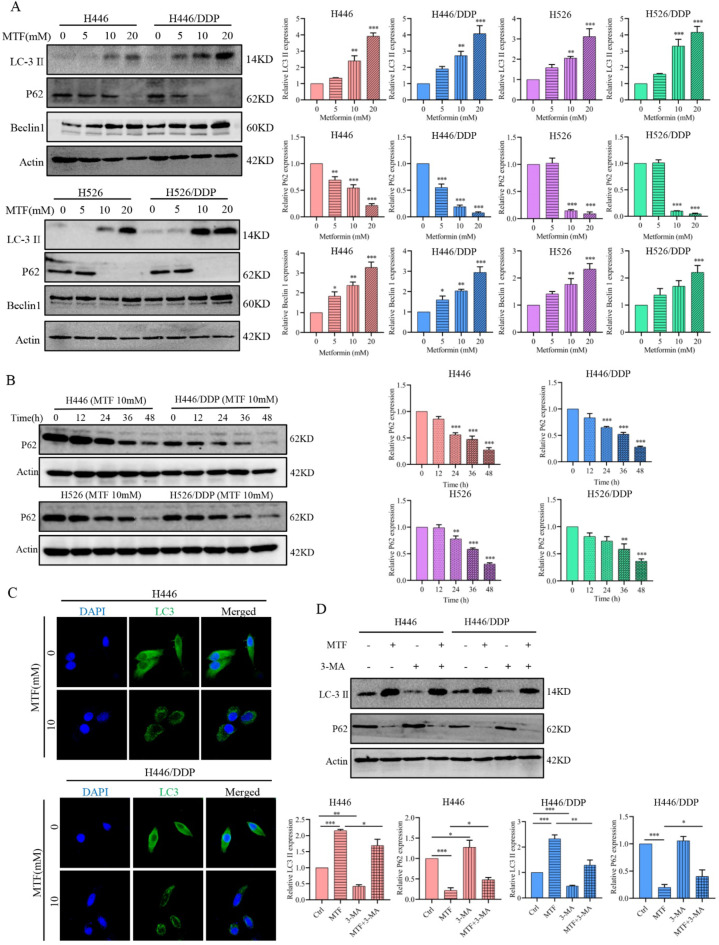
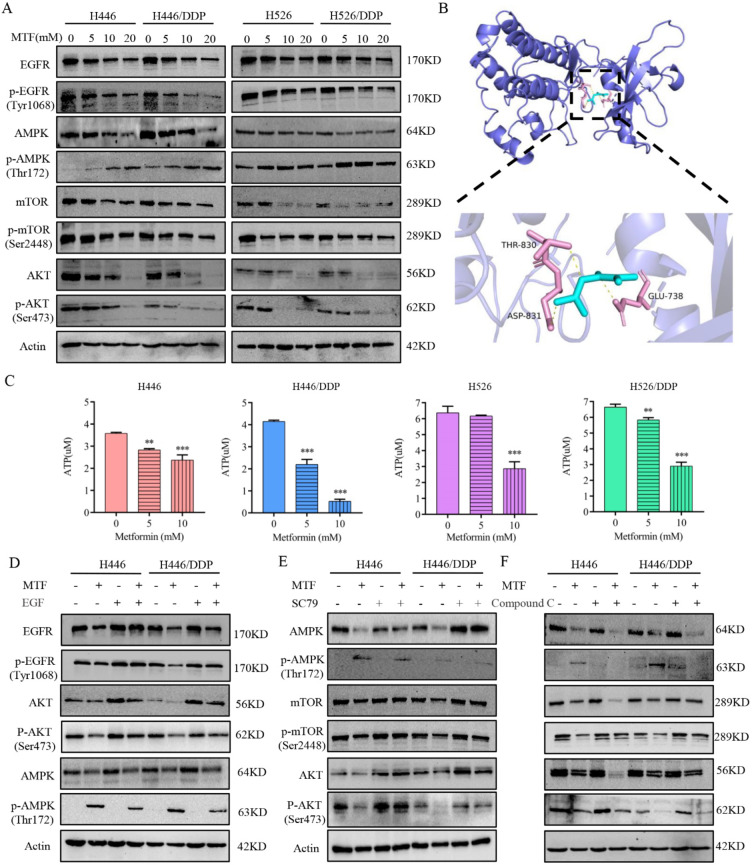
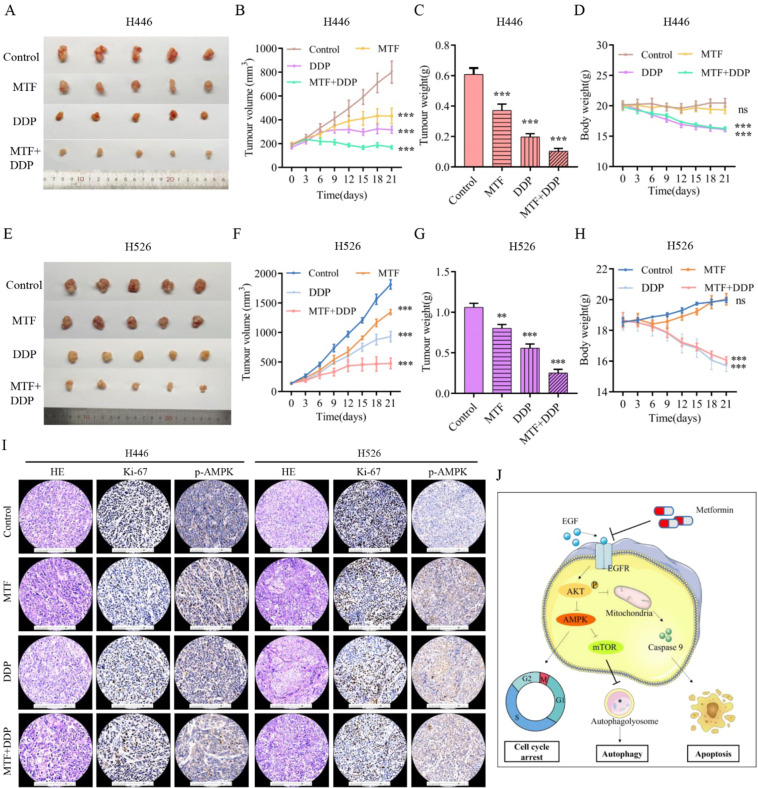
Small cell lung cancer (SCLC) is a therapeutically challenging disease. Metformin, an effective agent for the treatment of type 2 diabetes, has been shown to have antitumour effects on many cancers, including non-small cell lung cancer (NSCLC) and breast cancer. Currently, the antitumour effects of metformin on SCLC and the underlying molecular mechanisms remain unclear. CCK-8, EdU, colony formation, flow cytometry, immunofluorescence, molecular docking, western blotting, nude mouse transplanted tumour model, and immunohistochemistry experiments were conducted to analyse gene functions and the underlying mechanism involved. In vitro experiments demonstrated that metformin inhibited the growth of SCLC cells (H446, H526, H446/DDP and H526/DDP), which was confirmed in xenograft mouse models in vivo. Additionally, metformin induced cell cycle arrest, apoptosis, and autophagy in these SCLC cells. The molecular docking results indicated that metformin has a certain binding affinity for EGFR. The western blotting results revealed that metformin decreased the expression of EGFR, p-EGFR, AKT, and p-AKT, which could be reversed by EGF and SC79. Moreover, metformin activated AMPK and inactivated mTOR, and compound C and SC79 increased the levels of p-mTOR. Metformin can not only enhance the antitumour effect of cisplatin but also alleviate the toxic effects of cisplatin on the organs of xenograft model animals. In summary, the current study revealed that metformin inhibits the growth of SCLC by inducing autophagy and apoptosis via suppression of the EGFR/AKT/AMPK/mTOR pathway. Metformin might be a promising candidate drug for combination therapy of SCLC.

Keywords: Apoptosis; Autophagy; Cell cycle arrest; Metformin; SCLC.


Conflict of interest statement

Declarations. Competing interests: The authors declare no competing interests. Ethical approval: All animal experiments were approved by the Experimental Animal Ethics Committee of Hubei University of Medicine [2022-No.035].

Figures

Fig. 1
Fig. 1
Metformin inhibits the viability, colony formation, and proliferation of SCLC cells in vitro. (A) The viability of H446, H446/DDP, H526 and H526/DDP cells was assessed after treatment with various concentrations of metformin (0, 2.5, 5, 10, 20, and 40 mM) via a CCK-8 assay. The IC50 of metformin (in mM) after 48 h of treatment was determined. (B,C) The colony formation (B) and proliferation (C) of H446, H446/DDP, H526 and H526/DDP cells were evaluated after treatment with various concentrations of metformin (0, 5, and 10 mM, respectively). The error bars indicate the standard deviation (SD). Significant difference compared with the untreated control: *p < 0.05; **p < 0.01; ***p < 0.001.
Fig. 2
Fig. 2
Metformin blocks the cell cycle of SCLC cells. (A) The cell cycle distribution of SCLC cells was detected by flow cytometry. The cells were treated with different concentrations of metformin (0, 5, and 10 mM) for 48 h. The data are presented as the means ± SDs of values from three independent experiments. *p < 0.05; **p < 0.01; ***p < 0.001 compared with the control group. (B,C) The expression levels of cell cycle-related proteins were determined by western blotting in H446, H446/DDP (B), H526, and H526/DDP cells (C) after treatment with metformin (MTF). Pixel density analysis of protein expression compared with that in the untreated control groups (set to 1). Significant difference compared with the untreated control: *p < 0.05; **p < 0.01; ***p < 0.001. n = 3.
Fig. 3
Fig. 3
Metformin promotes SCLC cell apoptosis in a dose-dependent manner. (A) Apoptosis rates were measured via flow cytometry via an Annexin V-FITC Apoptosis Detection Kit. The cells were treated with different concentrations of metformin (0, 5, and 10 mM) for 48 h. The data are shown as the means ± SDs of values from triplicate experiments. *p < 0.05; **p < 0.01; ***p < 0.001 versus the control group. (B,C) Western blotting analysis was conducted to detect the expression levels of apoptosis-related proteins, including Bax, Bcl-2, Mcl-1, and total and cleaved caspase 9, in H446, H446/DDP (B), H526, and H526/DDP (C) cells treated with different concentrations of metformin (0, 5, 10, and 20 mM) for 48 h. Pixel density analysis of protein expression compared with that in the untreated control groups (set to 1). Significant difference compared with the untreated control: *p < 0.05; **p < 0.01; ***p < 0.001. n = 3.
Fig. 4
Fig. 4
Metformin activates autophagy in SCLC cells. (A) Autophagy-related proteins, including LC3, P62, and Beclin1, were detected by western blotting after H446, H446/DDP, H526, and H526/DDP cells were treated with different concentrations of metformin (0, 5, 10, and 20 mM) for 48 h. (B) The protein levels of p62 were detected by western blotting after the cells were treated with 10 mM metformin for 12, 24, 36, or 48 h. (C) Immunofluorescence analysis of LC3 in H446 and H446/DDP cells treated with or without metformin for 48 h. The LC3 protein was labelled green (Alexa 488), and the nuclei were labelled blue (DAPI). (D) The expression of LC3 and p62 was examined in H446 and H446/DDP cells after treatment with 3-MA (5 mM) combined with metformin (10 mM) for 48 h. Significant difference compared with the untreated control: *p < 0.05; **p < 0.01; ***p < 0.001. n = 3.
Fig. 5
Fig. 5
Metformin inhibits the EGFR/AKT/AMPK/mTOR axis in SCLC cells. (A) The protein levels of AMPK, p-AMPK, mTOR, p-mTOR, AKT, p-AKT, EGFR, and p-EGFR were measured in H446, H446/DDP, H526, and H526/DDP cells treated with different concentrations of metformin for 48 h via western blotting. (B) The binding mode of metformin docked to EGFR. (C) ATP content of SCLC cells after treatment with metformin (0, 5, or 10 mM) for 48 h. Significant difference compared with the untreated control: *p < 0.05; **p < 0.01; ***p < 0.001. n = 3. (D) The protein levels of EGFR, p-EGFR, AKT, p-AKT, AMPK, and p-AMPK were measured via western blotting in H446 and H446/DDP cells treated with metformin (10 mM), EGF (50 µg/ml), or metformin + EGF for 48 h. (E) The protein levels of AKT, p-AKT, mTOR, p-mTOR, AMPK, and p-AMPK were measured via western blotting in H446 and H446/DDP cells treated with metformin (10 mM), SC79 (4 µg/ml), or metformin + SC79 for 48 h. (F) The protein levels of AMPK, p-AMPK, mTOR, p-mTOR, AKT, and p-AKT were measured in H446 and H446/DDP cells treated with metformin (10 mM), compound C (2 µM), or metformin + Compound C for 48 h via western blotting.
Fig. 6
Fig. 6
Metformin inhibits the growth of H446 and H526 cells in vivo. (A,E) Images of isolated tumours from each group after treatment with saline, metformin, cisplatin, or metformin + cisplatin (n = 5). (B,F) Growth of the subcutaneous tumours in each group. The tumour volume was calculated on the basis of measurements with a calliper every 3 days. (C,G) The tumour weight in each group was measured after isolation from the female mice. (D,H) The body weights of the female mice after treatment with saline, metformin, cisplatin, or metformin combined with cisplatin for 21 days. Statistical analyses were performed via ANOVA, which revealed significant differences compared with the untreated control: *p < 0.05; **p < 0.01; ***p < 0.001. n = 5. (I) Images of HE staining and IHC staining (Ki-67 and p-AMPK) of tumour tissues from subcutaneous xenograft models (magnification: ×200). (J) Schematic description of the main molecular mechanism by which metformin suppresses SCLC growth.

References

    1. Xia, C. F. et al. Cancer statistics in China and United States, 2022: profiles, trends, and determinants. Chin. Med. J.-Peking135, 584–590. 10.1097/Cm9.0000000000002108 (2022). - PMC - PubMed
    1. Govindan, R. et al. Changing epidemiology of small-cell lung cancer in the United States over the last 30 years: analysis of the surveillance, epidemiologic, and end results database. J. Clin. Oncol.24, 4539–4544. 10.1200/JCO.2005.04.4859 (2006). - PubMed
    1. Khan, P. et al. Epigenetic landscape of small cell lung cancer: small image of a giant recalcitrant disease. Semin. Cancer Biol.83, 57–76. 10.1016/j.semcancer.2020.11.006 (2022). - PMC - PubMed
    1. Farago, A. F. & Keane, F. K. Current standards for clinical management of small cell lung cancer. Transl. Lung Cancer Res.7, 69–79. 10.21037/tlcr.2018.01.16 (2018). - PMC - PubMed
    1. Cheng, Y. et al. Effect of first-line serplulimab vs placebo added to chemotherapy on survival in patients with extensive-stage small cell lung cancer: the ASTRUM-005 randomized clinical trial. JAMA328, 1223–1232. 10.1001/jama.2022.16464 (2022). - PMC - PubMed

MeSH terms