. 2025 Feb 19;16(1):114.
doi: 10.1038/s41419-025-07410-9.

A novel identified epithelial ligand-receptor-associated gene signature highlights POPDC3 as a potential therapy target for non-small cell lung cancer

Affiliations

A novel identified epithelial ligand-receptor-associated gene signature highlights POPDC3 as a potential therapy target for non-small cell lung cancer

Xiao-Ren Zhu et al. Cell Death Dis. .

Abstract

The tumor microenvironment (TME) is pivotal in non-small cell lung cancer (NSCLC) progression, influencing drug resistance and immune cell behavior through complex ligand-receptor (LR) interactions. This study developed an epithelial LR-related prognostic risk score (LRrisk) to identify biomarkers and targets in NSCLC. We identified twenty epithelial LRs with significant prognostic implications and delineated three molecular NSCLC subtypes with distinct outcomes, pathological characteristics, biological pathways, and immune profiles. The LRrisk model was constructed using twelve differentially expressed ligand-receptor interaction-related genes (LRGs), with a focus on POPDC3 (popeye domain-containing protein 3), which was overexpressed in NSCLC cells. Functional assays revealed that POPDC3 knockdown reduced cell proliferation, migration, invasion, and epithelial-mesenchymal transition (EMT), while its overexpression promoted cancerous activities. In vivo, POPDC3 silencing hindered, and its overexpression accelerated the growth of NSCLC xenografts in nude mice. Additionally, high expression levels of POPDC3 in NSCLC tissues were associated with enhanced CD4+ T cell infiltration and increased PD-1 expression within the TME. Moreover, ectopic POPDC3 overexpression in C57BL/6 J mouse Lewis lung carcinoma (LLC) xenografts enhanced CD4+ T cell infiltration and PD-1 expression in the TME. This research establishes a robust epithelial LR-related signature, highlighting POPDC3 as a critical facilitator of NSCLC progression and a potential therapeutic target.


Conflict of interest statement

Competing interests: The authors declare no competing interests. Ethics approval: According to the Declaration of Helsinki, the Ethics Committee of Jiangsu University has approved this study.

Figures

Fig. 1
Fig. 1. Identification of ligand-receptor interactions associated with epithelial cells in NSCLC tumor microenvironment.
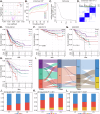
tSNE (t-distributed Stochastic Neighbor Embedding) and UMAP (Uniform Manifold Approximation and Projection) of 10,664 cells of four NSCLC samples and their adjacent normal samples (A). Dot plot showing the expression pattern of fibroblasts, alveolar macrophages, B cells, epithelial cells and so on (B). tSNE and UMAP demonstrated different cell types in these samples (C). The number of each cell type in eight samples (D). Frequencies of the 8 cell types across the samples are depicted in stacked bar charts (E). tSNE and UMAP showing cell distribution in tumor and paracancer samples (F). A heatmap reveals the five most prominent marker genes defining various clusters in the NSCLC specimens (G). Overview of selected statistically significant interactions between epithelial cells, fibroblasts and others (H). Detailed network of cell-cell interaction weights among malignant epithelial cells with other cell subsets (I).
Fig. 2
Fig. 2. Construction of molecular subtypes of NSCLC based on malignant epithelial ligand-receptor interactions.
Volcano map of differential ligand or receptor using univariate Cox analysis (A). CDF (Cumulative Distribution Function) curves for k = 2–10 in the TCGA-NSCLC cohort (B). CDF delta area curve in the TCGA-NSCLC cohort (C). Heatmap clustering of TCGA-NSCLC datasets when consensus (k) = 3 (D). Survival disparities across the molecular subtypes within the TCGA-NSCLC cohort (E), as well as in external validation cohorts GSE31210 (F), GSE50081 (G), and GSE31334 (H). The Sankey showed the distribution ratio of 991 samples concerning clinical staging (I). Composition percentage of the three clusters in T stage (J) and clinical stage (K), OS event (L).
Fig. 3
Fig. 3. Immune characteristics of different molecular subtypes in NSCLC based on malignant epithelial ligand-receptor interactions.
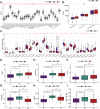
The immune cell scores among the different groups were analyzed using the CIBERSORT algorithm (A). Immune cell scoring across groups was also determined through the application of the ESTIMATE algorithm (B). Differential expression of immune checkpoint genes between the C1 and C3 subtypes was meticulously examined (C). Differences in the TIDE analysis results among the groups were identified, including variations in TIDE scores (D), Exclusion scores (E), expression of PD-L1 (F), levels of TAM.M2 (G), prevalence of MDSC (H), and expression of MSI (I). *P < 0.05; **P < 0.01; ***P < 0.001; “n.s.” stands for P > 0.05.
Fig. 4
Fig. 4. Construction and validation of malignant epithelial ligand-receptor interactions risk (LRrisk) signature in NSCLC.
Heat map of enrichment scores of KEGG-related pathways in the three subtypes (A). Bubble map of associated pathways in which cluster1 is activated/suppressed (cluster1 vs. no_cluster1 subtype) (B). Bubble map of associated pathways in which cluster3 is activated/suppressed (cluster3 vs. no_cluster3 subtype) (C). Volcano map of DEGs between C1 and C3 subtype using univariate Cox analysis (D). The LASSO regression model is constructed using 12 genes predictive of patient outcomes in the TCGA-NSCLC dataset (E, F). The KM analysis of the OS between two different groups in TCGA-NSCLC cohort (G), GSE31210 (I), GSE50081 (K) and GSE3134 (M) data cohort. The ROC curves were employed to evaluate the model’s predictive accuracy in the TCGA-NSCLC cohort (H) as well as in the GSE31210 (J), GSE50081 (L), and GSE3134 (N) cohorts. ***P < 0.001.
Fig. 5
Fig. 5. Correlation between LRrisk and immune cell infiltration or immunotherapy response in NSCLC.
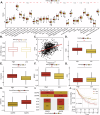
Analysis of the immune cell scores between the high-risk and low-risk groups using the CIBERSORT algorithm (A). The Th1/IFN Score, indicative of a Th1/IFN-gamma response, was compared between the groups (B). A correlation analysis was conducted to examine the relationship between the TIDE score and the risk-score (C). Further TIDE analysis within the TCGA-NSCLC cohort revealed differences in TIDE scores (D), measures of immune exclusion (E), the presence of MDSC (F), and CD8 + T cell expression (G) between the two groups. The LRrisk score’s impact on patient response to immunotherapy, categorized by CR/PR and SD/PD, was analyzed in the IMvigor210 cohort (H). The proportion of SD/PD outcomes post-immunotherapy was compared to patients with high versus low-risk scores (I). KM analysis was employed to delineate the prognostic significance of the LRrisk score in IMvigor210 cohort (J). *P < 0.05; **P < 0.01; ***P < 0.001; “n.s.” stands for P > 0.05.
Fig. 6
Fig. 6. Expression of 12 different epithelial ligand-receptor interaction-related genes in NSCLC cells and normal lung epithelial cells.
qRT-PCR was utilized to measure mRNA expression in a human lung epithelial cell line alongside four established NSCLC cells (A549, H1299, H520, and H1703) (A). The levels of listed proteins were examined (B, C). *P < 0.05; **P < 0.01; ***P < 0.001; “n.s.” stands for P > 0.05.
Fig. 7
Fig. 7. Expression and prognostic relevance of POPDC3 in NSCLC.
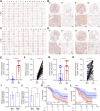
POPDC3 immunohistochemistry (IHC) microarray of NSCLC tissues and their adjacent normal tissues were shown (A, C) and the representative IHC images of each microarray were presented (B, D). The expression of POPDC3 was quantified and compared in LUAD and LUSC tissues versus adjacent normal tissues, analyzed both as unpaired and paired samples (EH). The association between POPDC3 intensity scores and OS events was investigated for both LUAD (I) and LUSC (J) cases. KM survival analyses based on POPDC3 expression in LUAD patients (K) and LUSC patients (L) were shown. *P < 0.05; **P < 0.01; ***P < 0.001; “n.s.” stands for P > 0.05. Scale bar = 100 μm.
Fig. 8
Fig. 8. POPDC3 silencing inhibits NSCLC cell proliferation, motility, invasion, and epithelial-mesenchymal transition (EMT).
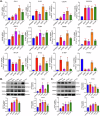
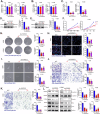
Established NSCLC cell lines (A549, H1299) were genetically modified using shRNA sequences targeting POPDC3 (“sh-POPDC3 -S1/S2”) or a non-targeting scramble control shRNA (“shc”). Cells were then cultivated and screened for changes in the expression of listed genes and proteins (AE); The impact of POPDC3 suppression on cell behaviors was assessed over indicated cultivation durations, examining cell viability (F), colony-forming capabilities (G), EdU incorporation (H), and cell motility (I). The cell migration (J) and invasion (K) were evaluated with established assays. The expression of listed proteins was analyzed using Western blotting (L). Error bars stand for mean ± standard deviation (SD, n = 3). Statistical significance is denoted as *P < 0.05; **P < 0.01; ***P < 0.001 versus “shc” cells, while “n.s.” stands for P > 0.05. Scale bar = 100 μm.
Fig. 9
Fig. 9. POPDC3 overexpression exerts pro-cancerous activity in NSCLC cells.
Established NSCLC cell lines (A549, H1299) (AI) along with primary human NSCLC cells (priNSCLC-1) (JO) were genetically modified to overexpress POPDC3 via a lentiviral vector (“POPDC3-OE”) compared to a control vector (“Vec”), employing puromycin selection. The expression of listed genes and proteins was shown (AD, JL). Subsequently, after a designated incubation period, the cells underwent various assays to assess cell viability (E), cell colony formation (F, M), cell proliferation indicated by EdU incorporation (G, N), as well as migration (H) and invasion (I, O). Error bars stand for mean ± standard deviation (SD, n = 3). Statistical significance is denoted as *P < 0.05; **P < 0.01; ***P < 0.001 versus “Vec” cells, while “n.s.” stands for P > 0.05. Scale bar = 100 μm.
Fig. 10
Fig. 10. POPDC3 shRNA suppresses H1299 xenograft growth in vivo.
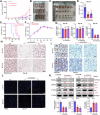
Female BALB/c nude mice were implanted with H1299 cells expressing POPDC3-targeting shRNA (“POPDC3-sh-S1”, “POPDC3-sh-S2”) or a non-targeting scramble control shRNA (“shC”) to establish the experimental model. Tumor growth was monitored by measuring tumor volumes (A) and recording mouse body weights (F) at 5-day intervals. After 30 days, tumors were surgically excised (B, C), and their weights were measured (D). A tumor-free survival curve was also displayed (E). Within the harvested tumor tissues, the levels of listed genes (G) were evaluated, with results quantified. Representative IHC images of POPDC3 (H) and Ki67 (I) in tumor tissues were shown. Additionally, representative images of TUNEL staining on tumor tissues were presented (J). The expression of apoptosis-related proteins was analyzed using Western blotting (K). Statistical significance is denoted as *P < 0.05; **P < 0.01; ***P < 0.001 versus “shc” cells, while “n.s.” stands for P > 0.05. Scale bar = 50 μm.
Fig. 11
Fig. 11. PODPC3 overexpression promotes primary NSCLC cell growth in vivo.
At 3 × 10⁶ cells per mouse, priNSCLC-1 primary NSCLC cells with the lentiviral POPDC3 overexpression construct (“POPDC3-OE”) or the corresponding vector (“Vec”) were s.c. injected to the nude mice to establish the experimental model. Tumor growth was monitored by measuring tumor volumes (A) and recording mouse body weights (C) at 5-day intervals. After 30 days, tumors were surgically excised, and their weights were measured (B). Within the harvested tumor tissues, the levels of listed genes and proteins (D–H) were evaluated, with results quantified. Representative IHC images of POPDC3 in tumor tissues were shown (I). Data were presented as mean ± standard deviation (SD). Statistical significance is denoted as *P < 0.05; **P < 0.01; ***P < 0.001 versus “Vec” cells, while “n.s.” stands for P > 0.05. Scale bar = 50 μm.
Fig. 12
Fig. 12. POPDC3 overexpression is associated with immune cell infiltration in NSCLC.
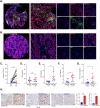
Representative mIHC images of patient samples with high-POPDC3 expression (A) and low-POPDC3 expression (B) were presented, with each color panel shown alongside. Various markers were visualized by distinct colors, including POPDC3 in red, CD8 in turquoise, CD4 in green, Pan-CK in pink and PD1 in gold, with DAPI used for counterstaining. Quantitative comparison of POPDC3 distribution within NSCLC tissue relative to normal tissue was conducted using an H-score (C). The association between POPDC3 expression levels and the presence of CD8+ (D) and CD4+ T cells (E) was investigated. The proportion of PD1+ cells (F) and CD4+PD1+ cells (G) was explored by comparing the high versus low-POPDC3-expressing groups within the tumor tissues (F). At 3 × 10⁶ cells per mouse, Lewis lung carcinoma (LLC) cells with the lentiviral POPDC3 overexpression construct (“POPDC3-OE”) or the corresponding vector (“Vec”) were s.c. injected to the C57BL/6 J mice to establish the experimental model. After 30 days, the mice were sacrificed, and the NSCLC tumor tissues were fixed with 10% formaldehyde, sectioned and analyzed by immunohistochemical staining (G). Representative IHC staining of POPDC3, CD4 and PD1, and their quantitative analyses in LLC xenograft tissues in C57BL/6J mice (H). *P < 0.05; **P < 0.01; ***P < 0.001; “n.s.” stands for P > 0.05. Scale bar = 50 μm.

References

    1. Siegel RL, Miller KD, Fuchs HE, Jemal A. Cancer statistics, 2022. CA Cancer J Clin. 2022;72:7–33. - PubMed
    1. Deng W, Xu T, Xu Y, Wang Y, Liu X, Zhao Y, et al. Survival patterns for patients with resected N2 non-small cell lung cancer and postoperative radiotherapy: a prognostic scoring model and heat map approach. J Thorac Oncol. 2018;13:1968–74. - PMC - PubMed
    1. Liu Y, Fan J, Xu T, Ahmadinejad N, Hess K, Lin SH, et al. Extracellular vesicle tetraspanin-8 level predicts distant metastasis in non-small cell lung cancer after concurrent chemoradiation. Sci Adv. 2020;6:eaaz6162. - PMC - PubMed
    1. Mansfield AS, Aubry MC, Moser JC, Harrington SM, Dronca RS, Park SS, et al. Temporal and spatial discordance of programmed cell death-ligand 1 expression and lymphocyte tumor infiltration between paired primary lesions and brain metastases in lung cancer. Ann Oncol. 2016;27:1953–8. - PMC - PubMed
    1. Aggarwal C, Thompson JC, Black TA, Katz SI, Fan R, Yee SS, et al. Clinical implications of plasma-based genotyping with the delivery of personalized therapy in metastatic non-small cell lung cancer. JAMA Oncol. 2019;5:173–80. - PMC - PubMed

MeSH terms