. 2025 Feb 19;16(1):1761.
doi: 10.1038/s41467-025-57024-0.

TREM2 promotes lung fibrosis via controlling alveolar macrophage survival and pro-fibrotic activity

Affiliations

TREM2 promotes lung fibrosis via controlling alveolar macrophage survival and pro-fibrotic activity

Huachun Cui et al. Nat Commun. .

Abstract

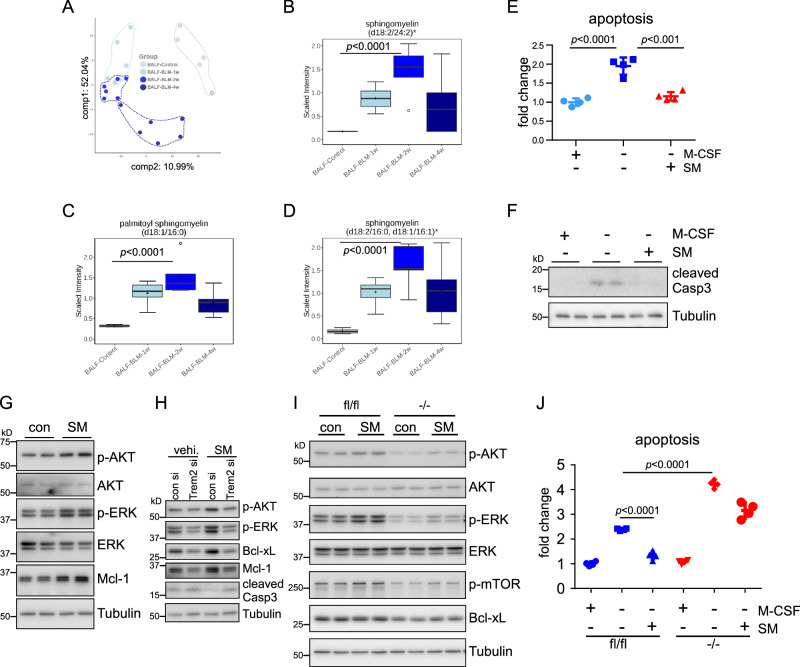
Lung macrophages play a pivotal role in pulmonary fibrosis, with monocyte-derived alveolar macrophages driving disease progression. However, the mechanisms regulating their pro-fibrotic behavior and survival remain unclear, and effective therapeutic strategies are lacking. Here we show that triggering receptors expressed on myeloid cells 2 are predominantly expressed on monocyte-derived alveolar macrophages in fibrotic mouse lungs and are significantly elevated in lung macrophages from patients with idiopathic pulmonary fibrosis. Deletion or knockdown of this receptor disrupts intracellular survival signaling, promotes macrophage apoptosis, and attenuates their pro-fibrotic phenotype. We further demonstrate that a lipid mediator and a high-avidity ligand of this receptor, encountered by macrophages in the alveolar milieu, enhance macrophage survival and activity. Ablation of TREM2 or blocking this receptor with soluble receptors or specific antibodies effectively alleviates lung fibrosis in male mice. These findings identify this receptor as a critical regulator of macrophage-mediated fibrosis and a promising therapeutic target for intervention.


Conflict of interest statement

Competing interests: The authors declare no competing interests.

Figures

Fig. 1
Fig. 1. Mo-AMs demonstrate markedly higher expression of TREM2 than TR-AMs in the lungs of mice with bleomycin (BLM)-induced pulmonary fibrosis.
A UMAP with TREM2 expression shown was re-produced from scRNA-seq dataset (lungendothelialcellatlas) on normal mouse lung. B Boxplots representing the average normalized TREM2 expression for each subject, grouped by cell type, was re-produced from dataset lungendothelialcellatlas. 25th and 75th percentiles (horizontal box edges), median (center line), minimum and maximum values (outer whiskers); each dot represents one subject; whiskers are 1.5x IQR. n = 29 mouse lungs. C 8 week male C57BL/6 mice were intratracheally (i.t.) instilled with saline or BLM (1.5 U/kg in 50 µl saline). Three weeks after treatment, lung sections were prepared and immunofluorescence staining was performed to determine the expression of TREM2 and F4/80. Scale bar: 100 µm. The experiment was repeated three times independently with similar results. D Mice were treated as in “C”. Bronchoalveolar lavages (BALs) were harvested and BAL cells stained with a cocktail of antibodies as detailed in Methods. TREM2 levels on F4/80 + / Siglec Fhigh/ CD11blow TR-AMs and F4/80 + / Siglec Flow/CD11bhigh Mo-AMs were determined by flow cytometric analysis. n = 3, 4, and 4 mice, respectively; mean ± SD; one-way ANOVA with Bonferroni’s multiple comparisons test. MFI, mean fluorescence intensity. E Mice were i.t. instilled with BLM as in “C”. 6 days after treatment, BAL cells were harvested and stained with a cocktail of antibodies as detailed in Methods. Cell surface TREM2 levels on MERTK + /CD11blow TR-AMs, MERTK + /CD11high Mo-AMs, MERTK-/CD11b + /Ly-6G+ neutrophils and other BAL cells were determined by flow cytometric analysis. The experiments for “D, E” were repeated twice with similar results. Source data are provided as a Source Data file.
Fig. 2
Fig. 2. IPF AMs demonstrate considerably greater TREM2 expression than those from normal control lungs.
A UMAP with TREM2 expression shown was re-produced from scRNA-seq dataset (GSE164829) on normal human lung. B Immunofluorescence staining was performed on human normal control and idiopathic pulmonary fibrosis (IPF) lung sections to determine the expression and localization of TREM2 and CD68. Scale bar: 100 µm. The experiment was repeated three times independently with similar results. C Boxplots representing the average normalized TREM2 expression for each subject, grouped by cell type, was re-produced from dataset GSE128033. 25th and 75th percentiles (horizontal box edges), median (center line), minimum and maximum values (outer whiskers); each dot represents one subject; whiskers are 1.5x IQR. n = 10 control (normal) lungs, n = 8 IPF lungs. CTRL, control (normal).
Fig. 3
Fig. 3. Global TREM2 knockout, as well as conditional TREM2 knockout in Mo-AMs, protects mice from BLM-induced lung fibrosis.
A Eight to ten week TREM2 wild-type (+/+) and TREM2 knockout (-/-) mice were i.t. instilled with saline or BLM (1.5 U/kg in 50 µl saline). Three weeks later, lung hydroxyproline levels were determined. n = 3, 3, 8, and 6 mice, respectively; mean ± SEM; *p < 0.05, one-way ANOVA with Turkey’s multiple comparisons test. B Total lung RNAs from the BLM treated mice in “A” were isolated and the expression of the indicated genes was determined by real-time PCR. mean ± SEM; unpaired two-tailed Student’s t-test. C Mo-AMs from the BLM treated mice in “A” were isolated by flow sorting and levels of TREM2 in the cells determined by real-time PCR. mean ± SEM; unpaired two-tailed Student’s t-test. D, E Eight to ten week Mo-AM TREM2 (+/+) and Mo-AM TREM2 (-/-) mice were intraperitoneally (i.p.) injected with tamoxifen (75 mg/kg) for 5 consecutive days. 3 days later, the mice were i.t. instilled with saline or BLM (1.5 U/kg in 50 µl saline). The mice continued to receive tamoxifen injection, twice/week. 3 weeks after BLM treatment, Mo-AMs were isolated by flow sorting from the BLM treated mice and levels of TREM2 in the cells determined by real-time PCR (D). n = 6 and 5 mice, respectively; mean ± SEM; unpaired two-tailed Student’s t-test. The lungs in the above experiment were harvested and lung hydroxyproline levels were determined (E). n = 3, 3, 5, and 5 mice, respectively; mean ± SEM; one-way ANOVA with Bonferroni’s multiple comparisons test. F Mo-AM TREM2 (+/+) and Mo-AM TREM2 (-/-) mice were treated as in “D, E”. Lung sections were prepared and histological analysis performed by Masson’s trichrome staining. Scale bar: 500 µm. The experiment was repeated three times independently with similar results obtained. G Mo-AM TREM2 (+/+) and Mo-AM TREM2 (-/-) mice were treated as in “D-F”. The severity of pulmonary fibrosis was assessed by noninvasive lung micro-CT scan. Representative axial micro-CT images of mouse lungs (gray scale or quad-prism color scale (blue to red represents low to high density)) and quantification of lung density (Hounsfield unit at the 85th percentile of the lung density) are shown. n = 3 mice per group; mean ± SEM; one-way ANOVA with Bonferroni’s multiple comparisons test. Source data are provided as a Source Data file.
Fig. 4
Fig. 4. TREM2 deficiency promotes apoptosis and diminishes pro-fibrotic gene expression in macrophages.
A TREM2 (+/+) and TREM2 (-/-) Mo-AMs were isolated by flow sorting from mice that were treated BLM for 3 weeks, and apoptosis evaluated. n = 4 mice per group; mean ± SEM; unpaired two-tailed Student’s t-test. B Numbers of Mo-AMs in the BALs. n = 6 and 5 mice, respectively; mean ± SEM; unpaired two-tailed Student’s t-test. C BMDMs were transfected with control (con) and TREM2 siRNAs and then cultured in the presence of 10 ng/ml M-CSF for 2 days. Cell apoptosis was determined 6 h after M-CSF withdrawal. n = 4 independent culture of cells per group; mean ± SD; one-way ANOVA with Bonferroni’s multiple comparisons test. The experiment was repeated three with similar results. D BMDMs were transfected with control and TREM2 siRNAs and then cultured in the presence of 10 ng/ml M-CSF for 2 days. Cells were harvested 6 h after M-CSF withdrawal and the expression of the indicated proteins were determined by Western blotting. The experiment was repeated three times with similar results. E The expression of pro-fibrotic mediators in Mo-AMs from mice treated in “A” was determined by real-time PCR. n = 4 mice per group; mean ± SEM; unpaired two-tailed Student’s t-test. F TGF-β1 levels in BALs from mice treated in “A” were determined by ELISA. n = 6 and 5 mice, respectively; mean ± SEM; unpaired two-tailed Student’s t-test. G BAL TGF-β1 levels in TREM2 (+/+) and TREM2 (-/-) mice instilled with saline or BLM for 3 weeks. n = 3, 3, 7, and 6 mice, respectively; mean ± SEM; one-way ANOVA with Bonferroni’s multiple comparisons test. H, I Bubble plots for the indicated pro-fibrotic and anti-apoptotic genes in the macrophages from BLM treated mouse lungs (H) and human IPF lungs (I) were re-produced from scRNA-seq datasets GSE132771 (n = 2 mouse lungs) and GSE128033 (n = 5 IPF lungs), respectively. Source data are provided as a Source Data file.
Fig. 5
Fig. 5. Mo-AM TREM2 inhibits ATII regeneration and differentiation into ATI.
A, B TREM2 (+/+) and TREM2 (-/-) Mo-AMs were isolated by flow sorting from mice treated with i.t. BLM for 1 week, respectively. The AMs were mixed with sorted ATIIs (5:1 ratio) in Matrigel and cultured for 12 days. ATII organoid number and size in each group were determined by ImageJ. n = 12 independent culture of cells per group; mean ± SD; unpaired two-tailed Student’s t-test. Scale bar: 2 mm. CE ATII organoids from “A” were harvested and frozen sections prepared. Immunofluorescence microscopy was performed for the indicated proteins. Scale bar: 20 µm. All experiments were repeated twice with similar results obtained. Source data are provided as a Source Data file.
Fig. 6
Fig. 6. Sphingomyelin (SM) protects macrophages from apoptosis.
AD C57BL/6 mice were i.t. instilled with BLM. At 0, 1, 2, and 4 weeks post-treatment, BALs were collected and lipidomics was performed. A PCA analysis shows segregation of BALF samples based on groups. BD The levels of various forms of sphingomyelins in the BALs. The box-and-whisker plots depict the 25th and 75th percentiles (horizontal box edges), median (center line), mean (+), minimum and maximum values (outer whiskers), and outliers (dots outside the whiskers). n = 6 mice per group; one-way ANOVA with Bonferroni’s multiple comparisons test. E BMDMs were cultured in the absence or presence of 10 ng/ml M-CSF, and treated with or without 10 µg/ml SM for 6 h. Cell apoptosis was determined. The average luminescent intensity in the control group ( + M-CSF, -SM) was regarded as “1”. The intensity of other groups to the control group was shown as fold change. n = 4 independent culture of cells per group; mean ± SD; one-way ANOVA with Bonferroni’s multiple comparisons test. F Experiments were done as in “E”. The expression of the indicated protein was determined by Western blotting. G BMDMs were treated with or without 10 µg/ml SM in the absence of M-CSF for 6 h. The expression of the indicated protein was determined by Western blotting. H BMDMs were transfected with control and TREM2 siRNAs and then cultured in the presence of 10 ng/ml M-CSF for 2 days. The cells were then treated with or without 10 µg/ml SM in the absence of M-CSF for 6 h. The expression of the indicated protein was determined by Western blotting. I TREM2 (+/+) and TREM2 (-/-) BMDMs were treated with or without 10 µg/ml SM in the absence of M-CSF for 6 h. The expression of the indicated protein was determined by Western blotting. J TREM2 (+/+) and TREM2 (-/-) BMDMs were cultured in the absence or presence of 10 ng/ml M-CSF, and treated with or without 10 µg/ml SM for 6 h. Cell apoptosis was determined. The average luminescent intensity in the control group (fl/fl +M-CSF, -SM) was regarded as “1”. The intensity of other groups to the control group was shown as fold change. n = 4 independent culture of cells; mean ± SD; one-way ANOVA with Bonferroni’s multiple comparisons test. The experiments for “EJ” were repeated three times with similar results. Source data are provided as a Source Data file.
Fig. 7
Fig. 7. sTREM2 blunts the protective activity of sphingomyelin on macrophage survival and alleviates BLM-induced lung fibrosis.
A BMDMs were treated with vehicle, 10 μg/ml SM, or 10 μg/ml SM that was pre-incubated with 2.5 µg/ml mouse sTREM2, for 6 h in the absence of M-CSF. The levels of the indicated proteins were determined by Western blotting. The experiment was repeated three times with similar results. B Plated Mo-AMs were treated with SM (5 µg/ml), pre-incubated for 1 h with vehicle or 4 μg/ml mouse sTREM2, for 2 days and apoptosis determined. n = 4 independent culture of cells per group; mean ± SD; one-way ANOVA with Bonferroni’s multiple comparisons test. The experiment was repeated twice times with similar results. C, D Eight week C57BL/6 mice were i.t. instilled with saline or BLM (1.5 U/kg). One week later, mice were administered vehicle or sTREM2 (65 μg/kg), once a day for 8 days. 3 weeks after BLM treatment, lungs and BALs were collected, and whole lung hydroxyproline (C) and BAL TREM2 protein levels (D) were determined. n = 3, 5, and 5 mice, respectively for “C”; n = 3, 5, and 4 mice, respectively for “D”; mean ± SEM; one-way ANOVA with Bonferroni’s multiple comparisons test. Source data are provided as a Source Data file.
Fig. 8
Fig. 8. TREM2 blocking antibody abolishes the protective effect of SM and attenuates lung fibrosis in BLM-treated mice.
A, B TREM2 (+/+) or (-/-) Mo-AMs were pre-treated for 1 h with control (con Ab) or TREM2 blocking antibody (TREM2 Ab) (4 μg/ml), followed by incubation with SM (5 μg/ml) for 2 days and apoptosis determined. n = 3, 4, 4 (for “A”) and n = 4 (for “B”) independent culture of cells for each group; mean ± SD; one-way ANOVA with Bonferroni’s multiple comparisons test. n.s., non-significant. Experiments were repeated twice times with similar results. CE Eight week C57BL/6 mice were i.t. instilled with saline or BLM (1.5 U/kg). One day later, mice were administered i.p. with control antibody (200 µg/mouse) or the TREM2 blocking antibody (200 µg/mouse), once every five days for a total of 4 times. Three weeks after BLM treatment, lungs were collected and whole lung hydroxyproline levels were determined (C). n = 3, 6, and 6 mice, respectively; mean ± SEM; one-way ANOVA with Bonferroni’s multiple comparisons test. Mo-AMs from the BLM treated mice were flow sorted (D). n = 6 mice per group; mean ± SEM; TGF-β1 in the BALs from the BLM treated mice was determined (E). n = 6 mice per group; mean ± SEM; unpaired two-tailed Student’s t-test. Source data are provided as a Source Data file.

References

    1. Misharin, A. V. et al. Monocyte-derived alveolar macrophages drive lung fibrosis and persist in the lung over the life span. J. Exp. Med.214, 2387–2404 (2017). - PMC - PubMed
    1. Morales-Nebreda, L., Misharin, A. V., Perlman, H. & Budinger, G. R. The heterogeneity of lung macrophages in the susceptibility to disease. Eur. Respir. Rev.24, 505–509 (2015). - PMC - PubMed
    1. Watanabe, S., Alexander, M., Misharin, A. V. & Budinger, G. R. S. The role of macrophages in the resolution of inflammation. J. Clin. Invest.129, 2619–2628 (2019). - PMC - PubMed
    1. Janssen, W. J. et al. Fas determines differential fates of resident and recruited macrophages during resolution of acute lung injury. Am. J. Respir. Crit. Care Med.184, 547–560 (2011). - PMC - PubMed
    1. Gibbings, S. L. et al. Transcriptome analysis highlights the conserved difference between embryonic and postnatal-derived alveolar macrophages. Blood126, 1357–1366 (2015). - PMC - PubMed

MeSH terms

LinkOut - more resources