. 2025 Feb 19;16(1):1764.
doi: 10.1038/s41467-025-56896-6.

Human skeletal muscle fiber heterogeneity beyond myosin heavy chains

Affiliations

Human skeletal muscle fiber heterogeneity beyond myosin heavy chains

Roger Moreno-Justicia et al. Nat Commun. .

Abstract

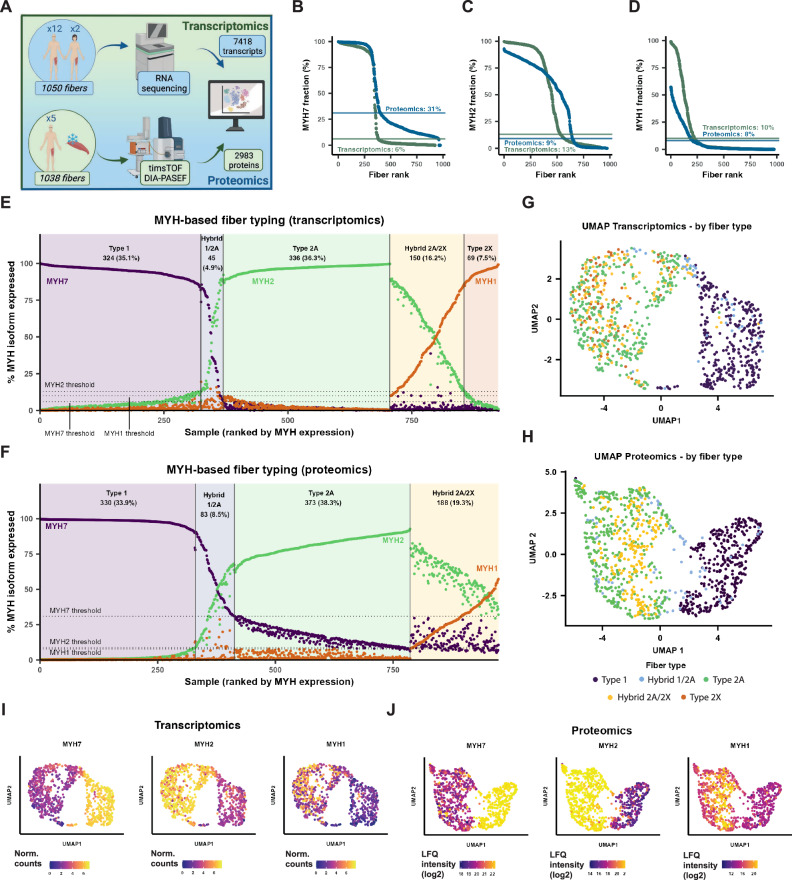
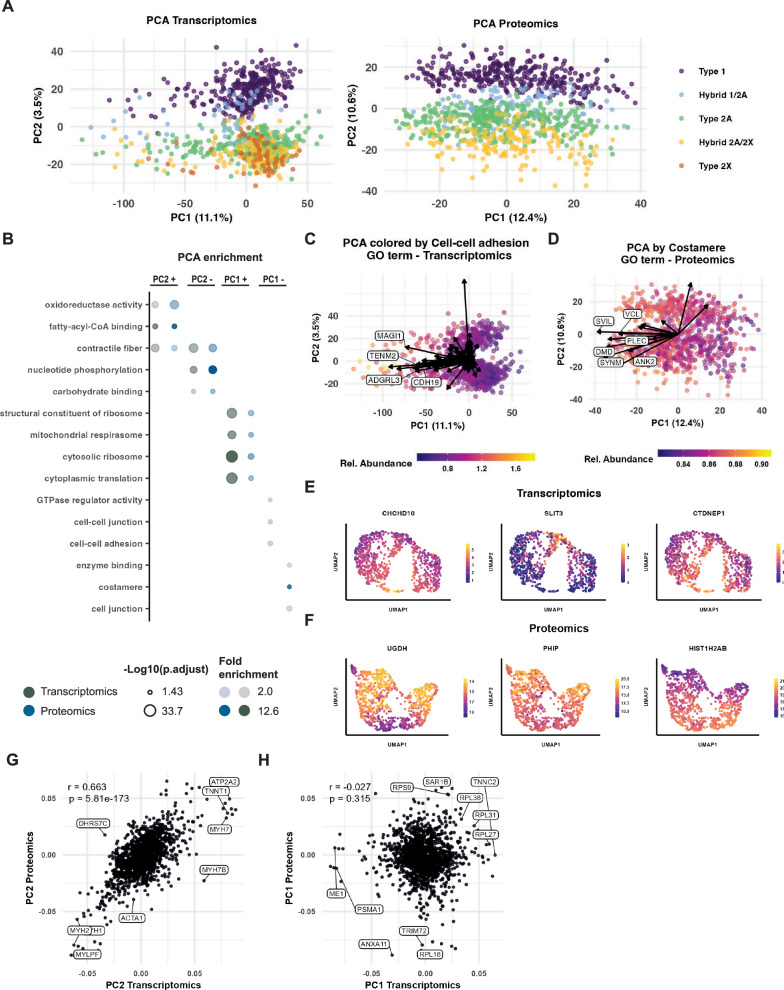
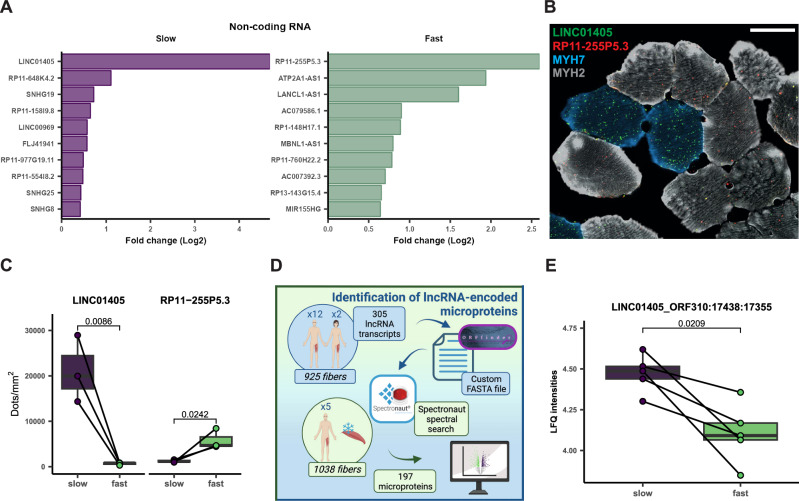
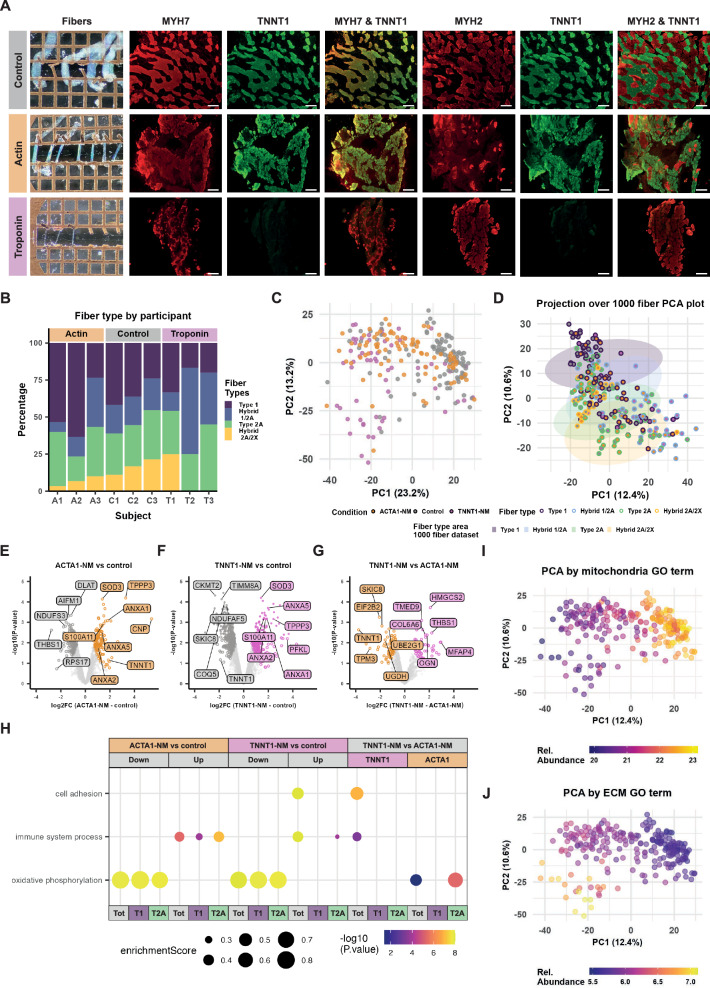
Skeletal muscle is a heterogenous tissue comprised primarily of myofibers, commonly classified into three fiber types in humans: one "slow" (type 1) and two "fast" (type 2A and type 2X). However, heterogeneity between and within traditional fiber types remains underexplored. We applied transcriptomic and proteomic workflows to 1050 and 1038 single myofibers from human vastus lateralis, respectively. Proteomics was conducted in males, while transcriptomics included ten males and two females. We identify metabolic, ribosomal, and cell junction proteins, in addition to myosin heavy chain isoforms, as sources of multi-dimensional variation between myofibers. Furthermore, whilst slow and fast fiber clusters are identified, our data suggests that type 2X fibers are not phenotypically distinct to other fast fibers. Moreover, myosin heavy chain-based classifications do not adequately describe the phenotype of myofibers in nemaline myopathy. Overall, our data indicates that myofiber heterogeneity is multi-dimensional with sources of variation beyond myosin heavy chain isoforms.


Conflict of interest statement

Competing interests: The authors declare no competing interests.

Figures

Fig. 1
Fig. 1. Transcriptomic- and proteomic-based clustering reveals only two distinct fiber types.
A Transcriptomic and proteomic workflow (created using BioRender.com). BD Dynamic range curves for MYH7, MYH2, and MYH1, with calculated assignment thresholds for fiber typing. E, F Distribution of fibers by expression of MYHs in transcriptomics and proteomics datasets. G, H Uniform manifold approximation and projection (UMAP) plots for transcriptomics and proteomics, colored by MYH-based fiber type. I, J Feature plots displaying the expression of MYH7, MYH2, and MYH1 in transcriptomics and proteomics.
Fig. 2
Fig. 2. Skeletal muscle fiber heterogeneity beyond MYHs.
A Principal component analysis (PCA) plots of transcriptomics and proteomics datasets colored by MYH-based fiber type. B Enrichment analysis of transcript and protein drivers of PC2 and PC1. Statistical analysis was performed using the clusterProfiler package with Benjamini-Hochberg adjusted p-values. C, D PCA plot colored by cell-cell adhesion gene ontology (GO) term in the transcriptome, and by costamere GO term in the proteome. Arrows represent transcript and protein drivers and their direction. E, F Uniform manifold approximation and projection (UMAP) feature plots of clinically relevant features displaying a slow/fast fiber type-independent gradient of expression. G, H Correlation between drivers of PC2 and PC1 between the transcriptome and proteome.
Fig. 3
Fig. 3. Ribosomal heterogeneity drives fiber type-independent heterogeneity.
A Principal component analysis (PCA) plot colored by cytosolic ribosome gene ontology (GO) term in the proteome. Arrows indicate the direction towards which the proteins are driving the variance in the PCA plot. The length of the lines represents the principal component score for a given protein. B, C PCA feature plots of RPS13 and RPL38. D Unsupervised hierarchical clustering analysis of proteins constituting the cytosolic ribosome. E Structural model of the 80S ribosome (PDB: 4V6X) highlighting ribosomal proteins displaying variable abundance across skeletal muscle fibers. F Ribosomal proteins with variable stoichiometry located close to the mRNA exit tunnel.
Fig. 4
Fig. 4. Fast and slow skeletal muscle fiber signatures.
A, B Volcano plots comparing the slow and fast clusters identified from the uniform manifold approximation and projection (UMAP) plots in Fig. 1G–H. Colored dots represent significantly different transcripts or proteins at an FDR < 0.05, darker dots represent significantly different transcripts or proteins with a log fold change > 1. Two-sided statistical analysis was performed with the DESeq2 Wald test with Benjamini-Hochberg adjusted p-values (transcriptomics) or a Limma linear model approach with empirical Bayes methods followed by p-value adjustment for multiple comparisons using the Benjamini-Hochberg method (proteomics). C Feature plots of selected differentially expressed genes or proteins between slow and fast fibers. D Enrichment analysis of significantly different transcript and proteins. Overlap – enriched in both datasets, Transcriptome – enriched only in transcriptome, Proteome – enriched only in proteome. Statistical analysis was performed using the clusterProfiler package with Benjamini-Hochberg adjusted p-values. E Fiber type specific transcription factors as identified by SCENIC, based on SCENIC-derived regulon specificity score and differential mRNA expression between fiber types. F Feature plots of selected differentially expressed transcription factors between slow and fast fibers.
Fig. 5
Fig. 5. Non-coding RNA and associated microproteins in human skeletal muscle fibers.
A Significantly regulated non-coding RNA transcripts in slow and fast fibers. B Representative RNAscope images displaying the slow/fast fiber type specificity of LINC01405 and RP11-255P5.3, respectively. Scaling bar = 50 μm. C Quantification of RNAscope data for fiber type specific non-coding RNA expression (n = 3 biopsies from independent individuals, fast vs slow comparison within each individual). Statistical analysis was performed using a two-sided t-test. Boxplots display the median and first and third quartile, with the whiskers extending towards the largest/smallest values. D De novo microprotein identification workflow (created using BioRender.com). E The microprotein LINC01405_ORF408:17441:17358 is specific to slow skeletal muscle fibers (n = 5 biopsies from independent individuals, fast vs slow comparison within each individual). Statistical analysis was performed using a Limma linear model approach with empirical Bayes methods followed by p-value adjustment for multiple comparisons using the Benjamini-Hochberg method. Boxplots display the median and first and third quartile, with the whiskers extending towards the largest/smallest values.
Fig. 6
Fig. 6. Nemaline myopathies induce a shift towards faster, less oxidative skeletal muscle fibers.
A Microscopy images displaying fiber atrophy or hypotrophy and divergent MYH-based fiber type predominance in ACTA1- and TNNT1-nemaline myopathies (NM). Scaling bar = 100 μm. To ensure reproducibility of the staining for the ACTA1 and TNNT1 patients, all three patient biopsies per condition were stained two to three times (four sections each) before selecting the representative images. B MYH-based fiber type proportions by participant. C Principal component analysis (PCA) plot of skeletal muscle fibers from nemaline myopathy patients and controls. D Skeletal muscle fibers from nemaline myopathy patients and controls projected onto PCA plot determined from the 1000 fibers analyzed in Fig. 2. EG Volcano plots comparing the ACTA1- and TNNT1-nemaline myopathies with control participants and between ACTA1- and TNNT1-nemaline myopathies. Colored circles represent significantly different proteins at π < 0.05, darker dots represent significantly different proteins at FDR < 0.05. Statistical analysis was performed using a Limma linear model approach with empirical Bayes methods followed by p-value adjustment for multiple comparisons using the Benjamini-Hochberg method. H Enrichment analysis of significantly different proteins in the whole proteome and within type 1 and type 2A fibers. Statistical analysis was performed using the clusterProfiler package with Benjamini-Hochberg adjusted p- values. I, J Principal component analysis (PCA) plot colored by extracellular matrix and mitochondria gene ontology (GO) terms.

References

    1. Altschuler, S. J. & Wu, L. F. Cellular heterogeneity: do differences make a difference? Cell141, 559–563 (2010). - PMC - PubMed
    1. Schiaffino, S. & Reggiani, C. Fiber types in mammalian skeletal muscles. Physiol. Rev.91, 1447–1531 (2011). - PubMed
    1. Engel, W. K. The essentiality of histo- and cytochemical studies of skeletal muscle in the investigation of neuromuscular disease. 1962. Neurol.12, 778–784 (1962). - PubMed
    1. Brooke, M. H. & Kaiser, K. K. Three “myosin adenosine triphosphatase” systems: the nature of their pH lability and sulfhydryl dependence. J. Histochem Cytochem18, 670–672 (1970). - PubMed
    1. Biral, D., Betto, R., Danieli-Betto, D. & Salviati, G. Myosin heavy chain composition of single fibres from normal human muscle. Biochem J.250, 307–308 (1988). - PMC - PubMed

LinkOut - more resources