. 2025 Feb 19;15(1):6019.
doi: 10.1038/s41598-024-76394-x.

Identifying chickpea (Cicer arietinum L.) genotypes rich in ascorbic acid as a source of drought tolerance

Affiliations

Identifying chickpea (Cicer arietinum L.) genotypes rich in ascorbic acid as a source of drought tolerance

Dnyaneshwar Raut et al. Sci Rep. .

Abstract

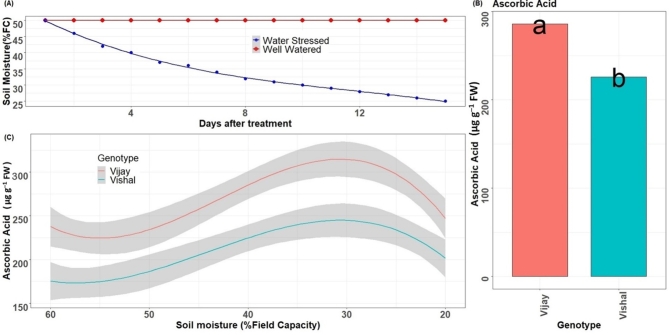
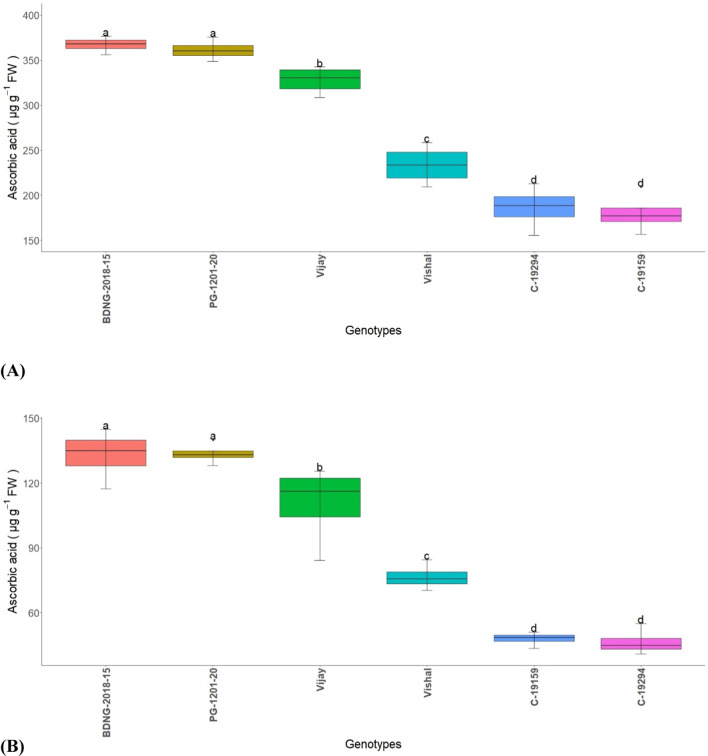
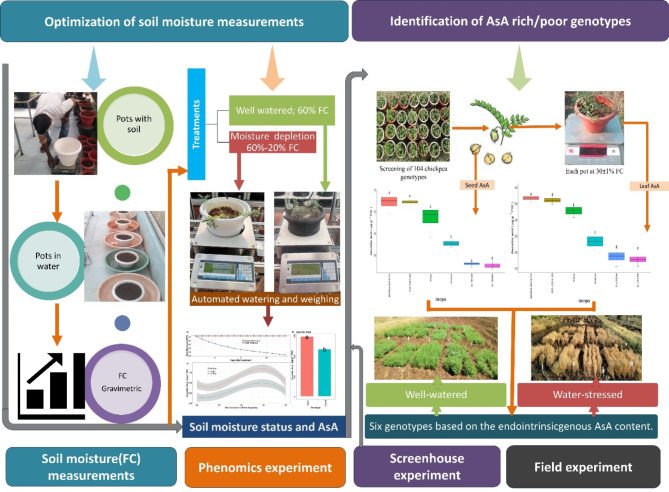
Drought stress induces a range of physiological changes in plants, including oxidative damage. Ascorbic acid (AsA), commonly known as vitamin C, is a vital non-enzymatic antioxidant capable of scavenging reactive oxygen species and modulating key physiological processes in crops under abiotic stresses like drought. Chickpea (Cicer arietinum L.), predominantly cultivated in drought-prone regions, offers an ideal model for studying drought tolerance. We explored the potential of AsA phenotyping to enhance drought tolerance in chickpea. Using an automated phenomics facility to monitor daily soil moisture levels, we developed a protocol to screen chickpea genotypes for endogenous AsA content. The results showed that AsA accumulation peaked at 30% field capacity (FC)-when measured between 11:30 am and 12:00 noon-coinciding with the maximum solar radiation (32 °C). Using this protocol, we screened 104 diverse chickpea genotypes and two control varieties for genetic variability in AsA accumulation under soil moisture depletion, identifying two groups of genotypes with differing AsA levels. Field trials over two consecutive years revealed that genotypes with higher AsA content, such as BDNG-2018-15 and PG-1201-20, exhibited enhanced drought tolerance and minimal reductions in yield compared to standard cultivars. These AsA-rich genotypes hold promise as valuable genetic resources for breeding programs aimed at improving drought tolerance in chickpea.

Keywords: Cicer arietinum L.; Endogenous ascorbic acid; Field capacity and drought tolerance; Plant phenomics.


Conflict of interest statement

Declarations. Competing interests: The authors declare no competing interests.

Figures

Fig. 1
Fig. 1
Ascorbic acid (AsA) response to soil moisture depletion. (A) Soil moisture level as indicated by % field capacity in well-watered and water-stressed plants. Each point in the plot indicates mean values for all genotypes in each treatment. (B) Maximum content in drought-tolerant and drought-sensitive checks. (C) AsA response to depleting soil moisture levels. AsA content peaked at 30 ± 1% field capacity. Solid lines indicate mean values; shaded areas indicate 95% confidence intervals.
Fig. 2
Fig. 2
Validation of ascorbic acid (AsA) content in two contrasting chickpea genotypes by comparing Experiments 1 and 2 at depleting soil moisture levels.
Fig. 3
Fig. 3
Genetic variation in ascorbic acid (AsA) content in (A) leaves and (B) seeds of six contrasting chickpea genotypes [three AsA-rich (on the left) and three AsA-poor (on the right)] screened from 104 chickpea genotypes. Box edges represent the upper and lower quartiles; horizontal lines indicate median values; upper and lower whiskers are the extreme values; letters above bars were derived from Duncan’s multiple range test at a 95% confidence interval; genotypes with common letters do not significantly differ.
Fig. 4
Fig. 4
Effect of crop season (A) year effect, (B) tissue ascorbic acid (AsA) content, and (C) soil water regime (treatment effect) on dry biomass (g plant–1) of selected AsA-rich and AsA-poor chickpea genotypes. Genotype effects on dry biomass (D) without stress (well-watered) and (E) with stress (water-stressed). Different letters above bars within a figure indicate significant differences among mean values as computed by Duncan’s multiple range test at a 95% confidence interval.
Fig. 5
Fig. 5
Effect of crop season (A) year effect, (B) tissue ascorbic acid (AsA) content, and (C) soil water regime (treatment effect) on pods plant–1 of selected AsA-rich and AsA-poor chickpea genotypes. Genotype effects on pods plant–1 (D) without stress (well-watered) and (E) with stress (water-stressed). Different letters above bars within a figure indicate significant differences among mean values as computed by Duncan’s multiple range test at a 95% confidence interval.
Fig. 6
Fig. 6
Effect of crop season (A) year effect, (B) tissue ascorbic acid (AsA) content, and (C) soil water regime (treatment effect) on grains pod–1 of selected AsA-rich and AsA-poor chickpea genotypes. Genotype effects on grains pod–1 (D) without stress (well-watered) and (E) with stress (water-stressed). Different letters above bars within a figure indicate significant differences among mean values as computed by Duncan’s multiple range test at a 95% confidence interval.
Fig. 7
Fig. 7
Effect of crop season (A) year effect, (B) tissue ascorbic acid (AsA) content, and (C) soil water regime (treatment effect) on 100-seed weight (g) of selected AsA-rich and AsA-poor chickpea genotypes. Genotype effects on 100-seed weight (D) without stress (well-watered) and (E) with stress (water-stressed). Different letters above bars within a figure indicate significant differences among mean values as computed by Duncan’s multiple range test at a 95% confidence interval.
Fig. 8
Fig. 8
Effect of crop season (A) year effect, (B) tissue ascorbic acid (AsA) content, and (C) soil water regime (treatment effect) on seed yield (g plant–1) of selected AsA-rich and AsA-poor chickpea genotypes. Genotype effects on seed yield (D) without stress (well-watered) and (E) with stress (water-stressed). Different letters above bars within a figure indicate significant differences among mean values as computed by Duncan’s multiple range test at a 95% confidence interval.
Fig. 9
Fig. 9
Principal component analysis biplot of drought tolerance indices in six chickpea genotypes under well-watered and water-stressed conditions for yield-attributing traits. Genotypes are dispersed in different ordinates based on their dissimilarity. The length and color intensity of a vector in the biplot indicate the quality of representation and the contribution of the traits, respectively, based on the principal components. The angles between the vectors derived from the middle point of biplots exhibit positive or negative interactions of studied traits.
Fig. 10
Fig. 10
Brief workflow of research methodology is summarized in the following steps: (1) Optimisation of soil moisture measurements and protocol for the endogenous ascorbic acid (AsA) estimation, (2) Genetic variation in AsA content in leaves and seeds of six contrasting chickpea genotypes screened from 104 chickpea genotypes, (3) Effect of crop season, tissue ascorbic acid content and soil water regime on yield and yield attributing traits.

References

    1. Arriagada, O., Cacciuttolo, F., Cabeza, R. A., Carrasco, B. & Schwember, A. R. A comprehensive review on chickpea (Cicer arietinum L.) breeding for abiotic stress tolerance and climate change resilience. Int. J. Mol. Sci.23, 6794. 10.3390/ijms23126794 (2022). - PMC - PubMed
    1. Toker, C. et al. Cicer turcicum: A new cicer species and its potential to improve chickpea. Front Plant Sci.Bold">12, 662891 (2021). - PMC - PubMed
    1. Korbu, L., Tafes, B., Kassa, G., Mola, T. & Fikre, A. Unlocking the genetic potential of chickpea through improved crop management practices in Ethiopia. A review. Agron. Sustain. Dev.40, 1–20. 10.1007/s13593-020-00618-3 (2020).
    1. Mart, D. Chickpea (Cicer arietinum L.): A current review. MAS J. Appl. Sci.7, 372–379 (2022).
    1. Food and Agricultural Organization of the United Nations. FAOSTAT Database. http://www.fao.org/faosta. (2024)

LinkOut - more resources