

An extensive experimental analysis for heart disease prediction using artificial intelligence techniques
- PMID: 39972004
- PMCID: PMC11839996
- DOI: 10.1038/s41598-025-90530-1
An extensive experimental analysis for heart disease prediction using artificial intelligence techniques
Abstract
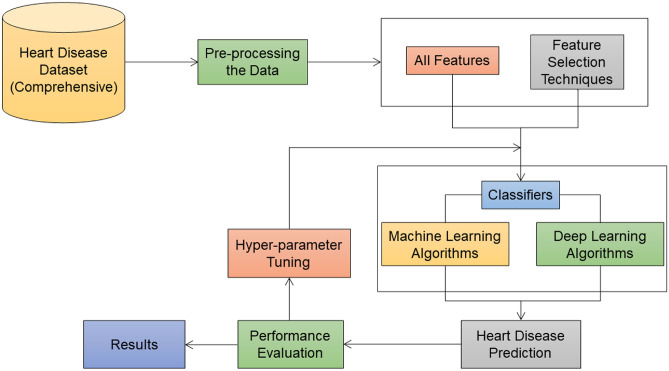
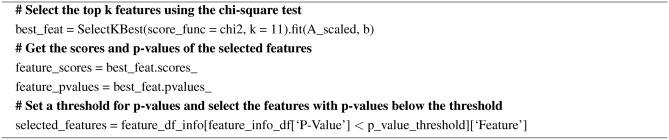
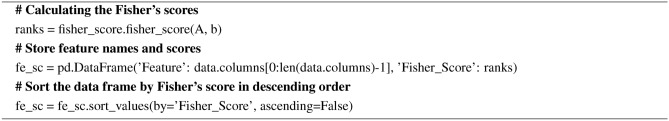
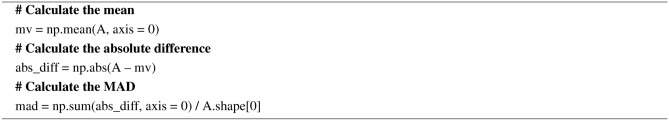
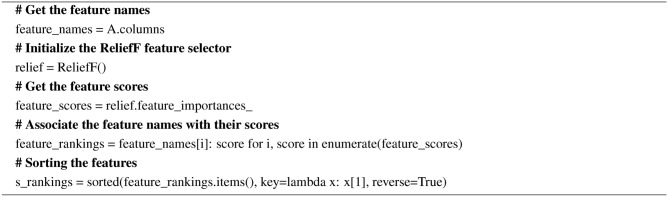
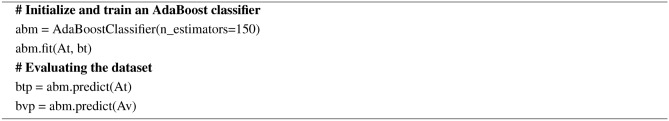
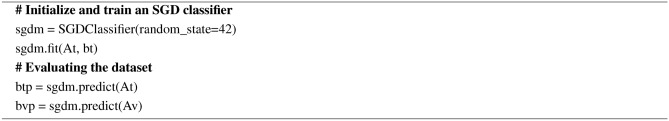
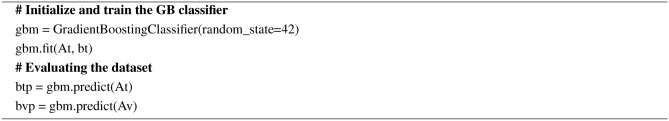
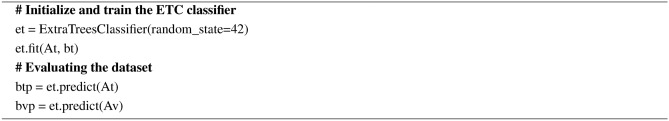
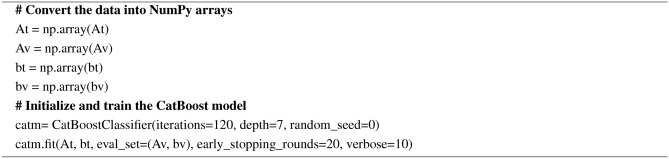
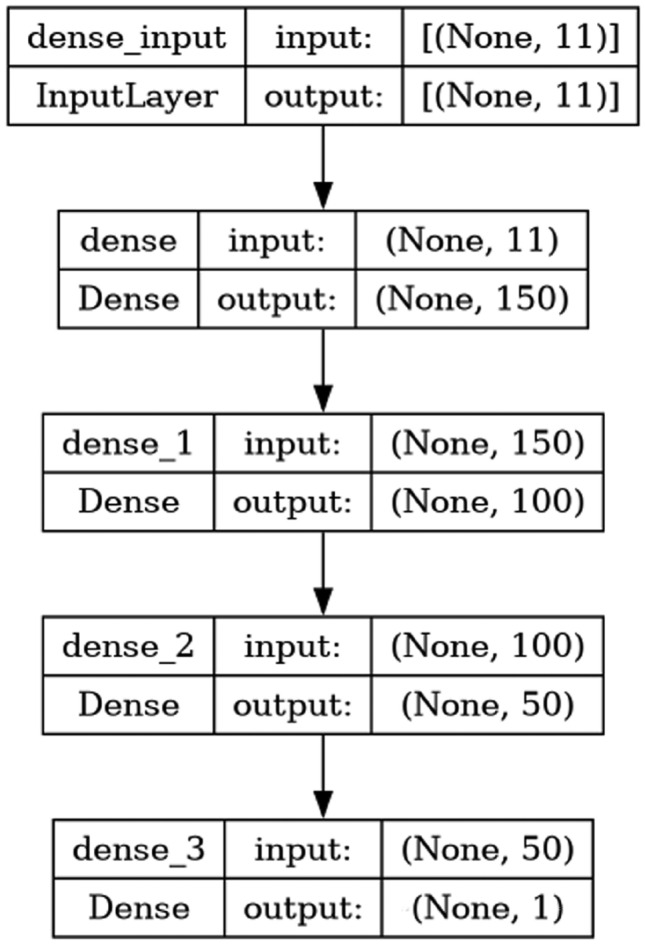
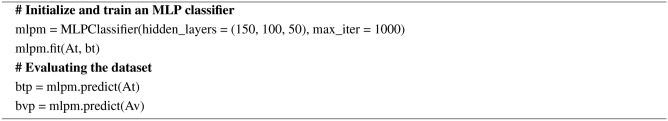
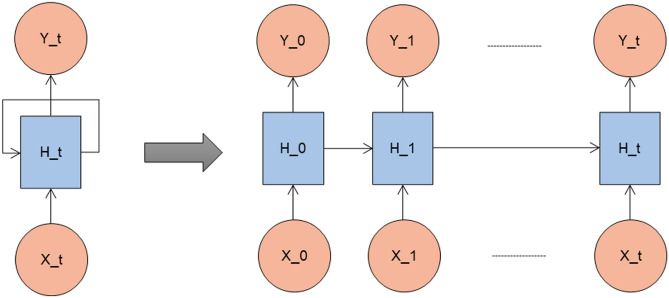
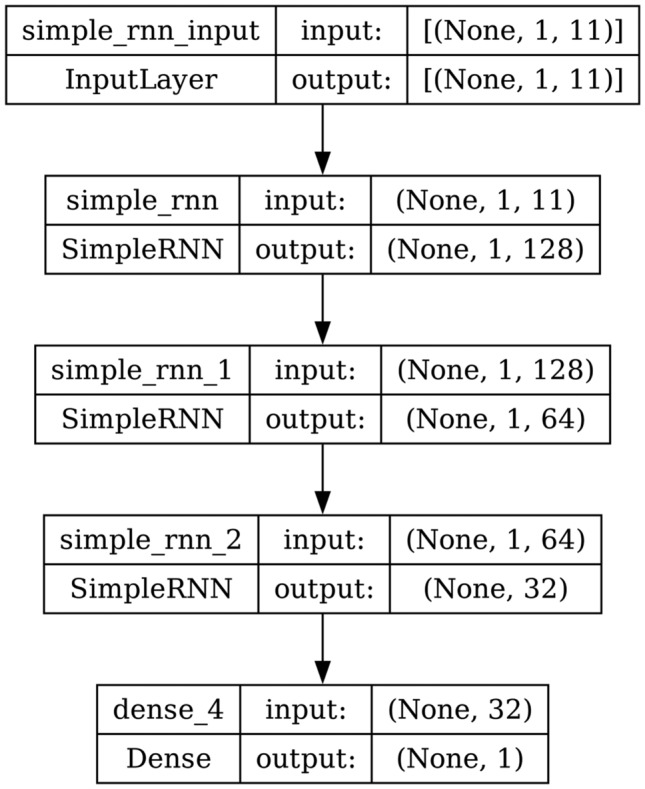
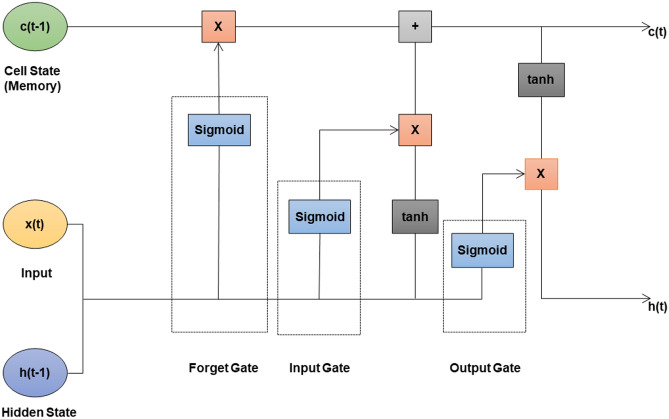
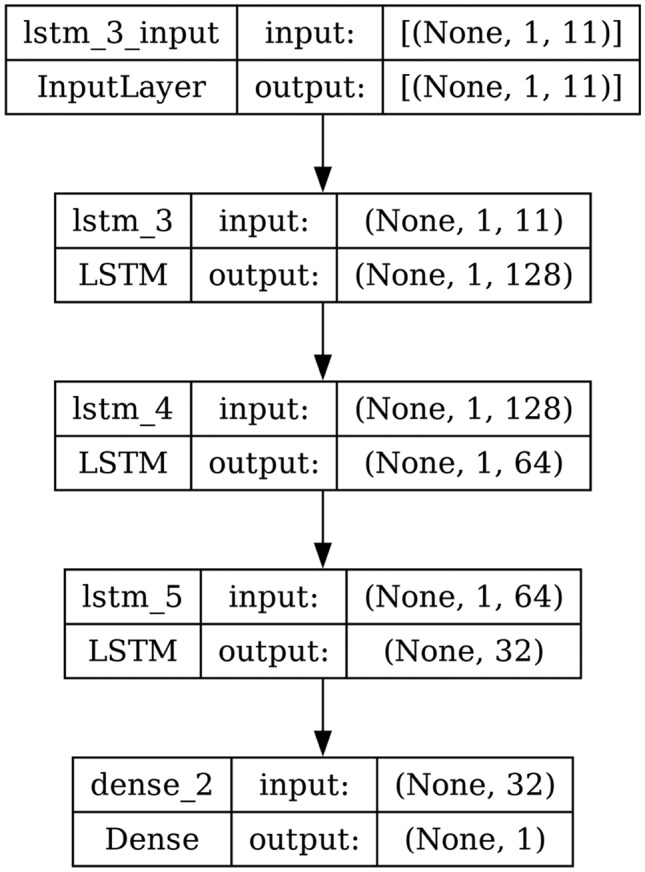
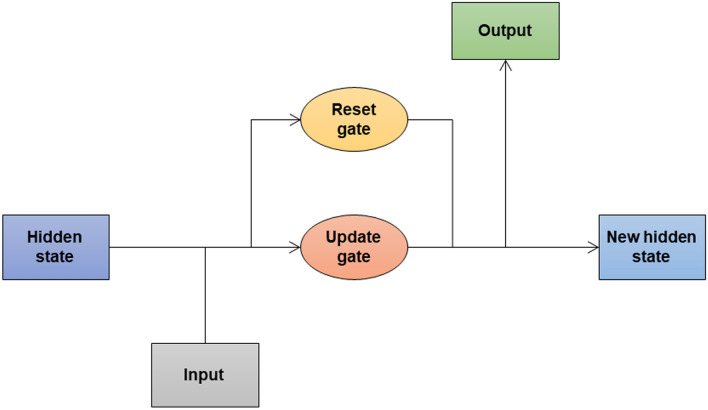
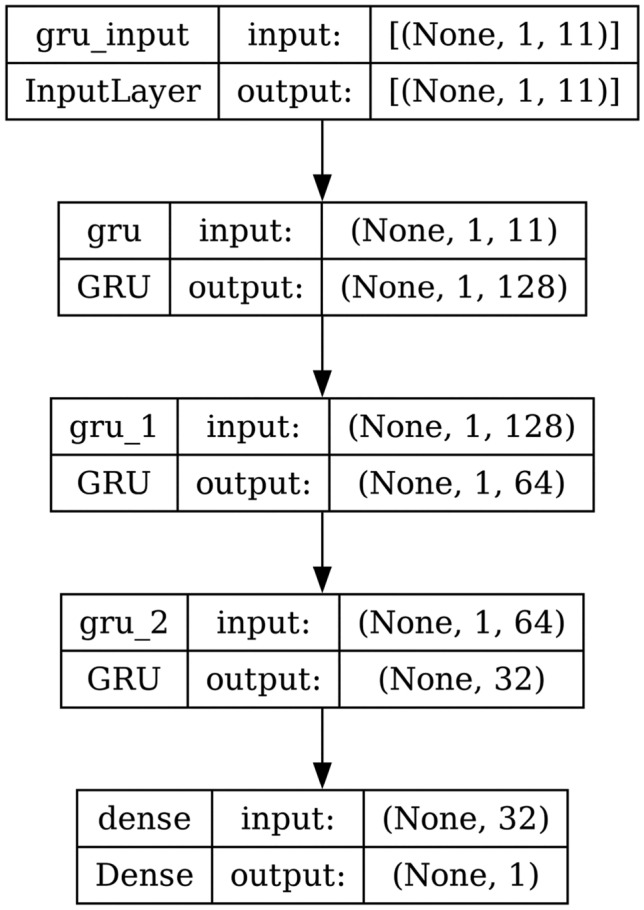
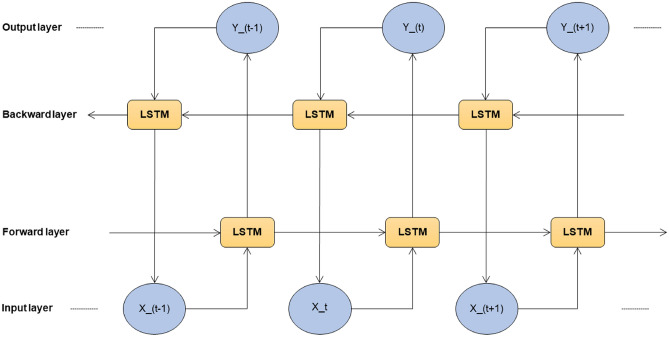
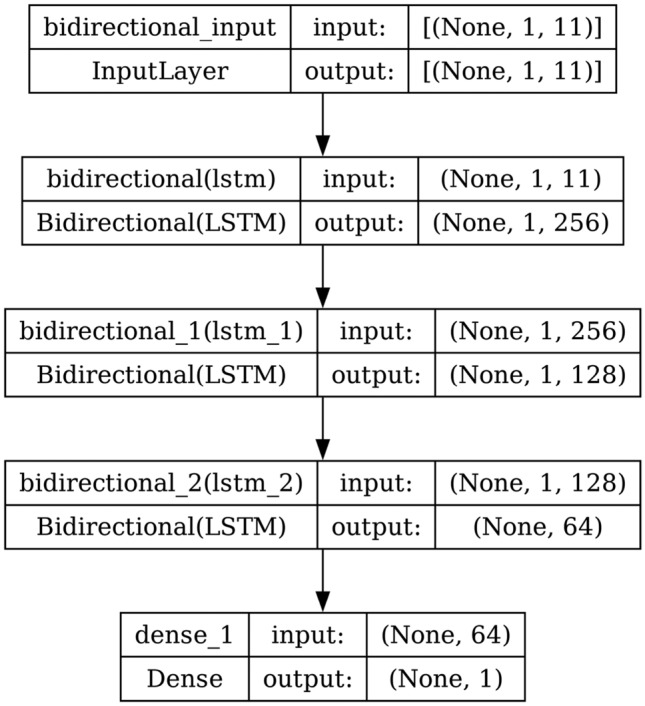
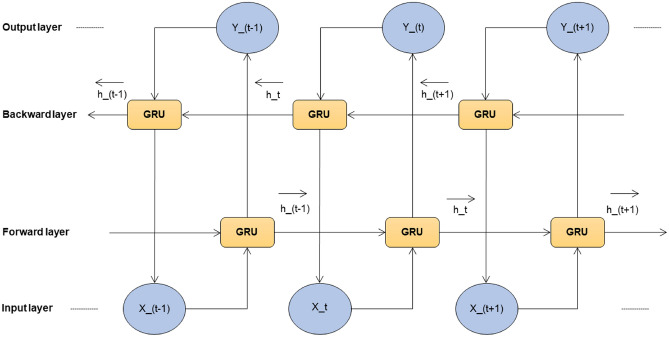
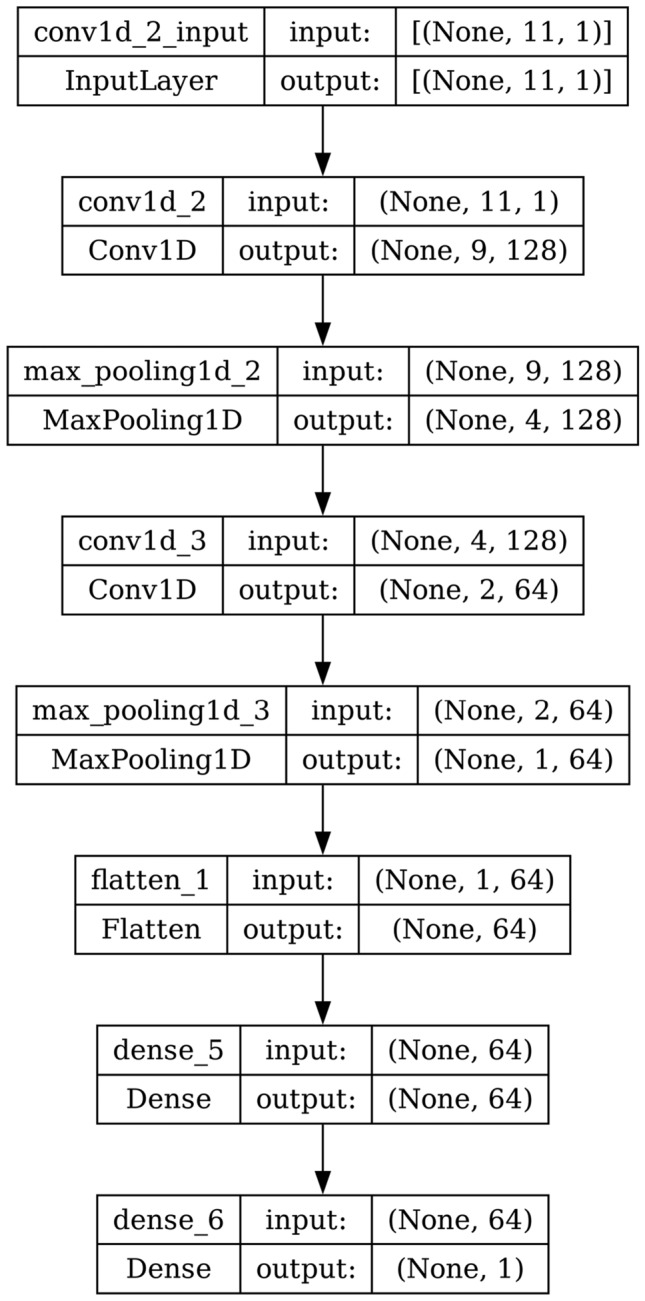
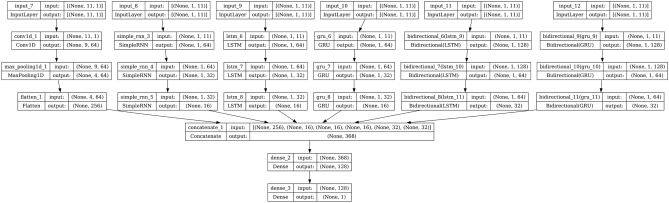
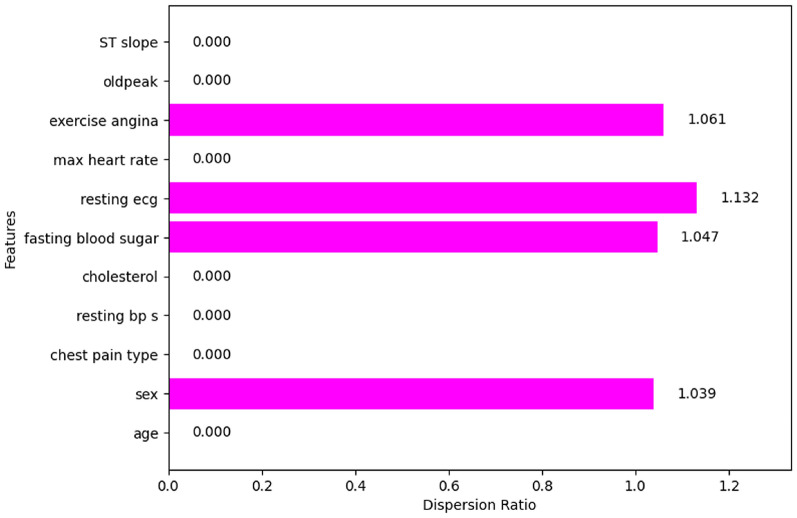
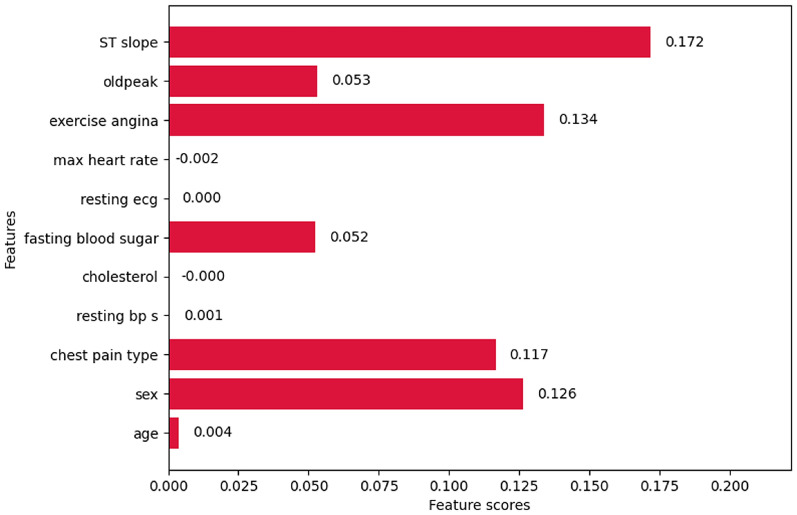
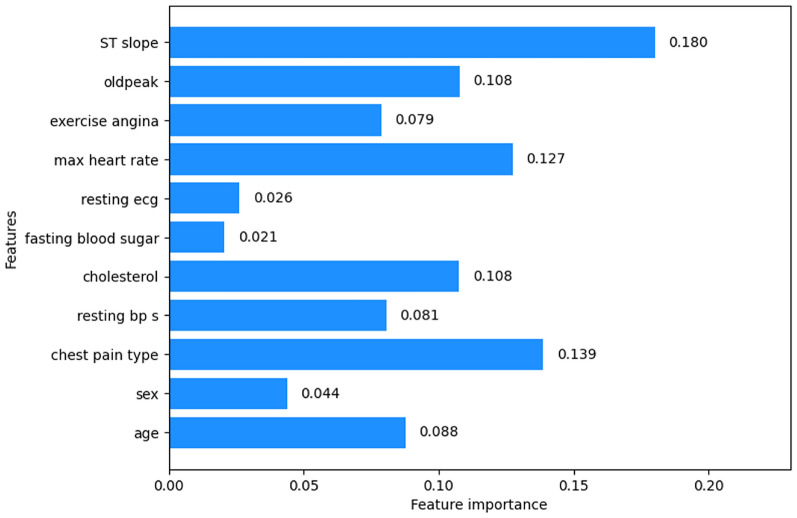
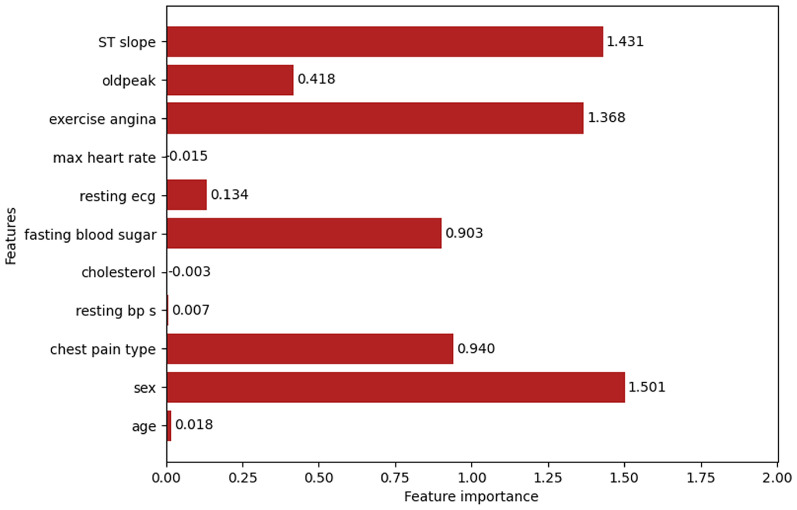
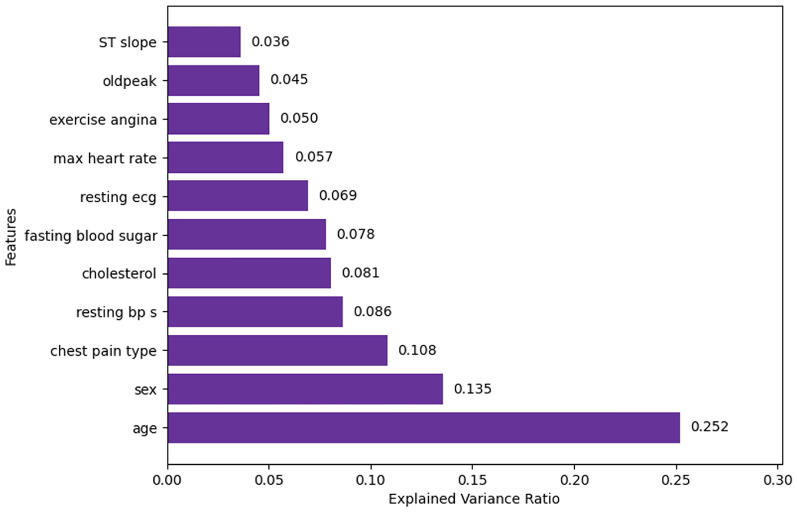
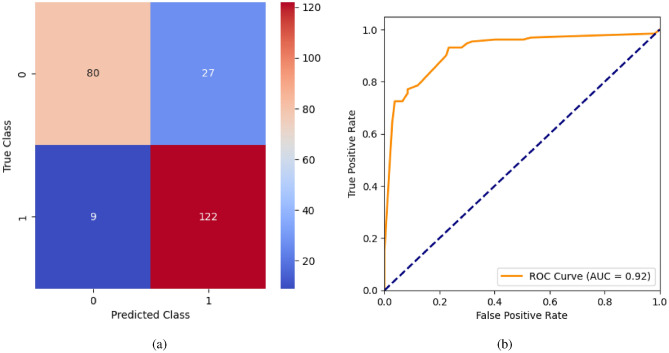
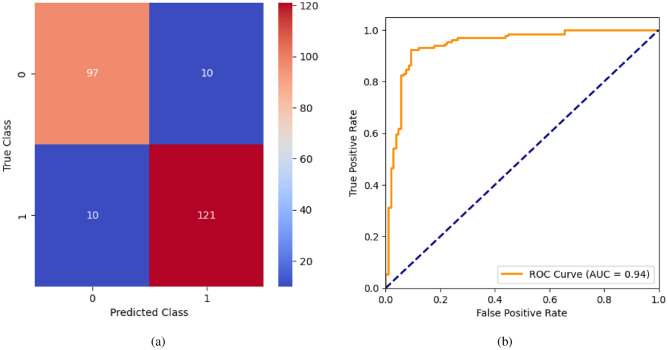
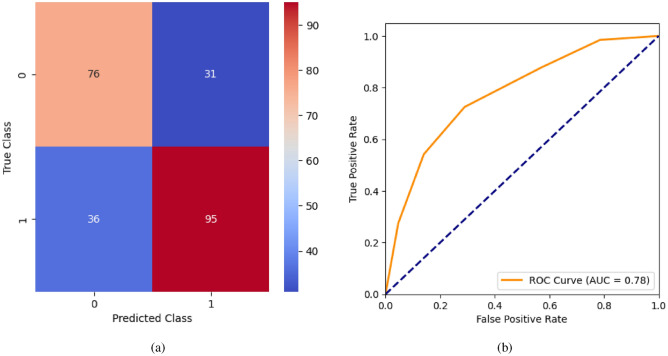
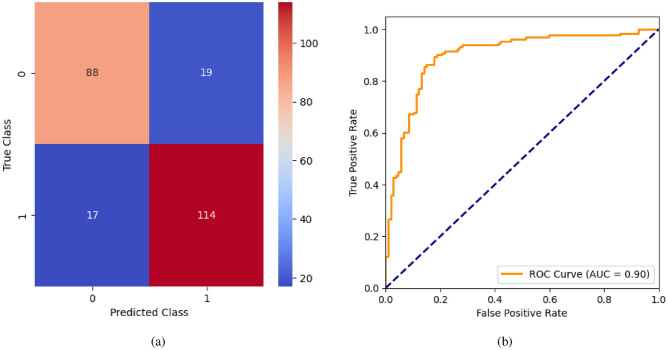
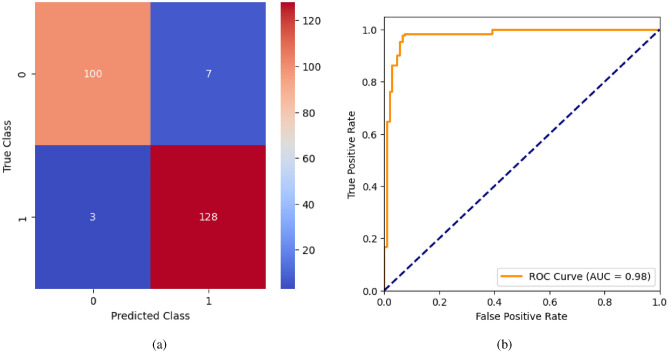
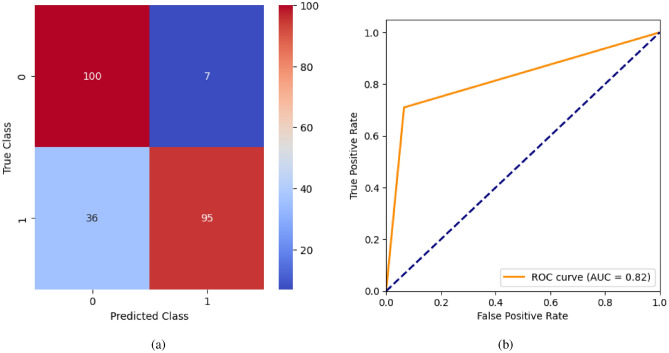
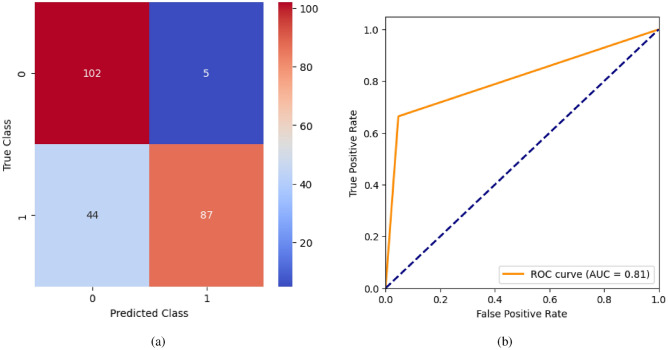
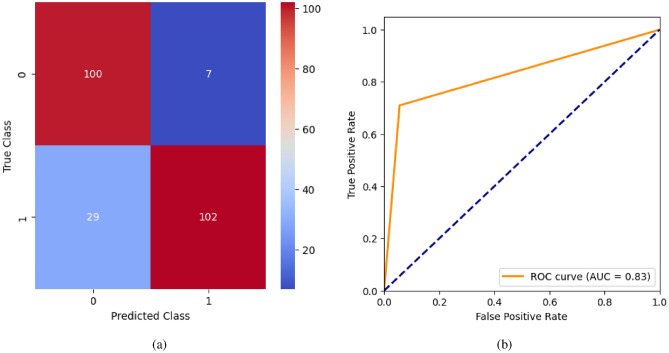
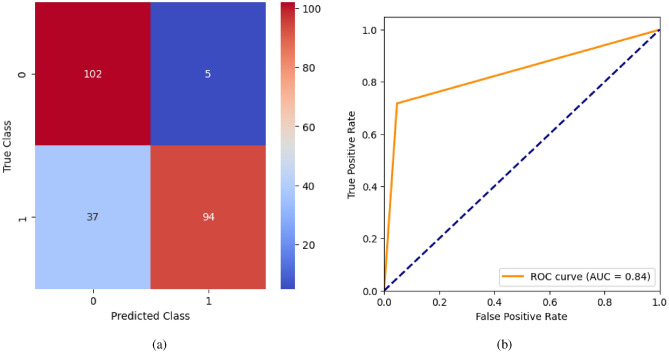
The heart is an important organ that plays a crucial role in maintaining life. Unfortunately, heart disease is one of the major causes of mortality globally. Early and accurate detection can significantly improve the situation by enabling preventive measures and personalized healthcare recommendations. Artificial intelligence is emerging as a powerful tool for healthcare applications, particularly in predicting heart diseases. Researchers are actively working on this, but challenges remain in achieving accurate heart disease prediction. Therefore, experimenting with various models to identify the most effective one for heart disease prediction is crucial. In this view, this paper addresses this need by conducting an extensive investigation of various models. The proposed research considered 11 feature selection techniques and 21 classifiers for the experiment. The feature selection techniques considered for the research are Information Gain, Chi-Square Test, Fisher Discriminant Analysis (FDA), Variance Threshold, Mean Absolute Difference (MAD), Dispersion Ratio, Relief, LASSO, Random Forest Importance, Linear Discriminant Analysis (LDA), and Principal Component Analysis (PCA). The classifiers considered for the research are Logistic Regression, Decision Tree, Random Forest, K-Nearest Neighbors (KNN), Support Vector Machine (SVM), Gaussian Naïve Bayes (GNB), XGBoost, AdaBoost, Stochastic Gradient Descent (SGD), Gradient Boosting Classifier, Extra Tree Classifier, CatBoost, LightGBM, Multilayer Perceptron (MLP), Recurrent Neural Network (RNN), Long Short-Term Memory (LSTM), Gated Recurrent Unit (GRU), Bidirectional LSTM (BiLSTM), Bidirectional GRU (BiGRU), Convolutional Neural Network (CNN), and Hybrid Model (CNN, RNN, LSTM, GRU, BiLSTM, BiGRU). Among all the extensive experiments, XGBoost outperformed all others, achieving an accuracy of 0.97, precision of 0.97, sensitivity of 0.98, specificity of 0.98, F1 score of 0.98, and AUC of 0.98.
Keywords: Artificial intelligence; Deep learning; Feature selection; Heart disease prediction; Machine learning; Performance metrics; XGBoost.
© 2025. The Author(s).
Conflict of interest statement
Declarations. Competing Interests: The authors declare no Competing interests.
Figures


Similar articles
-
Artificial intelligence in clinical care amidst COVID-19 pandemic: A systematic review.Comput Struct Biotechnol J. 2021;19:2833-2850. doi: 10.1016/j.csbj.2021.05.010. Epub 2021 May 7. Comput Struct Biotechnol J. 2021. PMID: 34025952 Free PMC article. Review.
-
Prediction and Diagnosis of Breast Cancer Using Machine and Modern Deep Learning Models.Asian Pac J Cancer Prev. 2024 Mar 1;25(3):1077-1085. doi: 10.31557/APJCP.2024.25.3.1077. Asian Pac J Cancer Prev. 2024. PMID: 38546090 Free PMC article.
-
Time series forecasting of new cases and new deaths rate for COVID-19 using deep learning methods.Results Phys. 2021 Aug;27:104495. doi: 10.1016/j.rinp.2021.104495. Epub 2021 Jun 26. Results Phys. 2021. PMID: 34221854 Free PMC article.
-
Predicting maternal risk level using machine learning models.BMC Pregnancy Childbirth. 2024 Dec 18;24(1):820. doi: 10.1186/s12884-024-07030-9. BMC Pregnancy Childbirth. 2024. PMID: 39695398 Free PMC article.
-
Algorithms for automated diagnosis of cardiovascular diseases based on ECG data: A comprehensive systematic review.Heliyon. 2023 Feb 10;9(2):e13601. doi: 10.1016/j.heliyon.2023.e13601. eCollection 2023 Feb. Heliyon. 2023. PMID: 36852052 Free PMC article. Review.
Cited by
-
Association of early enoxaparin prophylactic anticoagulation with ICU mortality in critically ill patients with chronic obstructive pulmonary disease: a machine learning-based retrospective cohort study.Front Pharmacol. 2025 May 12;16:1588846. doi: 10.3389/fphar.2025.1588846. eCollection 2025. Front Pharmacol. 2025. PMID: 40421211 Free PMC article.
References
-
- World Heart Report 2023: Confronting the World’s Number One Killer. geneva, switzerland. world heart federation. 2023. https://world-heart-federation.org/resource/world-heart-report-2023/. Accessed: 17-06-2024.
-
- Sanjeev, S., Balne, C. C. S., Reddy, T. J. & Reddy, G. Deep learning-based mixed data approach for COVID-19 detection. In 2021 IEEE 18th India Council International Conference (INDICON), 1–6, 10.1109/INDICON52576.2021.9691563 (IEEE).
-
- Reddy, G. P., Kumar, Y. V. P., & Explainable, A. I. (XAI) Explained. In,. IEEE Open Conference of Electrical. Electronic and Information Sciences (eStream)1–6, 10.1109/eStream59056.2023.10134984 (IEEE) (2023).
-
- Reddy, G. P. & Pavan Kumar, Y. V. A beginner’s guide to federated learning. In 2023 Intelligent Methods, Systems, and Applications (IMSA), 557–562, 10.1109/IMSA58542.2023.10217383 (IEEE).
-
- Ali, L. et al. An automated diagnostic system for heart disease prediction based on chi-square statistical model and optimally configured deep neural network. IEEE Access7, 34938–34945, 10.1109/ACCESS.2019.2904800.
MeSH terms
LinkOut - more resources
Full Text Sources
Medical
