. 2025 Feb 19;15(1):6057.
doi: 10.1038/s41598-025-90653-5.

A prognostic model for lung adenocarcinoma based on cuproptosis and disulfidptosis related genes revealing the key prognostic role of FURIN

Affiliations

A prognostic model for lung adenocarcinoma based on cuproptosis and disulfidptosis related genes revealing the key prognostic role of FURIN

Jianhang You et al. Sci Rep. .

Abstract

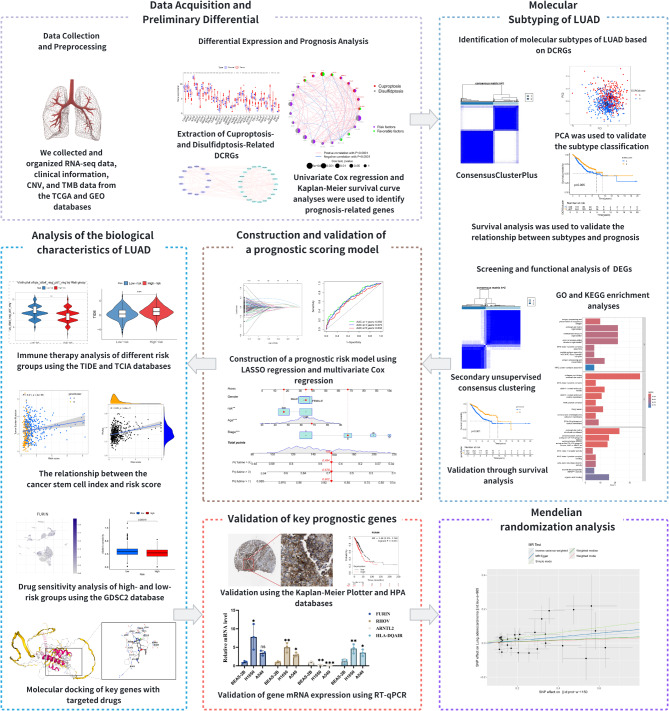
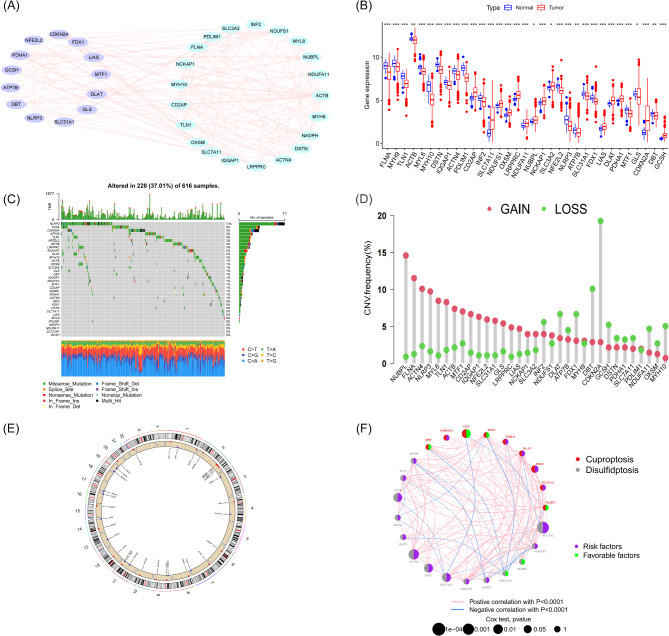
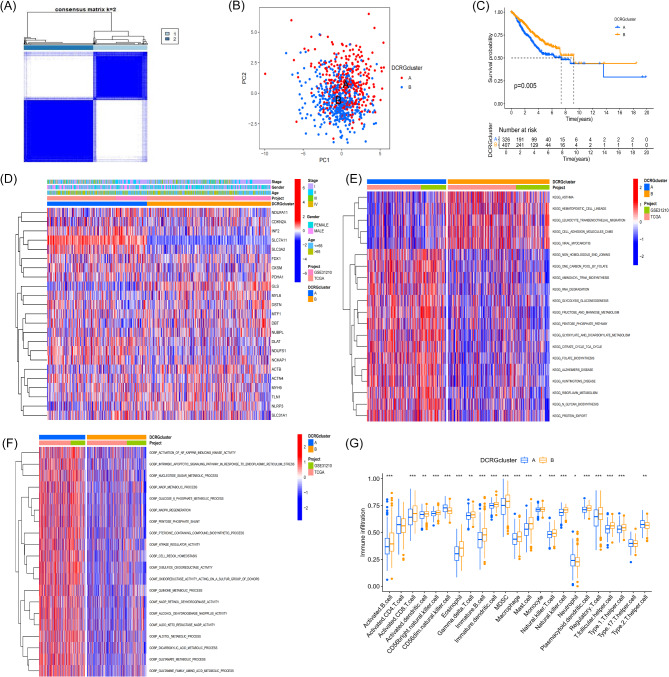
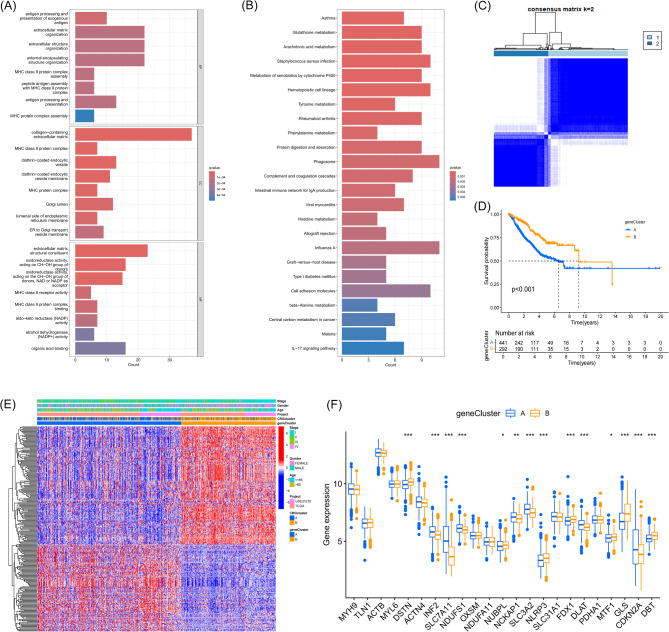
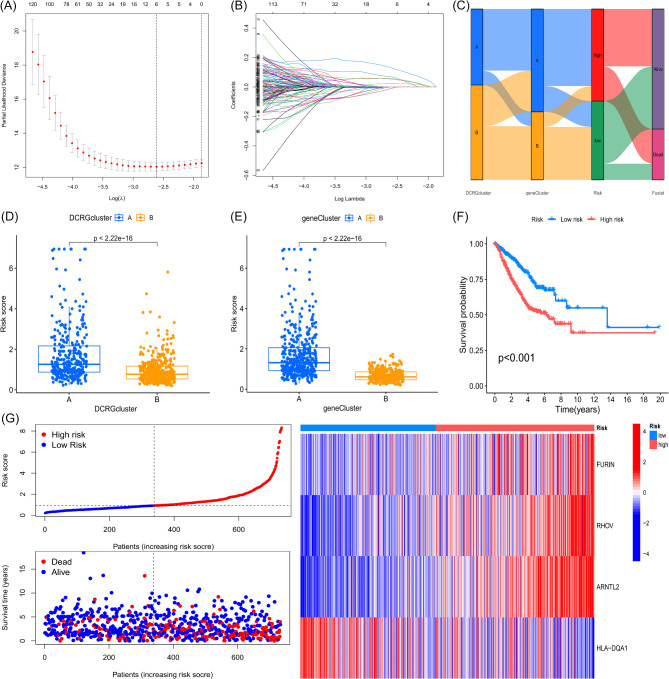
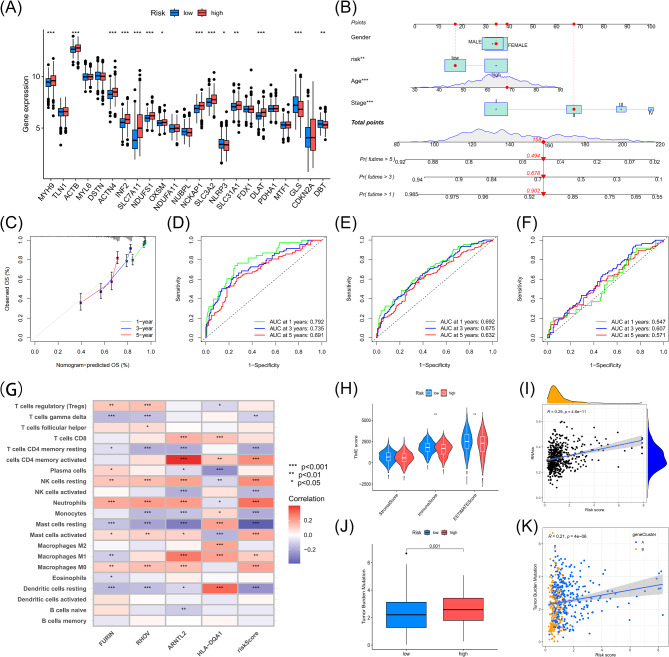
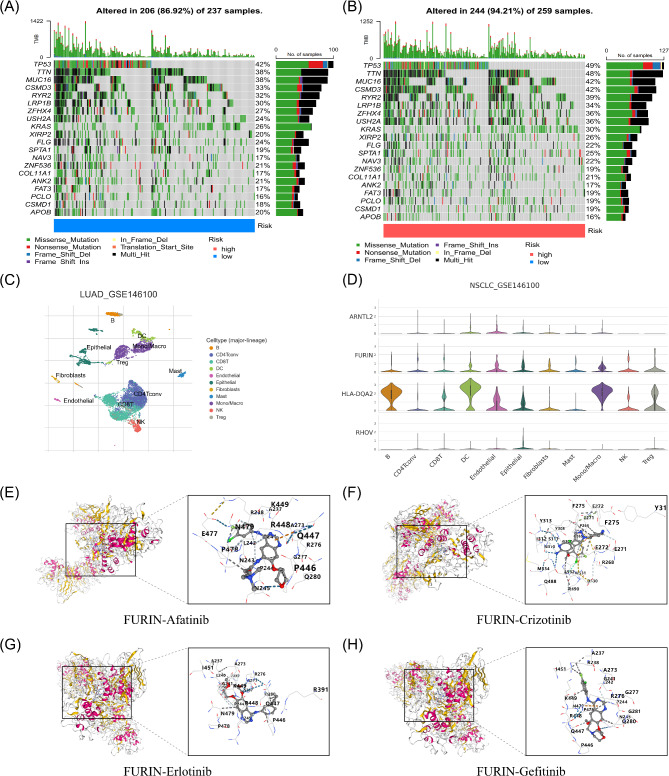
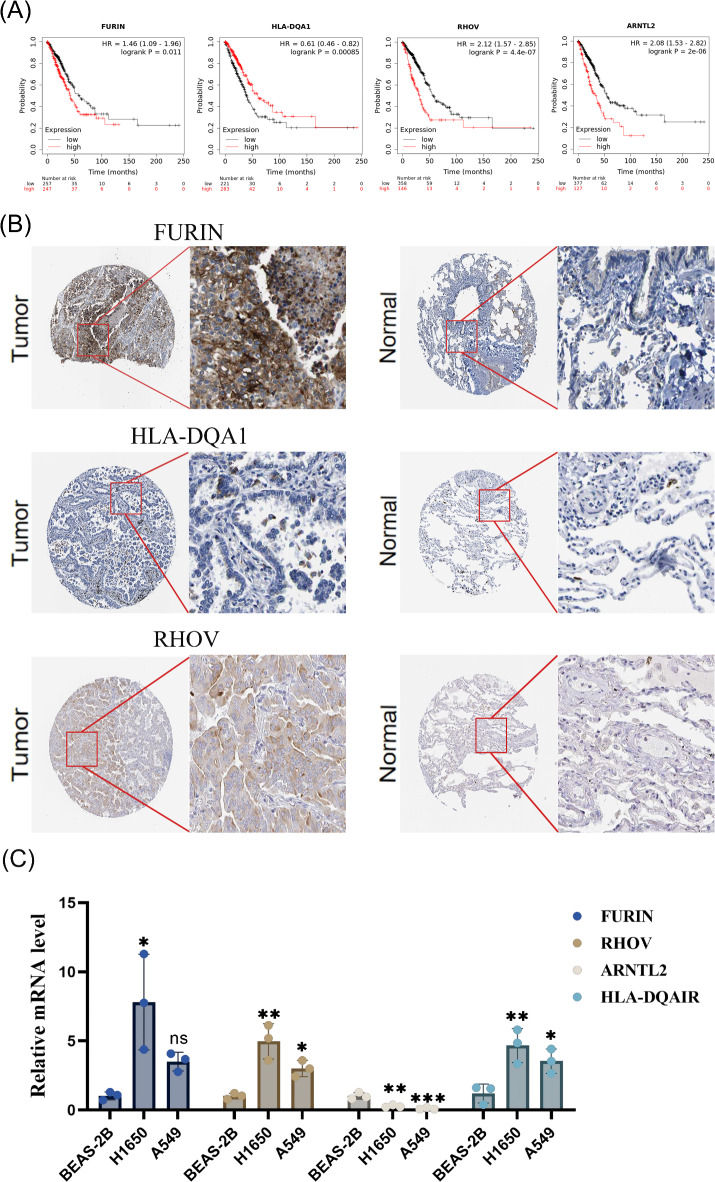
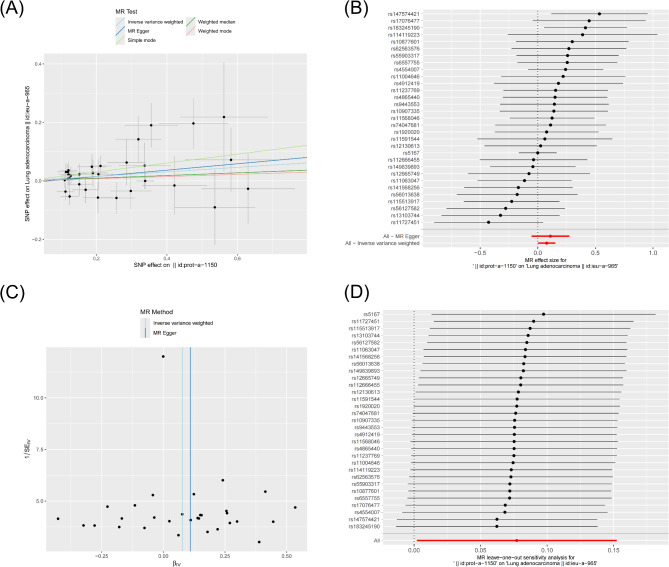
Lung adenocarcinoma (LUAD) is the most common subtype of lung cancer. Despite advances in treatment, the prognosis remains poor due to late diagnosis. Cuproptosis (driven by copper ion accumulation) and disulfidptosis (driven by disulfide bond accumulation) are novel forms of programmed cell death, closely linked to tumor initiation, progression, and resistance. However, the specific roles of these mechanisms in LUAD remain inadequately studied. This study integrated multi-omics data from TCGA and GEO databases to systematically evaluate the differential expression and prognostic significance of copper and disulfide-related genes (DCRGs), identify two DCRG molecular subtypes, and construct a DCRG scoring model based on four key genes. Multi-omics analysis results revealed that the DCRG score not only accurately predicts prognosis in LUAD patients but is also closely associated with immune cell infiltration patterns and EGFR inhibitor responses. RT-qPCR validated the high expression of FURIN and RHOV in LUAD cells, supporting their role as potential therapeutic targets. Further Mendelian randomization analysis confirmed the causal relationship between FURIN and LUAD development. These findings provide novel biomarkers for the prognosis evaluation of LUAD based on cuproptosis and disulfidptosis mechanisms and offer a theoretical basis for targeting FURIN in LUAD treatment.

Keywords: Immune Microenvironment; Lung adenocarcinoma; Machine learning; Prognostic biomarkers; Programmed cell death.


Conflict of interest statement

Declarations. Competing interests: The authors declare no competing interests. Ethics approval and consent to participate: No animals or humans were involved in this study. Consent for publication: All authors consent the publication of this work.

Figures

Fig. 1
Fig. 1
The Flow Chart Summarizes the Scheme Performed to Construct Prognostic Gene Signatures of Lung Adenocarcinoma (LUAD).
Fig. 2
Fig. 2
Overview of Genomic and Transcriptomic Analysis of DCRGs in LUAD. (A) Protein-protein interaction network of DCRGs generated based on the STRING database. (B) Boxplot comparing the expression levels of 34 DCRGs between normal individuals and LUAD patients. (C) Mutation status of 34 DCRGs in LUAD patients, including mutation types and their distribution across samples. (D) CNV frequencies of 33 DCRGs in LUAD patients, where red dots indicate gene amplifications and green dots indicate gene deletions. (E) Locations of CNV changes across the 23 chromosomes in LUAD patients. (F) Interaction network of the 23 prognostic-related DCRGs, displaying the risk and favorable genes, as well as the correlation strength and statistical significance between them.
Fig. 3
Fig. 3
Results, Validation, and Enrichment Analysis of DCRG-Related Subtypes. (A) Clustering analysis using a consensus matrix (k = 2), clearly classifying DCRGs into two distinct molecular subtypes. (B) PCA showing the spatial distribution of the two molecular subtypes (A and B) derived from DCRGs. (C) Kaplan-Meier analysis illustrating the differences in survival probability between DCRG molecular subtypes A and B in LUAD patients. (D) Heatmap displaying the differences in gene expression levels under the two DCRG molecular subtypes (A and B) and their associations with various clinical characteristics, such as disease stage, gender, age, and data source project. (E-F): Heatmaps visualizing the GSVA results between the two DCRG molecular subtypes. (G) Box plot illustrating the differences in the levels of immune cell infiltration between the two DCRG molecular subtypes (A and B).
Fig. 4
Fig. 4
Enrichment Analysis of DEGs Between DCRG Molecular Subtypes, and Biological Functions, Prognostic Impact, and Gene Expression Differences Revealed by Unsupervised Consensus Clustering. (A) GO enrichment analysis bar plot showing enrichment in biological processes, cellular components, and molecular functions. (B) KEGG enrichment analysis bar plot showing enrichment in metabolic pathways, cellular signaling, and disease-related pathways. (C) Unsupervised consensus clustering analysis divided DEGs between the two DCRG molecular subtypes into two gene subtypes. (D) Kaplan-Meier survival curves show the significant survival differences between the two gene subtypes in LUAD patients. (E) Heatmap displaying the expression levels of DEGs between the two gene subtypes and their correlation with clinical characteristics (such as age, gender, pathological stage). (F) Box plot showing the expression levels of DCRGs in the two gene subtypes (A and B).
Fig. 5
Fig. 5
Risk Scoring Model for DCRGs, Including Predicted Risk Scores, Survival Analysis, and the Relationship Between Gene Expression and Risk Levels. (A) LASSO regression coefficients. (B) Lambda path plot. (C) Sankey diagram showing the flow relationships from DCRG subtypes to intersecting DEG subtypes, risk scores, and final survival outcomes. (D) Differences in DCRG scores between the two DCRG subtypes (A and B). (E) Differences in DCRG scores between the two intersecting DEG subtypes (A and B). (F) Kaplan-Meier survival curves comparing the survival probabilities of high-risk and low-risk patient groups. (G) Scatter plot and heatmap showing the relationship between risk scores and survival time.
Fig. 6
Fig. 6
Evaluation Metrics and Multidimensional Analysis of the LUAD Prognostic Model. (A) Box plot showing the expression differences of DCRGs between the high-risk and low-risk groups in LUAD patients. (B) Prognostic model nomogram calculating prognosis based on clinical-pathological factors such as gender, risk group, age, and pathological stage. (C) Calibration curve assessing the accuracy of the nomogram’s predicted 1-year, 3-year, and 5-year OS by comparing predicted and observed survival rates. (D-F): ROC curve analysis showing the performance of the DCRG-based prediction model in assessing 1-year, 3-year, and 5-year survival predictions in the training set, all patients, and the test set for LUAD. (G) Correlation between key prognostic genes and 21 types of immune cells. (H) Violin plot showing the TME score analysis between different risk groups. (I) Relationship between DCRG score and CSC. (J) Differences in TMB between the different risk groups. (K) Scatter plot showing the correlation between DCRG scores and TMB.
Fig. 7
Fig. 7
Tumor Mutation Frequency in Different Risk Groups and Results of Key Prognostic Gene Single-Cell Analysis and Molecular Docking. (A) Waterfall plot of tumor mutation frequencies in the low-risk group. (B) Waterfall plot of tumor mutation frequencies in the high-risk group. (C) Single-cell clustering map from the LUAD_GSE146100 dataset. (D) Expression of the four key prognostic DCRGs in different cell types in LUAD. (E) Molecular docking result of FURIN with Afatinib. (F) Molecular docking result of FURIN with Crizotinib. (G) Molecular docking result of FURIN with Erlotinib. (H) Molecular docking result of FURIN with Gefitinib.
Fig. 8
Fig. 8
External Database and In Vitro Cell Line Validation. (A) Correlation between the expression levels of four key prognostic genes in LUAD and patient survival. (B) Protein expression of three key prognostic genes in tumor tissues and corresponding normal lung tissues. (C) Comparative mRNA Expression Profiles of Key DCRGs Across Distinct Cell Lines.
Fig. 9
Fig. 9
Mendelian Randomization Analysis of FURIN Protein and LUAD. (A) MR analysis results between FURIN and LUAD. (B) Forest plot showing the effect estimates of each SNP on LUAD in the MR analysis. (C) Effect estimates analysis using MR-Egger and inverse variance weighted methods. (D) Leave-one-out sensitivity analysis.

Similar articles

Cited by

References

    1. Nadia et al. The effect of advances in lung-Cancer treatment on Population Mortality. N. Engl. J. Med.383, 640–649 (2020). - PMC - PubMed
    1. Hyuna et al. Global Cancer statistics 2020: GLOBOCAN estimates of incidence and Mortality Worldwide for 36 cancers in 185 countries. Cancer J. Clin.71, 209–249 (2021). - PubMed
    1. Robert, T., Tibshirani, R., THE LASSO METHOD FOR & VARIABLE SELECTION IN THE COX MODEL. Stat. Med.16, 385–395 (1997). - PubMed
    1. Xuhui et al. Targeting cell death pathways for cancer therapy: recent developments in necroptosis, pyroptosis, ferroptosis, and cuproptosis research. J. Hematol. Oncol.15, 174 (2022). - PMC - PubMed
    1. Peter et al. Mitochondrial metabolism promotes adaptation to proteotoxic stress. Nat. Chem. Biol.15, 681–689 (2019). - PMC - PubMed