Clinical Trial
. 2025 Mar;6(3):445-459.
doi: 10.1038/s43018-025-00918-1. Epub 2025 Feb 19.

Atezolizumab following definitive chemoradiotherapy in patients with unresectable locally advanced esophageal squamous cell carcinoma - a multicenter phase 2 trial (EPOC1802)

Affiliations
Clinical Trial

Atezolizumab following definitive chemoradiotherapy in patients with unresectable locally advanced esophageal squamous cell carcinoma - a multicenter phase 2 trial (EPOC1802)

Hideaki Bando et al. Nat Cancer. 2025 Mar.

Abstract

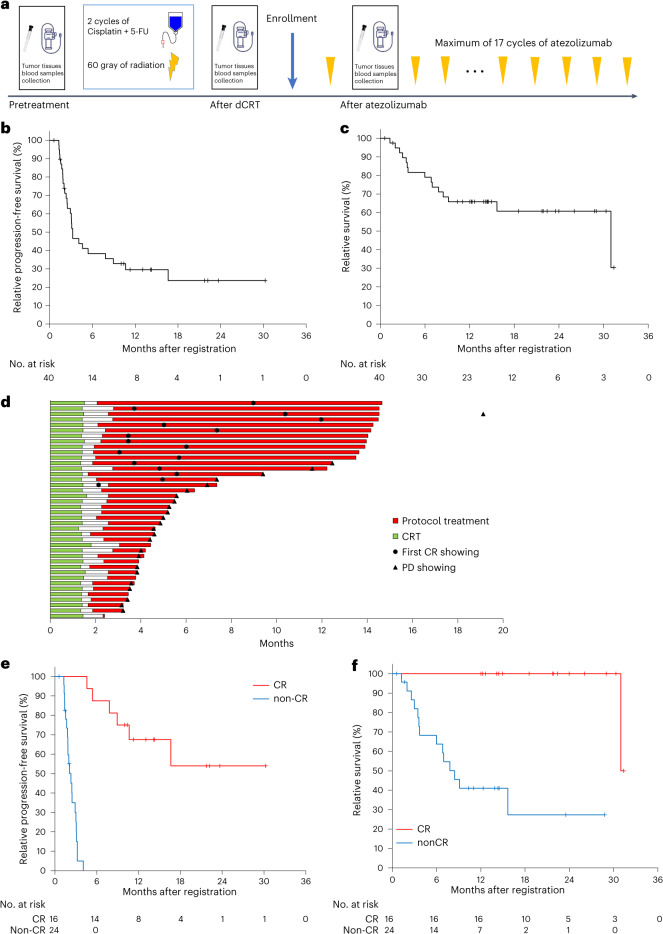
Platinum-based definitive chemoradiotherapy (dCRT) is the standard treatment for patients with unresectable locally advanced esophageal squamous cell carcinoma (ESCC) that invades the aorta, vertebral body or trachea; however, complete response rates remain low (11-25%), leading to poor survival. To evaluate the additive efficacy of the anti-PD-L1 antibody drug atezolizumab, we conducted a phase 2, multicenter, single-arm trial of 1 year of atezolizumab treatment following dCRT in 40 patients with unresectable locally advanced ESCC recruited from seven Japanese centers (UMIN000034373). The confirmed complete response (cCR) rate (primary end point) of the first consecutive 38 patients was 42.1% (90% CI 28.5-56.7%). Regarding the secondary end points, the median progression-free survival and 12-month progression-free survival rates of all 40 patients were 3.2 months and 29.6%, respectively, and the preliminary median overall survival with short-term follow-up and 12-month overall survival rate were 31.0 months and 65.8%, respectively. Other secondary end points evaluated included the cCR rate determined by an investigator's assessment in the locoregionally recurrent ESCC cohort, cCR rate determined by central assessment, overall response rate and incidence of adverse events. No treatment-related death occurred during the study. Atezolizumab monotherapy after dCRT resulted in a promising cCR rate, although long-term survival data are required.


Conflict of interest statement

Competing interests: H.B. reports research funding from Ono Pharmaceutical and honoraria from Ono Pharmaceutical, Eli Lilly Japan and Taiho Pharmaceutical. S. Kumagai received honoraria from MSD and Chugai Pharmaceutical. S.M. received honoraria from Eli Lilly, Merck Biopharma and Chugai Pharmaceutical. K.I. received honoraria from MSD and Chugai Pharmaceutical. T.T. received honoraria from Ono Pharmaceutical, Bristol Myers Squibb, MSD and Taiho Pharmaceuticals. H. Hara reported honoraria from Asahi-Kasei, Bayer, Bristol Myers Squibb, Chugai, Daiichi Sankyo, Lilly, Merck Biopharma, MSD, Ono, Taiho, Takeda and Yakult; consulting or advisory roles from Bristol Myers Squibb, Boehringer Ingelheim, Daiichi Sankyo and Ono; and research grants from ALX Oncology, Amgen, Astellas, AstraZeneca, Bayer, BeiGene, Boehringer Ingelheim, Bristol Myers Squibb, Chugai, Daiichi Sankyo, Eisai, Janssen, MSD, Ono and Taiho. S. Kadowaki reports grants from Ono Pharmaceutical, Taiho Pharmaceutical, MSD, Nobel Pharmaceutical, Janssen Pharmaceutical, Bayer, Eli Lilly, Chugai Pharmaceutical and Daiichi Sankyo, and honoraria from Ono Pharmaceutical, Taiho Pharmaceutical, MSD, Daiichi Sankyo, Merck KgaA, Bristol Myers Squibb, Eli Lilly, Chugai Pharmaceutical, Bayer and Esai. K.K. reports consulting fees from Ono Pharmaceutical, Bristol Myers Squibb, Beigene/Novartis, AstraZeneca, Roche, BAYER, Merck & Co., Merck Biopharma and Janssen; and honoraria from Ono Pharmaceutical and Bristol Myers Squibb. K.C. received grants from Bristol Myers Squibb and Ono for this study and honoraria from Bristol Myers Squibb, Chugai, Ono and Taiho outside of the submitted work. M.N. received personal fees from AstraZeneca, MSD, Varian Medical Systems and Illumina outside the submitted work. M.W. reports honoraria from Nihon Media Physics. S. Koyama reports receiving research funding from Otsuka Pharmaceutical and Chugai Pharmaceutical. H.M. received research funding from Ono Pharmaceutical, PFDeNA, Konica-Minolta, Ambry Genetics, Chugai, Guardant Health and Riken Genesis outside this study; and also serves as a board member of CureGene outside this study. H.N. received research funding and honoraria (lecture fees) from Ono Pharmaceutical, Bristol Myers Squibb, Chugai Pharmaceutical and MSD; honoraria (lecture fees) from Amgen; and research funding from Taiho Pharmaceutical, Daiichi Sankyo, Kyowa Kirin, Zenyaku Kogyo, Oncolys BioPharma, Debiopharma, Asahi-Kasei, Sysmex, Fujifilm, SRL, Astellas Pharmaceutical, Sumitomo Dainippon Pharma and BD Japan outside this study. He also serves as a board member and founder of Sustainable Cell Therapeutics and Cellian-Biclo outside this study. K.S. reports receiving personal fees for advisory roles from Lilly, Bristol Myers Squibb, Takeda, Pfizer, Ono Pharmaceutical, Merck Pharmaceutical, Taiho Pharmaceutical, Astellas, Novartis, AbbVie, GSK, Daiichi Sankyo, Amgen, Boehringer Ingelheim, Guardant Health Japan and Janssen; receiving honoraria (lecture fees) from Takeda, Bristol Myers Squibb and Janssen; and receiving research funding from Astellas, Ono Pharmaceutical, Daiichi Sankyo, Taiho Pharmaceutical, Chugai, Merck Pharmaceutical, Medi Science, Eisai and Amgen, outside the submitted work. T.Y. reports research funding from Taiho, Ono, Chugai, Amgen, MSD, Daiichi Sankyo, Eisai, FALCO Biosystems, Genomedia, Molecular Health, Nippon Boehringer Ingelheim, Pfizer, Roche Diagnostics, Sysmex and Sanofi and honoraria from Bayer, Chugai, Merck Biopharma, MSD, Ono and Takeda. T.K. reports honoraria from Ono Pharmaceutical, Covidien Japan, MSD, Boehringer Ingelheim, Kyowa Kirin, EA Pharma, Bristol Myers Squibb, 3H Clinical Trial, AstraZeneca, Taiho Pharmaceutical, LiangYiHui Healthcare, Oncology News China, Japanese Society of Pharmaceutical Health Care and Sciences, Oncolys BioPharma and BMS; and research grants from Beigene Ltd., AstraZeneca, Chugai Pharmaceutical, Parexel International, Shionogi, Taiho Pharmaceutical, Astellas Amgen BioPharma, MSD and Ono Pharmaceutical. The other authors declare no competing interests.

Figures

Fig. 1
Fig. 1. Study design and patient survival.
a, In this phase II study, patients with unresectable locally advanced ESCC treated with two cycles of cisplatin/5-FU plus 60 Gy of radiation were enrolled. The study treatment was 12 months of atezolizumab monotherapy every 3 weeks. For the biomarker study, serial biopsies from the primary site and blood collection were performed at three time points (before treatment, after definitive chemoradiotherapy and 4 weeks after the first atezolizumab dose). b,c, Kaplan–Meier plots of PFS (n = 40 patients) and OS (n = 40 patients) in the primary cohort for primary unresectable locally advanced ESCC are shown. Vertical lines denote patients who were censored. d, Swimmer plots of dCRT, the treatment protocol, first CR and PD in the primary cohort (n = 40 patients) are shown. e,f, Kaplan–Meier plots of PFS (cCR group, n = 16 patients, non-cCR group, n = 24 patients) and OS (cCR group, n= 16 patients; non-cCR group, n= 24 patients) in patients with cCR (red) and without cCR (blue) in the primary cohort are shown. Vertical lines denote patients who were censored. Source data
Fig. 2
Fig. 2. Combination therapy with dCRT and atezolizumab strengthens antitumor immune responses.
a,b, RNA extracted from ESCCs during treatment (pretreatment (n = 28 patients) after dCRT (n = 25 patients) and after atezolizumab treatment (n = 25 patients)) was subjected to RNA-seq. Gene expression in ESCCs after dCRT was compared to that in ESCCs before treatment by performing GSEA with GOBP gene sets (a). The top 20 significantly enriched gene sets among GOBP gene sets are shown. ssGSEA scores from the indicated gene sets were calculated from gene expression in ESCCs during treatment (b). Summaries of ssGSEA scores from the indicated gene sets are shown. Gray, pretreatment; red, after dCRT; blue, after atezolizumab (anti-PD-L1 mAb). ce, TILs extracted from ESCCs during treatment (pretreatment (n = 18 patients), after dCRT (n = 18 patients) and after atezolizumab treatment (n = 18 patients)) were subjected to FCM. Summary of the ratio of intratumor CCR7CD45RA (effector memory (EM)) CD8+CD3+CD45+ T cells to FOXP3highCD45RA-CD4+CD3+CD45+ T cells (eTreg cells) during treatment (pretreatment, after dCRT and after atezolizumab treatment) is shown (c). Gray, pretreatment; red, after dCRT; blue, after atezolizumab (anti-PD-L1 mAb). Representative histograms (left) and summary (right) of CD80 (d) and CD86 (e) expression in HLA-DR+CD11c+CD45+ cells (APCs) during treatment courses (pretreatment, after dCRT and after atezolizumab treatment) are shown. Gray, pretreatment; red, after dCRT; blue, after atezolizumab (anti-PD-L1 mAb); light gray, unstained control. P values were calculated by permutation testing in GSEA (a). P values were calculated by one-way analysis of variance (ANOVA) (be). For multiple comparisons, Holm‒Sidak’s test was performed. The differences with P ≤ 0.05 were considered significant. Significant differences were found in general lymphocytes (P = 0.002), lineage cytotoxic T (P = 0.08), IFNG28 gene (P = 0.008), cell cycle G1S (P = 0.0000007), cell cycle G2M (P = 0.000003), EM CD8+ T/2Treg cells (P = 0.007), CD80+HLA-DR+CD11c+ (P = 0.03) and CD86+HLA-DR+CD11c+ (P = 0.04) cells. mAb, monoclonal antibody. Source data
Fig. 3
Fig. 3. Comprehensive analysis of ESCCs before treatment.
a,b, DNA extracted from 27 pretreatment ESCC cases was subjected to WES. Representative driver gene alterations (filled sections) and the TMB (columns) are shown (a). Green, missense variants; purple, splicing variants; orange, frameshift; red, truncating mutations; yellow, in-frame mutations; pink, amplification; blue, loss. The TMB of ESCCs before treatment was compared between patients who achieved cCR (n = 10) and those who did not (n = 17) (b). c,d, RNA extracted from 27 pretreatment ESCCs was subjected to RNA-seq. Gene expression in non-cCR ESCC cases before treatment was compared to that in cCR ESCCs by performing GSEA with HALLMARK gene sets (c). Top and bottom show the results achieved by analyzing the expression of epithelial–mesenchymal transition-related genes and TGF-β signaling-related genes, respectively. Volcano plots analyzing enriched differential genes between non-cCR ESCC and cCR esophageal cancer samples (d). In brief, treatment are shown. Red shows patients who achieved cCR (cCR cases); blue shows patients who did not achieve cCR (non-cCR cases). e, Expressions of MMP1 (left) and MMP13 (right) in the ESCCs of cCR cases (red) and non-cCR cases (black) pretreatment (cCR, n = 11 patients; non-cCR, n = 17 patients) were evaluated. Summaries of the TPM values of MMP1 (left) and MMP13 (right) in the ESCCs of cCR cases (red) and non-cCR cases (black) are shown. Bars indicate mean. P values were calculated by unpaired two-tailed t-test, revealing significant differences in MMP1 (P = 0.0458) and MMP13 (P = 0.0111), but not TMB (P = 0.86) between the cCR and non-cCR cases (b,e). P values were calculated using the likelihood ratio test (d). The differences with P ≤ 0.05 were considered significant. TPM, transcripts per million. Source data
Fig. 4
Fig. 4. Immunological analysis of TILs before, during and after combination therapy with dCRT and atezolizumab.
TILs extracted from ESCCs during treatment (pretreatment (cCR, n = 6 patients; non-cCR, n = 12 patients), after dCRT (cCR, n = 7 patients; non-cCR, n = 11 patients), and after atezolizumab treatment (cCR, n = 7 patients; non-cCR, n = 11 patients)) were subjected to FCM. ad, Representative histograms (left) and summaries (right) of the frequencies of intratumor immune cells, including PD-1+CD8+CD3+ T cells (a), PD-1+FOXP3highCD45RACD4+CD3+ T cells (b), CTLA-4+FOXP3highCD45RACD4+CD3+ T cells (c) and CD80+HLA-DR+CD11c+CD45+ cells (d), during treatment (pretreatment, after dCRT and after atezolizumab treatment) are shown according to treatment response. Gray, unstained control; red, patients who achieved cCR (cCR cases); black, patients who did not achieve cCR (non-cCR cases). Bars, mean; P values were calculated using two-way ANOVA. The Holm–Sidak test was performed for multiple comparisons. The differences with P ≤ 0.05 were considered significant. Significant differences between the cCR and non-cCR cases were found for PD-1+CD8+CD3+ T cells pretreatment (P = 0.01), after dCRT (P = 0.007), and after atezolizumab (P = 0.01); for PD-1+ eTreg cells after dCRT (P = 0.02) but not pretreatment (P = 0.63) nor after atezolizumab (P = 0.63); for CTLA-4+ eTreg cells after dCRT (P = 0.02) and after atezolizumab (P = 0.01) but not pretreatment (P = 0.45); and for CD80+HLA-DR+CD11c+ cells after atezolizumab (P = 0.0004) but not pretreatment (P = 0.92) nor after dCRT (P = 0.30). Source data
Fig. 5
Fig. 5. Transcriptomic analysis showed that IL-1R-related pathways are related to resistance after combination therapy with dCRT and atezolizumab.
a, Volcano plots analyzing enriched differential genes between non-cCR ESCC and cCR esophageal cancer samples after combination therapy are shown. Red, patients who achieved cCR (cCR cases); blue, patients who did not achieve cCR (non-cCR cases). P values were calculated using the likelihood ratio test. b, IL1A expression in the ESCCs of cCR cases (left) and non-cCR cases (right) during treatment (pretreatment (cCR, n = 11 patients; non-cCR, n = 17 patients), after dCRT (cCR, n = 10 patients; non-cCR, n = 15 patients) and after atezolizumab treatment (cCR, n = 10 patients; non-cCR, n = 15 patients)) was evaluated. Summaries of the TPM values of IL1A in the ESCCs of cCR cases (left) and non-cCR cases (right) are shown. c, IL1B expression in the ESCCs of cCR cases (left) and non-cCR cases (right) during treatment (pretreatment (cCR, n = 11 patients; non-cCR, n = 17 patients), after dCRT (cCR, n = 10 patients; non-cCR, n = 15 patients) and after atezolizumab treatment (cCR, n = 10 patients; non-cCR, n = 15 patients)) was evaluated. Summaries of the TPM values of IL1B in the ESCCs of cCR cases (left) and non-cCR cases (right) are shown. Gray, pretreatment; red, after dCRT; blue, after atezolizumab (b,c). P values were calculated by one-way ANOVA. For multiple comparisons, Holm‒Sidak’s test was performed. Differences with P ≤ 0.05 were considered statistically significant. Significant differences were found in IL1A for cCR cases (P = 0.00007) but not non-CCR cases (P = 0.45) and in IL1B for non-cCR cases (P = 0.02) but not cCR cases (P = 0.67). d, Gene expression in ESCCs after dCRT was compared to that in ESCCs before treatment by performing GSEA with the indicated gene sets in non-cCR cases. Plots of the enrichment of IL-1R pathway-related genes (left top), granulocyte pathway-related genes (left middle), CTLA-4 pathway-related genes, the iCAF signature (right top) and the CAF signature (right bottom) are shown. Source data
Extended Data Fig. 1
Extended Data Fig. 1. Transcriptomic analysis of antitumor immune responses caused by combination therapy with dCRT and atezolizumab.
Gene expression in ESCCs after dCRT was compared with that in ESCCs prior to dCRT by performing GSEA with the indicated gene sets. (a) Enrichment plots of the indicated gene sets (left, KEGG CYTOSOLIC DNA SENSING PATHWAY; right, KEGG RIG-I LIKE RECEPTOR SIGNALING PATHWAY) are shown. (b) Enrichment plots of the indicated gene sets (left, HALLMARK INTERFERON GAMMA RESPONSE; right, HALLMARK INTERFERON ALPHA RESPONSE) are shown. (c) Gene expression of HLA-A, HLA-B and HLA-C in ESCCs during treatment (pretreatment (N = 28 patients), after dCRT (N = 25 patients) and after atezolizumab treatment (N = 25 patients)) was evaluated. Summaries of the TPM values of the indicated genes are shown. (d) Enrichment plots of the indicated gene sets (left upper, REACTOME ANTIGEN PRESENTATION FOLDING ASSEMBLY AND PEPTIDE LOADING OF CLASS I MHC; right upper, REACTOME COSTIMULATION BY THE CD28 FAMILY; left lower, REACTOME TCR SIGNALING; right lower, REACTOME PD-1 SIGNALING) are shown. (e) Gene expression of the immune checkpoint molecules CD274, PVR and NECTIN2 in ESCCs during treatment (pretreatment (N = 28 patients), after dCRT (N = 25 patients) and after atezolizumab treatment (N = 25 patients)) was evaluated. Summaries of the TPM values of the indicated genes are shown. (f) ssGSEA scores from the indicated gene sets were calculated from gene expression in ESCCs during treatment (pretreatment (N = 28 patients), after dCRT (N = 25 patients) and after atezolizumab treatment (N = 25 patients)). Summaries of ssGSEA scores from the indicated gene sets are shown. (c,e,f) Gray, pretreatment; red, after dCRT; blue, after atezolizumab. P values were calculated by one-way ANOVA. For multiple comparisons, Holm‒Sidak’s test was performed. The differences with P ≤ 0.05 were considered significant. Significant differences were found between the pretreatment, after dCRT, and after atezolizumab stages in HLA-A (P = 0.045), PVR (P = 0.00000002), NECTIN2 (P = 0.01), lineage CD4T (P = 0.02), lineage CD8T (P = 0.004), and lineage NK (P = 0.0007); however, no differences were found in HLA-B (P = 0.15), HLA-C (P = 0.46), CD274 (P = 0.89), and lineage B cell (P = 0.18). Source data
Extended Data Fig. 2
Extended Data Fig. 2. Immunological analysis of TILs affected by combination therapy with dCRT and atezolizumab.
(a, b and e) TILs extracted from ESCCs during treatment (pretreatment (N = 18 patients), after dCRT (N = 18 patients) and after atezolizumab treatment (N = 18 patients)) were subjected to FCM. (a) Summary of Ki-67+ CD8+T, PD-1+CD8+ T, EOMES+T-bet+CD8+ T, and EM CD8+ T cells in the TME during treatment (pretreatment, post-dCRT, and post-atezolizumab treatment). (b) Summaries of FOXP3highCD45RA-CD4+CD3+ T cells, CTLA-4+FOXP3highCD45RA-CD4+CD3+ T cells, PD-1+FOXP3highCD45RA-CD4+CD3+ T cells in the TME during treatment (pretreatment, post-dCRT, and post-atezolizumab treatment) are shown. (c and d) Multiplex IHC of ESCCs during treatment (pretreatment (N = 40 patients), after dCRT (N = 7 patients) and after atezolizumab treatment (N = 3 patients)) was performed. (c) Summaries of intratumor CD8+CD3+ T cells (left), PD-1+CD8+CD3+ T cells (middle) and FOXP3+CD8-CD3+ T cells (right) are shown. (d) Representative pictures of multiplexed IHC of ESCC samples for the indicated markers (CD3, yellow; PD-1, green; DAPI, blue; CD8, purple; FOXP3, red; cytokeratin, white) are shown (N = 1 patient). Scale bar: 50 μm. (e) Summaries of HLA-DR+CD11c+CD45+ cells and PD-L1+HLA-DR+CD11c+CD45+ cells in the TME during treatment (pretreatment, after dCRT and after atezolizumab treatment) are shown. (f) PBMCs isolated from three patients with ESCC were incubated with or without atezolizumab for 20 min at 37°C. After incubation, these PBMC samples were stained with antibodies for FCM analysis. Representative histograms (left) and summaries (right) of PD-L1 expression of HLA-DR+CD11c+CD45+ cells from PBMCs incubated without atezolizumab (black) or with atezolizumab (red) are shown. (a, b, c and e) Gray, pretreatment; red, after dCRT; blue, after atezolizumab. P values were calculated by one-way ANOVA. For multiple comparisons, Holm‒Sidak’s test was performed. Significant differences were found between the pretreatment, after dCRT, and after atezolizumab stages in EOMES+T-bet+CD8+ T cells (P = 0.03), eTreg cells (P = 0.0005), and CTLA-4+ eTreg cells (P = 0.04), but not Ki-67+ CD8+T (P = 0.45), PD-1+CD8+ T (P = 0.21), EM CD8+ T cells (P = 0.09), PDL-1+ eTreg cells (P = 0.73), CD8+CD3+ T cells (P = 0.48), PD-1+CD8+CD3+ T cells (P = 0.53) and FOXP3+CD8-CD3+ T cells (P = 0.81), HLA-DR+CD11c+CD45+ cells (P = 0.57), nor PD-L1+HLA-DR+CD11c+CD45+ cells (P = 0.45). Source data
Extended Data Fig. 3
Extended Data Fig. 3. Immunological analysis of PBMCs affected by combination therapy with dCRT and atezolizumab.
(a-c) PBMCs during treatment (pretreatment (N = 16 patients), after dCRT (N = 17 patients) and after atezolizumab treatment (N = 17 patients)) were subjected to FCM. (a) Summaries of CD8+ T cells, Ki-67+ CD8+ T cells, PD-1+CD8+ T cells, EOMES+T-bet+CD8+ T cells and CCR7-CD45RA- (EM) CD8+ T cells during treatment are shown. (b) Summaries of FOXP3highCD45RA-CD4+CD3+ T cells, CTLA-4+FOXP3highCD45RA-CD4+CD3+ T cells, PD-1+FOXP3highCD45RA-CD4+CD3+ T cells and the ratio of CCR7-CD45RA- (EM)CD8+ T cells to FOXP3highCD45RA-CD4+CD3+ T cells during treatment are shown. (c) Summaries of CD80+HLA-DR+CD11c+CD45+ cells, CD86+HLA-DR+CD11c+CD45+ cells and PD-L1+HLA-DR+CD11c+CD45+ cells during treatment (pretreatment, after dCRT and after atezolizumab treatment) are shown. (a-c) Gray, pretreatment; red, after dCRT; blue, after atezolizumab. P values were calculated by one-way ANOVA. For multiple comparisons, Holm‒Sidak’s test was performed. Significant differences were found between the pretreatment, after dCRT, and after atezolizumab stages in CD8+ T cells (P = 0.03) and Ki-67+ CD8+ T cells (P = 0.03), but not PD-1+CD8+ T cells (P = 0.22), EOMES+T-bet+CD8+ T cells (P = 0.90), EM CD8+ T cells (P = 0.08), eTreg cells (P = 0.55), CTLA-4+ eTreg cells (P = 0.25), PD-1+ eTreg cells (P = 0.70), or the ratio of EM CD8+ T cells to eTreg cells (P = 0.42), CD80+HLA-DR+CD11c+CD45+ cells (P = 0.57), CD86+HLA-DR+CD11c+CD45+ cells (P = 0.68), nor PD-L1+HLA-DR+CD11c+CD45+ cells (P = 0.08). Source data
Extended Data Fig. 4
Extended Data Fig. 4. Transcriptomic analysis of ESCCs during combination therapy with dCRT and atezolizumab.
(a) Gene expression of HLA-A, HLA-B and HLA-C in ESCCs during treatment (pretreatment (cCR, N = 11 patients; non-cCR, N = 17 patients), after dCRT (cCR, N = 10 patients; non-cCR, N = 15 patients) and after atezolizumab treatment (cCR, N = 10 patients; non-cCR, N = 15 patients)) was evaluated according to treatment response. Summaries of the TPM values of the indicated genes are shown. (b) Gene expression of CD274, PVR and NECTIN2 in ESCCs during treatment (pretreatment (cCR, N = 11 patients; non-cCR, N = 17 patients), after dCRT (cCR, N = 10 patients; non-cCR, N = 15 patients) and after atezolizumab treatment (cCR, N = 10 patients; non-cCR, N = 15 patients)) was evaluated according to treatment response. Summaries of the TPM values of the indicated genes are shown. (c) ssGSEA scores from the indicated gene sets were calculated from gene expression in ESCCs during treatment (pretreatment (cCR, N = 11 patients; non-cCR, N = 17 patients), after dCRT (cCR, N = 10 patients; non-cCR, N = 15 patients) and after atezolizumab treatment (cCR, N = 10 patients; non-cCR, N = 15 patients)) according to treatment response. (a-c) Gray, unstained control; red, patients who achieved cCR (cCR cases); black, patients who did not achieve cCR (non-cCR cases). Bars, mean; P values were calculated by two-way ANOVA. For multiple comparisons, Holm‒Sidak’s test was performed. Significant differences in PVR (P = 0.009) and in NECTIN2 (P = 0.03) were found between the cCR and non-cCR cases following atezolizumab treatment, but no significant differences were found pretreatment (PVR P = 0.42; NECTIN2 P = 0.83) or after dCRT (PVR P = 0.76; NECTIN2 P = 0.83). Furthermore, there were no significant differences between the cCR and non-cCR cases at any time point for HLA-A (pretreatment P = 0.50; after dCRT P = 0.16; after atezolizumab P = 0.09), HLA-B (pretreatment P = 0.56; after dCRT P = 0.23; after atezolizumab P = 0.23), HLA-C (pretreatment P = 0.95; after dCRT P = 0.45; after atezolizumab P = 0.49), CD274 (pretreatment P = 0.98; after dCRT P = 0.56; after atezolizumab P = 0.16), general lymphocyte (pretreatment P = 0.84; after dCRT P = 0.84; after atezolizumab P = 0.64), lineage cytotoxic T (pretreatment P = 0.96; after dCRT P = 0.55; after atezolizumab P = 0.89), IFNG28 gene (pretreatment P = 0.95; after dCRT P = 0.67; after atezolizumab P = 0.95), lineage CD4T (pretreatment P = 0.64; after dCRT P = 0.14; after atezolizumab P = 0.64), lineage CD8T (pretreatment P = 0.81; after dCRT P = 0.20; after atezolizumab P = 0.81), lineage B cell (pretreatment, after dCRT, and after atezolizumab, all Ps=0.79), nor lineage NK (pretreatment P = 0.70; after dCRT P = 0.45; after atezolizumab P = 0.94). Source data
Extended Data Fig. 5
Extended Data Fig. 5. Additional analysis of TILs during combination therapy with dCRT and atezolizumab.
(a and b) TILs extracted from ESCCs during treatment (pretreatment (cCR, N = 6 patients; non-cCR, N = 12 patients), post-dCRT (cCR, N = 7 patients; non-cCR, N = 11 patients), and post-atezolizumab treatment (cCR, N = 7 patients; non-cCR, N = 11 patients) were subjected to FCM. (a) Summaries of Ki-67+CD8+ T cells (upper left), EOMES+T-bet+CD8+ T cells (upper middle), CCR7-CD45RA- (EM) CD8+ T cells (upper right), and the ratio of CCR7-CD45RA- (EM) CD8+ T cells to FOXP3highCD45RA-CD4+CD3+ T (lower left) and FOXP3highCD45RA-CD4+CD3+ T cells (lower right) during treatment are shown according to treatment response. (b) Summaries of HLA-DR+CD11c+CD45+ cells (left), CD86+HLA-DR+CD11c+CD45+ cells (middle) and PD-L1+HLA-DR+CD11c+CD45+ cells (right) during treatment (pretreatment, after dCRT and after atezolizumab treatment) are shown according to treatment response. Red, patients who achieved cCR (cCR cases); black, patients who did not achieve cCR (non-cCR cases). Bars, mean; P values were calculated by two-way ANOVA. For multiple comparisons, Holm‒Sidak’s test was performed. (c) Multiplex IHC of pretreatment ESCC samples was performed. Summaries of intratumor CD8+CD3+ T cells (left), PD-1+CD8+CD3+ T cells (middle) and FOXP3+CD8-CD3+ T cells (right) are shown according to treatment response (cCR (N = 17 patients) and non-cCR (N = 23 patients)). Red, cCR cases; black, non-cCR cases. Bars, mean; P values were calculated by unpaired two-tailed t-test. Between the cCR and non-cCR cases, significant differences were found in intratumor CD8+CD3+ T cells (P = 0.007), PD-1+CD8+CD3+ T cells (P = 0.008) and FOXP3+CD8-CD3+ T cells (P = 0.007). Comparing the cCR and non-cCR cases pretreatment, after dCRT, and after atezolizumab, revealed no significant differences at any time point for Ki-67+CD8+ T cells (pretreatment P = 0.79; after dCRT P = 0.23; after atezolizumab P = 0.31), EOMES+T-bet+CD8+ T cells (pretreatment P = 0.95; after dCRT P = 0.90; after atezolizumab P = 0.84), EM CD8+ T cells (pretreatment P = 0.74; after dCRT P = 0.94; after atezolizumab P = 0.94), the ratio of EM CD8+ T cells to eTreg cells (pretreatment P = 0.93; after dCRT P = 0.84; after atezolizumab P = 0.84), and eTreg cells (pretreatment P = 0.89; after dCRT P = 0.72; after atezolizumab P = 0.89), HLA-DR+CD11c+CD45+ cells (pretreatment P = 0.69; after dCRT P = 0.30; after atezolizumab P = 0.73), CD86+HLA-DR+CD11c+ cells (pretreatment P = 0.72; after dCRT P = 0.77; after atezolizumab P = 0.72), nor PD-L1+HLA-DR+CD11c+ cells (pretreatment P = 0.61; after dCRT P = 0.054; after atezolizumab P = 0.61). Source data
Extended Data Fig. 6
Extended Data Fig. 6. Immunological analysis of PBMCs during combination therapy with dCRT and atezolizumab.
(a–c) PBMCs during treatment (pretreatment (cCR, N = 6 patients; non-cCR, N = 10 patients), post-dCRT (cCR, N = 7 patients; non-cCR, N = 10 patients), and post-atezolizumab treatment (cCR, N = 7 patients; non-cCR, N = 10 patients)) were subjected to FCM. (a) Summaries of CD8+ T cells (upper left), Ki-67+ CD8+ T cells (upper middle), PD-1+CD8+ T cells (upper right), EOMES+T-bet+CD8+ T cells (lower left), CCR7-CD45RA- (EM) CD8+ T cells (lower middle), and the ratio of CCR7-CD45RA- (EM) CD8+ T cells to FOXP3highCD45RA-CD4+CD3+ T cells (lower right) during treatment are shown according to treatment response. (b) Summary of FOXP3highCD45RA-CD4+CD3+ T, CTLA-4+FOXP3highCD45RA-CD4+CD3+ T, and PD-1+FOXP3highCD45RA-CD4+CD3+ T cells during treatment according to treatment response. (c) Summaries of CD80+HLA-DR+CD11c+CD45+ cells, CD86+HLA-DR+CD11c+CD45+ cells and PD-L1+HLA-DR+CD11c+CD45+ cells during treatment (pretreatment, after dCRT and after atezolizumab treatment) are shown according to treatment response. (a-c) Red, patients who achieved cCR (cCR cases); black, patients who did not achieve cCR (non-cCR cases). Bars, mean; P values were calculated by two-way ANOVA. For multiple comparisons, Holm‒Sidak’s test was performed. Between the cCR and non-cCR cases significant differences were found in eTreg cells (P = 0.01) pretreatment, but there were no significant differences after dCRT (P = 0.73) or after atezolizumab (P = 0.82). Further, there were no significant differences between the cCR and non-cCR cases at any time point for CD8+ T cells (pretreatment, after dCRT, and after atezolizumab, all Ps=0.54), Ki-67+ CD8+ T cells (pretreatment P = 0.92; after dCRT P = 0.71; after atezolizumab P = 0.16), PD-1+CD8+ T cells (pretreatment P = 0.63; after dCRT P = 0.57; after atezolizumab P = 0.13), EOMES+T-bet+CD8+ T cells (pretreatment P = 0.95; after dCRT P = 0.47; after atezolizumab P = 0.19), EM CD8+ T cells (pretreatment P = 0.10; after dCRT P = 0.08; after atezolizumab P = 0.05), and the ratio of EM CD8+ T cells to eTreg cells (pretreatment, after dCRT, and after atezolizumab, all Ps=0.50), CTLA-4+ eTreg cells (pretreatment P = 0.37; after dCRT P = 0.59; after atezolizumab P = 0.09), PD-1+ eTreg cells (pretreatment P = 0.76; after dCRT P = 0.63; after atezolizumab P = 0.90), CD80+HLA-DR+CD11c+ cells (pretreatment P = 0.9995; after dCRT P = 0.9995; after atezolizumab P = 0.9995), CD86+HLA-DR+CD11c+ cells (pretreatment P = 0.62; after dCRT P = 0.74; after atezolizumab P = 0.33), nor PD-L1+HLA-DR+CD11c+ cells (pretreatment P = 0.46; after dCRT P = 0.08; after atezolizumab P = 0.46). Source data
Extended Data Fig. 7
Extended Data Fig. 7. Immunological analysis of CBC during combination therapy with dCRT and atezolizumab.
Complete blood count (CBC) results from blood tests performed during treatment (pretreatment, post-dCRT, and post-atezolizumab treatment (cCR, N = 21 patients; non-cCR, N = 28 patients) were evaluated. Summaries of white blood cells (WBC) (upper left), neutrophils (upper middle), lymphocytes (upper right), and NLR (lower) during treatment (pretreatment, post-dCRT, and post-atezolizumab treatment) are shown according to treatment response. Red: patients who achieved cCR (cCR cases); black: patients who did not achieve cCR (non-cCR cases). Bars, mean; P values were calculated using two-way analysis of variance. The Holm–Sidak test was performed for multiple comparisons. Between the cCR and non-cCR cases, significant differences after atezolizumab were found in neutrophils (P = 0.04) and NLR (P = 0.006), but there were no significant differences pretreatment (neutrophils P = 0.992; NLR P = 0.95) or after dCRT (neutrophils P = 0.58; NLR P = 0.98). Furthermore, there were no significant differences between the cCR and non-cCR cases at any time point in WBCs (pretreatment P = 0.93; after dCRT P = 0.49; after atezolizumab P = 0.13) or lymphocytes (pretreatment P = 0.94; after dCRT P = 0.57; after atezolizumab P = 0.22). Source data
Extended Data Fig. 8
Extended Data Fig. 8. Transcriptomic analysis of ESCCs according to treatment response after combination therapy with dCRT and atezolizumab.
(a) Gene expression of IL1A (left) and IL1B (right) in ESCCs after combination therapy according to treatment response was examined by RNA-seq. Red, patients who achieved cCR (cCR cases) (N = 10); black, patients who did not achieve cCR (non-cCR cases) (N = 15). (b) Gene expression of ESCCs after combination therapy was evaluated according to treatment response by performing GSEA with the indicated gene sets. Plots showing the enrichment of IL-1R pathway-related genes (left upper), granulocyte pathway-related genes (left lower), the iCAF signature (right upper) and the CAF signature (right lower) are shown. (c) ssGSEA scores from the MDSC_ShirleyLiu gene set were calculated from gene expression in ESCCs after combination therapy and compared according to treatment response was examined by RNA-seq. Red, patients who achieved cCR (cCR cases) (N = 10); black, patients who did not achieve cCR (non-cCR cases) (N = 15). (d) Gene expression in ESCCs of non-cCR cases after combination therapy was compared with that in non-cCR ESCCs prior to treatment by performing GSEA. a plot showing the enrichment of CTLA-4 pathway-related genes is shown. (e) A graphic abstract of this translational study is shown. ESCCs with EMT phenotypes produce IL-1β in response to dCRT, leading to the induction of iCAFs and MDSCs and the activation of Treg cells (upper panel). As a result, these suppressive cells hamper the optimal antitumor immune response and cause resistance to sequential atezolizumab treatment. On the other hand, ESCCs without EMT phenotypes well respond to dCRT and sequential atezolizumab treatment. (a and c) P values were calculated by unpaired two-tailed t-test. Significant differences were found in IL1A (P = 0.003), IL1B (P = 0.03), and MDSC_ShirleyLiu (P = 0.03) between the cCR and non-cCR cases. Source data
Extended Data Fig. 9
Extended Data Fig. 9. Gating strategies for FCM analysis of patient samples.
Gating strategies for immune cells from PBMCs or TILs in FCM analysis are shown.

References

    1. Sung, H. et al. Global Cancer Statistics 2020: GLOBOCAN estimates of incidence and mortality worldwide for 36 cancers in 185 countries. CA Cancer J. Clin.71, 209–249 (2021). - PubMed
    1. Tachimori, Y. et al. Comprehensive registry of esophageal cancer in Japan, 2012. Esophagus16, 221–245 (2019). - PMC - PubMed
    1. Obermannova, R. et al. Oesophageal cancer: ESMO Clinical Practice Guideline for diagnosis, treatment and follow-up. Ann. Oncol.33, 992–1004 (2022). - PubMed
    1. Kitagawa, Y. et al. Esophageal cancer practice guidelines 2017 edited by the Japan Esophageal Society: part 1. Esophagus16, 1–24 (2019). - PMC - PubMed
    1. Ajani, J. A. et al. Esophageal and esophagogastric junction cancers, Version 2.2023, NCCN Clinical Practice Guidelines in Oncology. J. Natl Compr. Canc. Netw.10.6004/jnccn.2023.0019 (2023). - PubMed

Publication types

MeSH terms

Substances