. 2025 Feb 19;8(1):262.
doi: 10.1038/s42003-025-07656-1.

Targeting fatty acid synthase reduces aortic atherosclerosis and inflammation

Affiliations

Targeting fatty acid synthase reduces aortic atherosclerosis and inflammation

Rodrigo Meade et al. Commun Biol. .

Abstract

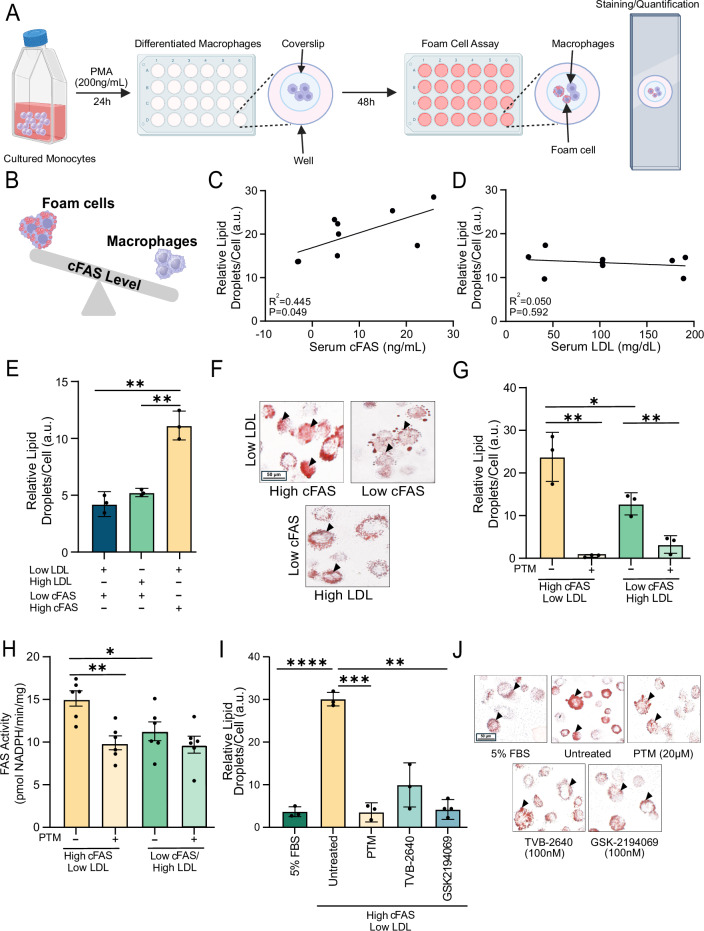
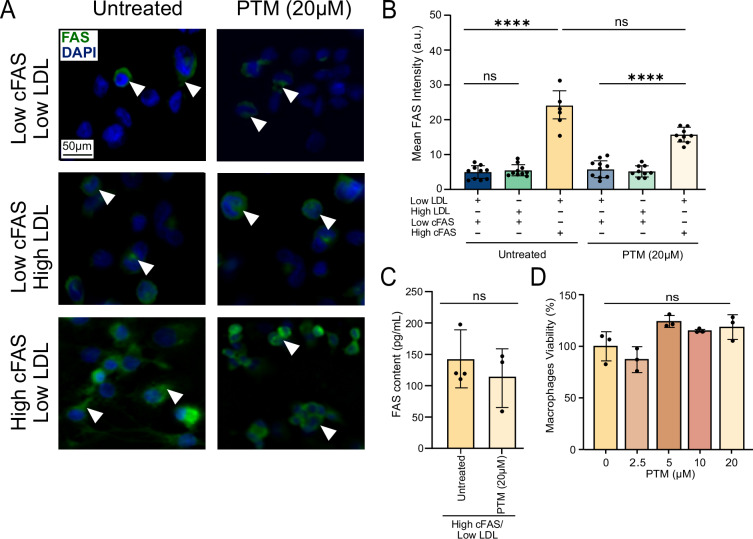
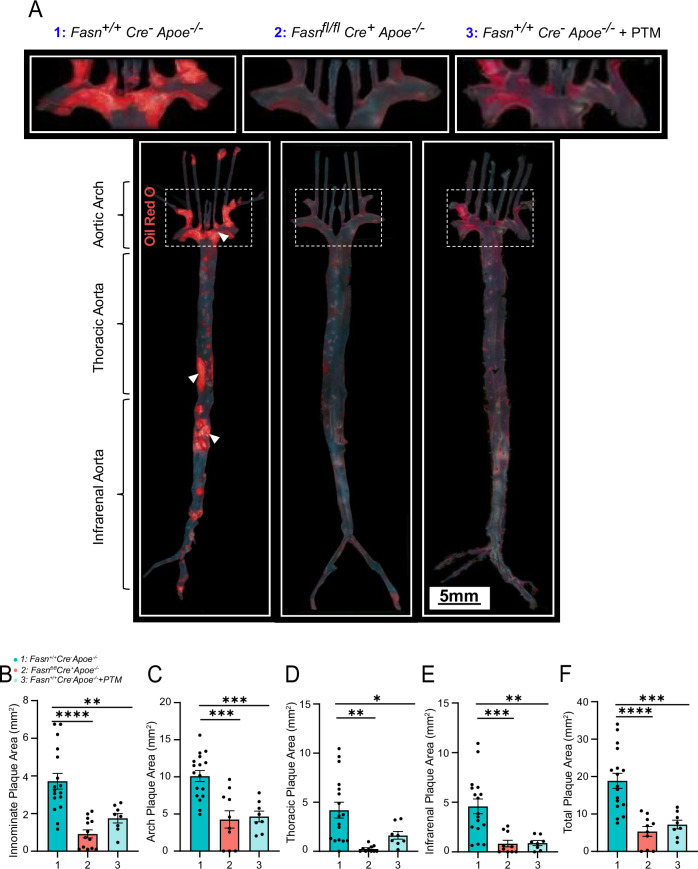
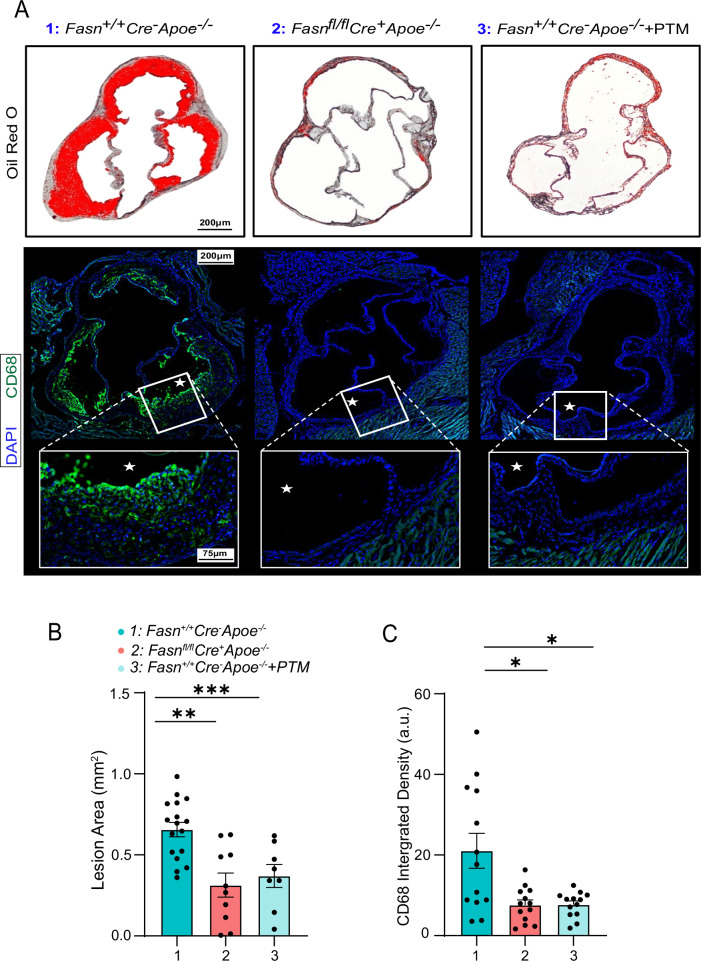
Fatty acid synthase (FAS) is predominantly expressed in the liver and adipose tissue. It plays vital roles in de novo synthesis of saturated fatty acids and regulates insulin sensitivity. We previously demonstrated that serum circulating FAS (cFAS) is a clinical biomarker for advanced atherosclerosis, and that it is conjugated to low-density lipoproteins (LDL). However, it remains unknown whether cFAS can directly impact atheroprogression. To investigate this, we evaluate whether cFAS impacts macrophage foam cell formation - an important cellular process leading to atheroprogression. Macrophages exposed to human serum containing high levels of cFAS show increased foam cell formation as compared to cells exposed to serum containing low levels of cFAS. This difference is not observed using serum containing either high or low LDL. Pharmacological inhibition of cFAS using Platensimycin (PTM) decreases foam cell formation in vitro. In Apoe-/- mice with normal FAS expression, administration of PTM over 16 weeks along with a high fat diet decreases cFAS activity and aortic atherosclerosis without affecting circulating total cholesterol. This effect is also observed in Apoe-/- mice with liver-specific knockout of hepatic Fasn. Reductions in aortic root plaque are associated with decreased macrophage infiltration. These findings demonstrate that cFAS plays an important role in arterial atheroprogression.


Conflict of interest statement

Competing interests: M.Z. is co-founder of AirSeal CardioVascular, Inc., a biomedical startup company that aims to clinically translate diagnostic approaches for individuals suffering from complications related to atherosclerotic cardiovascular disease. All other authors declare no competing interests.

Figures

Fig. 1
Fig. 1. Differential impact of cFAS and LDL on macrophage foam cell formation in vitro.
A Schematic representation of in vitro experiments used to evaluate the impact of cFAS or LDL on macrophage foam cell formation. B Correlation between the percentage of Oil Red O-positive foam cells and serum concentrations of cFAS and LDL. C Evaluation of foam cell formation in differentiated macrophages exposed to varying concentrations of cFAS and D LDL levels; n = 9. The percentage of foam cells was quantified for each condition. E Assessment of foam cell formation in differentiated macrophages under different conditions: high cFAS/low LDL (25.84 ng/mL) and low cFAS/high LDL, with or without treatment with PTM (20 μM). F Representative Oil Red O staining of lipid droplets in macrophages under different cFAS and LDL conditions. Increased lipid droplets are visible under high cFAS and high LDL conditions, compared to low cFAS conditions. G Effect of PTM treatment (20 μM) on lipid droplets in differentiated macrophages under high cFAS/low LDL and low cFAS/high LDL conditions, and H FAS activity. I Differentiated macrophages conditioned with high cFAS/low LDL serum (16.24 ng/mL) were treated with different FAS inhibitors: PTM (20 μM), TVB-2640 (100 nM), and GSK2194069 (100 nM). Untreated cells served as a positive control, and cells cultured in 5% FBS served as a negative control. J Oil Red O staining showed the reduction of lipid droplets in macrophages treated with PTM, TVB-2640, and GSK2194069 compared to controls (5% FBS). Scale bar: 50 μm. Arrows indicate lipid droplets within macrophages. Data are presented as mean ± SEM (n = 3 independent experiments). *p < 0.05, **p < 0.01 compared to control (untreated) conditions. The illustrations in (A) (https://BioRender.com/d25g720) and (B) (https://BioRender.com/e26i107) were created using BioRender.
Fig. 2
Fig. 2. Impact of conditioned serum on intracellular and extracellular FAS in macrophages.
A Immunofluorescence of FAS (FAS-Alexa®488) in macrophages under various cFAS/LDL conditions ± PTM treatment. B Quantification of FAS fluorescence intensity (n = 10). C ELISA of FAS content in macrophages treated with high cFAS/low LDL ± PTM, compared to 5% FBS control (n = 3). D Percentage of cell viability after 48 h of exposure to various PTM concentrations (n = 3). Scale bar, 50 μm. Data are mean ± SEM (n = 3 independent experiments). *p < 0.05, **p < 0.01, ***p < 0.001; ns not significant.
Fig. 3
Fig. 3. FAS inhibition affects murine lipid homeostasis.
A Schematic representation of in vivo murine experiments using Fasn+/+CreApoe/ (1) and Fasnfl/flCre+Apoe/ (2) that were maintained on a high-fat diet for 16 weeks. A group of Fasn+/+Cre+ Apoe/ mice also received PTM (3) throughout this period. Liver and white adipose tissue were collected from all mouse groups. B Impact of Fasn knockdown of on murine body weight (n = 5 per group) over a 16-week period. C and D Liver and white adipose tissue triglycerides for each murine group (n = 6 per group). E and F Liver and white adipose tissue non-esterified free fatty acid content (n = 6 per group). G and H FAS content and activity in liver tissue (n = 6 per group). I and J FAS content and activity in adipose tissue (n = 6 per group). *p < 0.05, **p < 0.01. Data are mean ± SEM. Illustration in (A) was created using BioRender (https://BioRender.com/u19d713).
Fig. 4
Fig. 4. Conditional liver-specific knockdown of FAS and PTM treatment impacts serum cFAS content and activity.
Serum specimens from Fasn+/+Cre Apoe/ mice, Fasnfl/fl Cre+ Apoe/ mice, and Fasn+/+Cre Apoe/ mice treated with PTM, were analyzed for cFAS content (A) and cFAS activity (BD; n = 5 per mouse group). E and F The supernatant of the digested liver was evaluated for cFAS content and activity (n = 5). G and H The supernatant of digested white adipose tissue was evaluated for cFAS content and activity (n = 5). Data are mean ± SEM. *p < 0.05, **p < 0.01, ***p < 0.001.
Fig. 5
Fig. 5. Targeting FAS reduces the aortic atherosclerotic plaque burden.
A Representative enfacements of aortic specimens from different mouse groups that were stained with Oil Red O. Plaque areas are visualized in red. B Total aortic plaque assessment in Fasn+/+CreApoe/ (n = 17), Fasnfl/fl Cre+Apoe/ (n = 10), and Fasn+/+CreApoe/ that were treated with PTM (n = 8). C Plaque burden in the aortic arch segment, D thoracic aorta, E infrarenal aorta, and F innominate artery. Data are mean ± SEM. *p < 0.05, **p < 0.01, ***p < 0.001.
Fig. 6
Fig. 6. Targeting FAS reduced the aortic root plaque burden.
A Hearts were isolated from Fasn+/+Cre Apoe/ mice, Fasnfl/fl Cre+ Apoe/ mice, and Fasn+/+Cre Apoe/ mice treated with PTM, that were maintained on a high-fat diet for 16 weeks. Aortic valve leaflets were sectioned at 10 μm and stained with Oil Red O. The Plaque area is visualized in red. Aortic valve leaflet sections were stained with the macrophage marker CD68 (green) and DAPI nuclear stain (blue). * Indicates lumen. B Plaque lesion area percentage was evaluated in each mouse group (n = 6). C Integrated density was analyzed to evaluate CD68 content in the aortic valve sections of each mouse group (n = 6). Data are mean ± SEM.
Fig. 7
Fig. 7. FAS inhibition reduces tissue FAS and inflammation response.
A Liver tissue were collected from Fasn+/+Cre Apoe/ mice, Fasnfl/fl Cre+ Apoe/ mice, and Fasn+/+Cre Apoe/ mice treated with PTM, that were maintained on a high-fat diet for 16 weeks. Tissues were then sectioned and stained with H&E, and immunostained for FAS and CD68. B Quantification of liver FAS staining (n = 5), and C liver CD68 staining (n = 5). D White adipose tissue were also collected from mouse groups and stained with H&E, and immunostained for FAS and CD68. E Average adipocyte vacuole area (n = 5), F FAS staining (n = 5), and G CD68 staining (n = 5). Data are mean ± SEM.

References

    1. Libby, P. et al. Atherosclerosis. Nat. Rev. Dis. Prim.5, 56 (2019). - PubMed
    1. Song, P. et al. Global and regional prevalence, burden, and risk factors for carotid atherosclerosis: a systematic review, meta-analysis, and modelling study. Lancet Glob. Health8, e721–e729 (2020). - PubMed
    1. Centers for Disease C, Prevention. Vital signs: prevalence, treatment, and control of high levels of low-density lipoprotein cholesterol--United States, 1999–2002 and 2005-200. MMWR Morb. Mortal. Wkly Rep.60, 109–114 (2011). - PubMed
    1. Wu, Z., Gao, L. & Lin, Z. Can proprotein convertase subtilisin/kexin type 9 (PCSK9) inhibitors regress coronary atherosclerotic plaque? A systematic review and meta-analysis. Am. J. Transl. Res.15, 452–465 (2023). - PMC - PubMed
    1. Baigent, C. et al. Efficacy and safety of cholesterol-lowering treatment: prospective meta-analysis of data from 90,056 participants in 14 randomised trials of statins. Lancet366, 1267–1278 (2005). - PubMed

MeSH terms

Substances