Clinical Trial
. 2025 Mar;639(8056):1042-1051.
doi: 10.1038/s41586-024-08508-4. Epub 2025 Feb 19.

RNA neoantigen vaccines prime long-lived CD8+ T cells in pancreatic cancer

Affiliations
Clinical Trial

RNA neoantigen vaccines prime long-lived CD8+ T cells in pancreatic cancer

Zachary Sethna et al. Nature. 2025 Mar.

Abstract

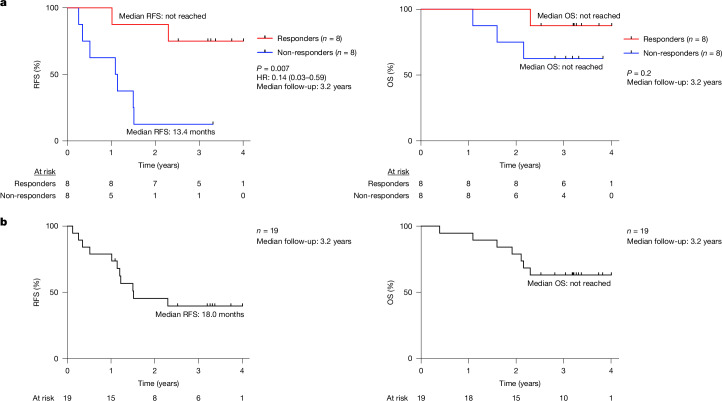
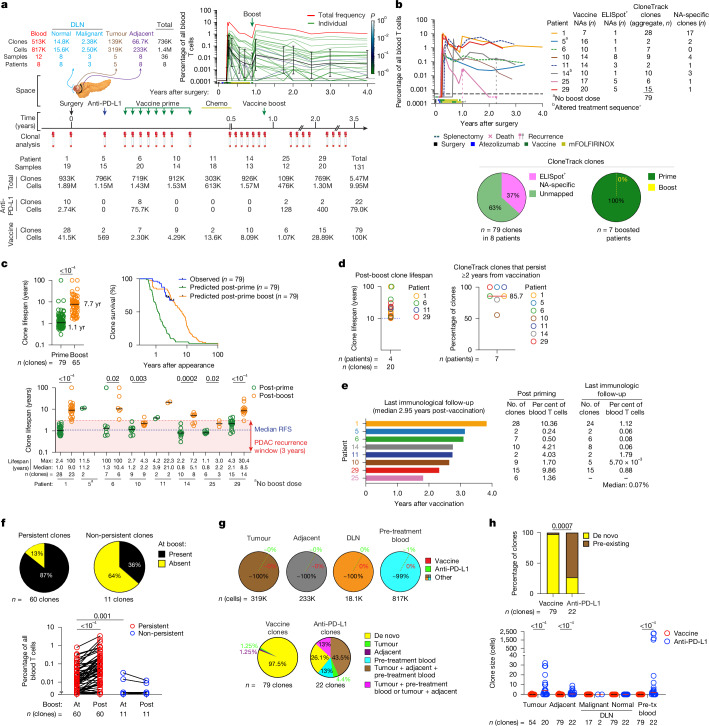
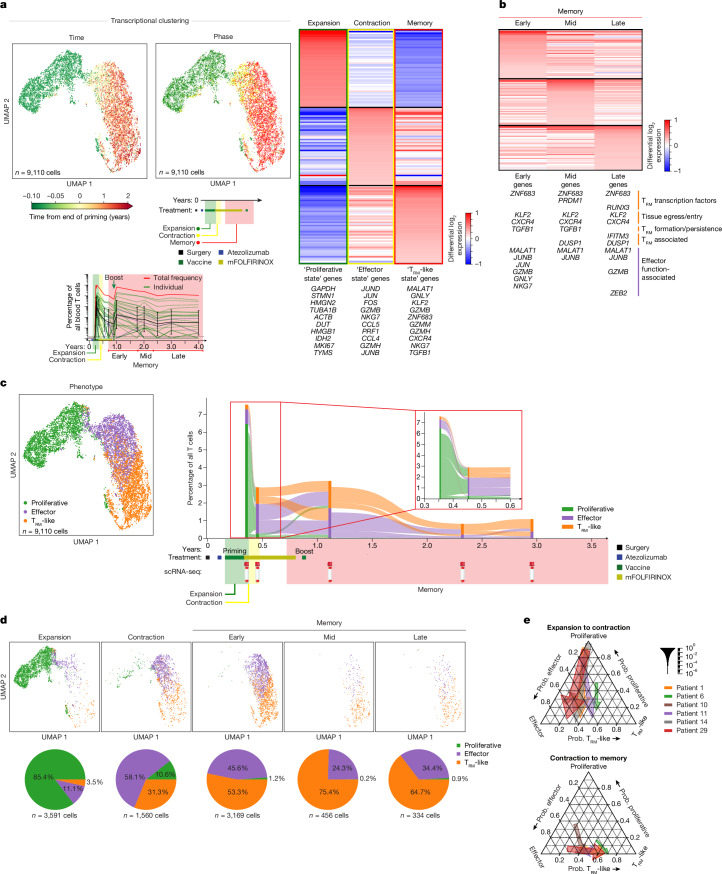
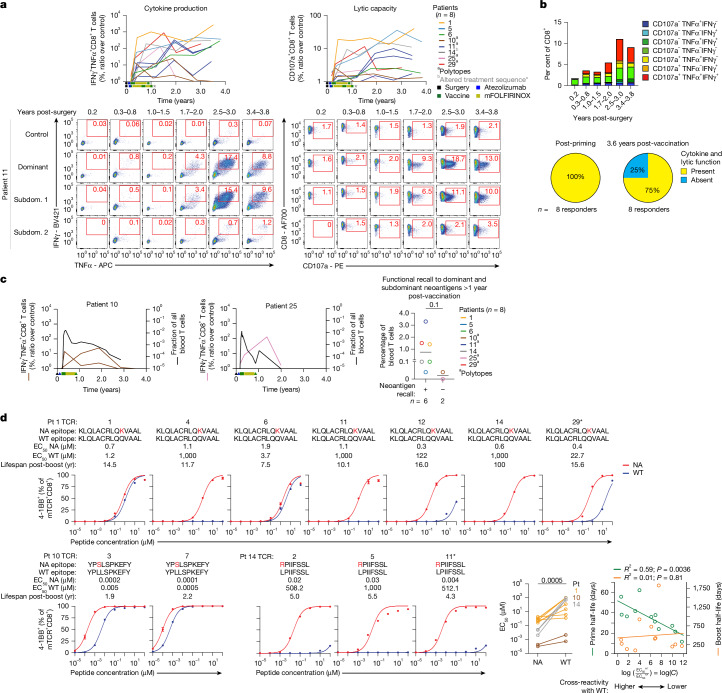
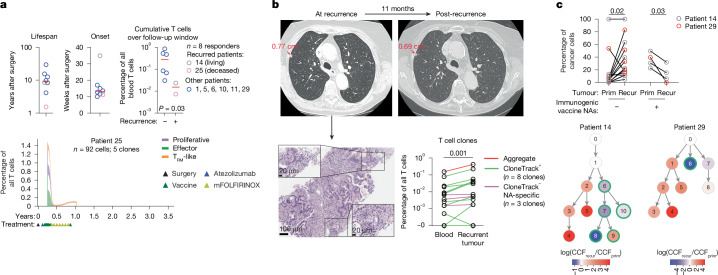
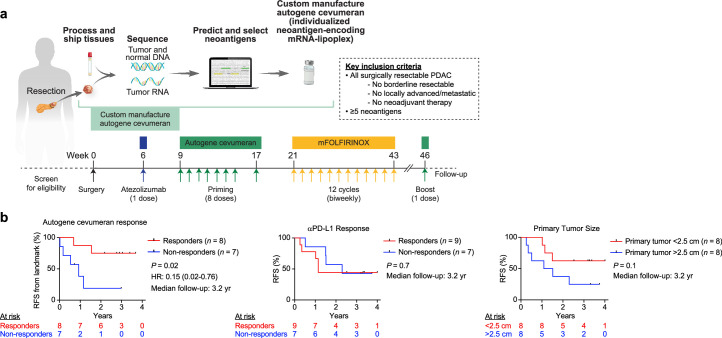
A fundamental challenge for cancer vaccines is to generate long-lived functional T cells that are specific for tumour antigens. Here we find that mRNA-lipoplex vaccines against somatic mutation-derived neoantigens may solve this challenge in pancreatic ductal adenocarcinoma (PDAC), a lethal cancer with few mutations. At an extended 3.2-year median follow-up from a phase 1 trial of surgery, atezolizumab (PD-L1 inhibitory antibody), autogene cevumeran1 (individualized neoantigen vaccine with backbone-optimized uridine mRNA-lipoplex nanoparticles) and modified (m) FOLFIRINOX (chemotherapy) in patients with PDAC, we find that responders with vaccine-induced T cells (n = 8) have prolonged recurrence-free survival (RFS; median not reached) compared with non-responders without vaccine-induced T cells (n = 8; median RFS 13.4 months; P = 0.007). In responders, autogene cevumeran induces CD8+ T cell clones with an average estimated lifespan of 7.7 years (range 1.5 to roughly 100 years), with approximately 20% of clones having latent multi-decade lifespans that may outlive hosts. Eighty-six percent of clones per patient persist at substantial frequencies approximately 3 years post-vaccination, including clones with high avidity to PDAC neoepitopes. Using PhenoTrack, a novel computational strategy to trace single T cell phenotypes, we uncover that vaccine-induced clones are undetectable in pre-vaccination tissues, and assume a cytotoxic, tissue-resident memory-like T cell state up to three years post-vaccination with preserved neoantigen-specific effector function. Two responders recurred and evidenced fewer vaccine-induced T cells. Furthermore, recurrent PDACs were pruned of vaccine-targeted cancer clones. Thus, in PDAC, autogene cevumeran induces de novo CD8+ T cells with multiyear longevity, substantial magnitude and durable effector functions that may delay PDAC recurrence. Adjuvant mRNA-lipoplex neoantigen vaccines may thus solve a pivotal obstacle for cancer vaccination.


Conflict of interest statement

Competing interests: L.A.R., Z.M.S., B.D.G. and V.P.B. are inventors on patent applications related to work on antigen cross-reactivity and tracking vaccine-induced T cell clones. B.D.G. and V.P.B. are inventors on a patent application on neoantigen quality modelling. L.A.R. is an inventor of a patent related to oncolytic viral therapy. B.D.G. has received honoraria for speaking engagements from Merck, Bristol Meyers Squibb and Chugai Pharmaceuticals; has received research funding from Bristol Meyers Squibb, Merck and ROME Therapeutics; and has been a compensated consultant for Darwin Health, Merck, PMV Pharma, Shennon Biotechnologies, Synteny and Rome Therapeutics of which he is a co-founder. V.P.B. reports honoraria and research support from Genentech and research support from Bristol-Myers Squibb. A.S.E received royalties from Up-To-Date. A.V. reports research funding from Lilly, Verastem, BioMed Valley Discoveries, Bristol-Myers Squibb and Silenseed. A.C.W. reports the following: Histosonics, consulting and Ipsen, clinical trial funding. E.M.O. reports research funding to the institution from: Genentech/Roche, BioNTech, AstraZeneca, Arcus, Elicio, Parker Institute, NIH/NCI, Digestive Care and Break Through Cancer; consulting via Data and Safety Monitoring Board (DSMB) for: Arcus, Alligator, Agenus, BioNTech, Ipsen, Merck, Moma Therapeutics, Novartis, Syros, Leap Therapeutics, Astellas, BMS, Fibrogen, Revolution Medicine, Merus Agios (spouse), Genentech-Roche (spouse), Eisai (spouse) and Servier (Spouse). J.D. owns stock in Alnylam Pharmaceuticals, Arrowroot Acquisition and Ionis Pharmaceuticals. T.M. is a co-founder and holds equity in IMVAQ Therapeutics; is a consultant for Immunos Therapeutics, ImmunoGenesis and Pfizer; has research support from Bristol-Myers Squibb, Surface Oncology, Kyn Therapeutics, Infinity Pharmaceuticals, Peregrine Pharmaceuticals, Adaptive Biotechnologies, Leap Therapeutics and Aprea; and has patents on applications related to work on oncolytic viral therapy, alphavirus-based vaccine, neoantigen modelling, CD40, GITR, OX40, PD-1 and CTLA-4. J.D.W. is a consultant for Apricity, CellCarta, Ascentage Pharma, AstraZeneca, Bicara Therapeutics, Boehringer Ingelheim, Bristol-Myers Squibb, Daiichi Sankyo, Dragonfly, Georgiamune, Imvaq, Larkspur, Psioxus, Recepta, Tizona and Sellas. J.D.W. receives grant and research support from Bristol-Myers Squibb and Sephora. J.D.W. has equity in Apricity, Arsenal IO, Ascentage, Imvaq, Linneaus, Georgiamune, Maverick and Tizona Therapeutics. W.P. reports research funding to institution from: Merck, Astellas, Miracogen and Amgen; consultancy or advisory board activity for: Astellas and EXACT Therapeutics; honoraria for Continuing Medical Education (CME) from: American Physician Institute and Integrity. O.T. and U.S. are co-founders, management board members and employees at BioNTech. E.D., L.M. and F.M. are employees at BioNTech. I.R., M.Y. and I.M. are employees at Genentech. The other authors declare no competing interests.

Figures

Fig. 1
Fig. 1. mRNA vaccine immune response correlates with delayed PDAC recurrence at three-year follow-up.
a, RFS and OS stratified by vaccine response in the biomarker-evaluable cohort. b, RFS and OS in the safety-evaluable cohort. HR, hazard ratio, with 95% confidence interval. Black tick marks indicate censorship points. n is the number of individual patients; P values by two-tailed log-rank test. Numbers of at-risk patients are shown below the graphs.
Fig. 2
Fig. 2. mRNA vaccines induce T cells with multiyear lifespans de novo.
a, Analysed T cell clones in tissues and blood. Total includes all blood T cells and clones; anti-PD-L1 and vaccine clones identified by CloneTrack. Top right, trajectory of T cell clones from patient 1. Anti-PD-L1, atezolizumab; chemo, mFOLFIRINOX; vaccine prime and boost doses, autogene cevumeran. b, Top left, longitudinal aggregate percentage of vaccine-induced clones in responders. Coloured rectangles indicate times of surgery, atezolizumab, vaccination and mFOLFIRINOX; asterisk (*) indicates the altered treatment sequence for patient 14. The horizontal dashed line shows the threshold for clone detection. Top right, number of neoantigens (NAs) with validated neoantigen-specific clones. Bottom, percentage of clones mapped to ELISpot-positive (ELISpot+) neoantigens (left) and induced by vaccine prime and boost doses (right). c, Estimated clone lifespan in all (top left) and individual (bottom) patients. Bottom, the red shaded region indicates the three-year historical PDAC recurrence window; median RFS is the historical post-surgery PDAC RFS. Top right, observed versus estimated clone survival. No boost lifespans are shown for 14 clones owing to absent boost or clones. d, Left, top clone lifespans in four patients with highest-longevity clones. The dotted line indicates ten years post-vaccination. Right, percentage of clones per patient that persist two years or more post-vaccination (persistent clones). Patient 25 died less than 2 years post-vaccination. e, Last immunologic follow-up (left; median 2.95 years post-vaccination) and number and aggregate percentage of clones post-priming (all patients) and at last follow-up (patients with persistent clones) (right). f, Percentage of persistent and non-persistent clones at boost in n = 6 boosted patients among clones (top) and among all blood T cells (bottom). g, Top, percentage of tissue T cells containing treatment clones. Bottom, percentage of treatment clones contained in tissues. n is the number of tissue T cells (top) and treatment-induced clones (bottom). h, Percentage of treatment clones in peripheral blood present (pre-existing) or absent (de novo) in tissues pre-treatment (top) and associated clone sizes (bottom). All treatment-induced clones were identified by CloneTrack. Pre-tx, pre-treatment. n is the number of clones, cells or patients. P values by two-tailed Mann–Whitney test (c, h, bottom), two-tailed Wilcoxon matched-pairs signed rank test (f, bottom) and two-sided chi-squared test (h, top). Source Data
Fig. 3
Fig. 3. mRNA vaccine-induced clones converge in memory phase to effector T cells.
ae, Longitudinal phenotypes of 68 out of 71 CloneTrack clones in blood from 6 vaccine responders by single-cell RNA and TCR sequencing. a, Top left, uniform manifold approximation and projection (UMAP) plots of CloneTrack clone T cells by post-vaccination time and phase. Bottom left, schematic of CloneTrack clone phases in patient 1. a,b, Top 50 differentially expressed genes in CloneTrack clone T cells by phase relative to other phases (a, right) and by memory subphase relative to other subphases (b). Gene lists include genes that are characteristic of proliferative, effector and TRM cells overexpressed by phase or subphase (a full gene list is provided in Supplementary Table 1). c, Left, transcriptional clustering of CloneTrack clone T cells by phenotype from single-cell RNA-sequencing (scRNA-seq) data. Right, PhenoTrack plot of phenotype composition and conversion of 68 out of 71 CloneTrack clones over time in 6 responders. Vertical coloured bars show the proportion of cells of each phenotype at corresponding times. Individual PhenoTrack plots are shown in Extended Data Fig. 8b. d, UMAP (top) and phenotype composition (bottom) of CloneTrack clone T cells post-vaccination. e, Phenotype conversion of CloneTrack clones from expansion to contraction (top) and contraction to memory (bottom) in n = 6 primed and boosted responders with persistent clones. Phenotype is plotted as probability (prob.) of each phenotype for clones from each responder. Patient 25 had no persistent clones and was analysed individually in Fig. 5a. Patient 5 did not receive a boost. Arrow width indicates clone frequency aggregated across patients; proximity of arrow base to the axis indicates fraction of cells per patient in a phenotype; arrows point from phenotype origin to destination. n is the number of cells or clones. Source Data
Fig. 4
Fig. 4. Vaccine-induced T cells retain multiple effector functions long term.
ac, Longitudinal cytokine production and lytic capacity of CD8+ T cells after in vitro rechallenge with immunodominant and subdominant (subdom.) ELISpot-positive vaccine neoantigens in responders. a, Top, post-rechallenge aggregate percentage of IFNγ+TNFα+CD8+ T cells (cytokine production) and CD107a+CD8+ T cells (lytic capacity) in responders. The y axis shows the ratio of neopeptide-activated T cell fraction to the DMSO-activated T cell fraction. Asterisk (*) indicates altered treatment sequence for patient 14. Bottom, representative flow cytometry of T cells from a vaccine responder. b, Longitudinal median percentage of CD8+ T cell subsets (top) and percentage of responders with polyfunctional (cytokine+CD107a+) vaccine neoantigen-specific CD8+ T cells (bottom) after in vitro neoantigen rechallenge. c, Left, aggregate fraction of CloneTrack clone T cells in blood and percentage of IFNγ+TNFα+CD8+ T cells after in vitro rechallenge in two responders with waning immunity. Right, aggregate percentage of CloneTrack clone T cells in blood stratified by responders with or without neoantigen-specific IFNγ+TNFα+CD8+ T cells more than one year post-vaccination by in vitro rechallenge. ac, Dominant and subdominant neoantigens are vaccine neoantigens that were previously determined to elicit IFNγ+ T cells by ex vivo IFNγ ELISpot in PBMCs collected 1–3 weeks post vaccine priming (dominant neoantigens elicit a maximal T cell response; subdominant antigens elicit a non-maximal T cell response). DMSO was used as a control. d, Avidity (left) and EC50 values (right) for TCR-transduced CD8+ T cells cultured with human leukocyte antigen (HLA)-matched, neopeptide or wild-type (WT) peptide-pulsed antigen-presenting cells. TCRs isolated from CloneTrack or neoantigen-specific clones (asterisk) are identified as in Extended Data Fig. 3a–c. Residues shown in red are mutated amino acids. log(C) is the antigenic distance. Flow cytometry is gated on live CD3+CD56CD8+ cells (a) or live CD3+CD8+ TCR-transduced cells (d). n is the number of patients. P values by two-tailed Mann–Whitney test (c, right) and two-sided Wilcoxon matched-pairs signed rank test (d, bottom right). Error bars in d indicate s.e.m. Source Data
Fig. 5
Fig. 5. Vaccine immunity and neoantigen editing in patients with recurrent PDAC.
a, Top, estimated lifespan (left), observed time of onset (middle) and cumulative frequency (right) of vaccine-induced CloneTrack clone T cells over the observation period in responders with or without recurrence. Bottom, longitudinal phenotype of CloneTrack clone T cells in patient 25. b, Computed tomography (top; with tumour diameter in red) and histopathology (bottom left) of the solitary lung metastasis from patient 14. Bottom right, vaccine-induced T cell clones in blood and a recurrent tumour from patient 14. CloneTrack+, blood T cell clones identified by CloneTrack as in Extended Data Fig. 2a; CloneTrack NA-specific, blood T cell clones identified as neoantigen-specific in vitro as in Extended Data Fig. 3a–c. c, Percentage (top) and phylogeny (bottom) of cancer clones in primary and recurrent tumours that harbour immunogenic and non-immunogenic vaccine neoantigens (as determined by ex vivo IFNγ ELISpot) in patients 14 and 29. Prim, primary tumour; Recur, recurrent tumour. Red and blue indicate increasing and decreasing cancer clone fraction (CCF) from primary to recurrent tumours, respectively. Green circles indicate clones with immunogenic vaccine neoantigens. n is the number of patients, cells or clones. P values by two-tailed Mann–Whitney test (a, right), two-tailed Wilcoxon matched-pairs signed rank test (b, bottom) and two-tailed paired t-test (c, top). Source Data
Extended Data Fig. 1
Extended Data Fig. 1. Autogene cevumeran but not atezolizumab response or tumor size correlates with RFS at 3-year follow-up.
a, Trial schematic as previously reported. Reproduced under CC BY 4.0: https://creativecommons.org/licenses/by/4.0/. b, Recurrence-free survival (RFS) from landmark time (last vaccine priming dose) stratified by autogene cevumeran (vaccine) immunologic response determined by ex vivo IFNγ ELISpot (left), and RFS from surgery stratified by anti-PD-L1 (atezolizumab) response (middle) and median primary tumour size (right). HR, hazard ratio with 95% confidence interval. Black tick marks, censorship points. n is the number of individual patients. P values by two-tailed log-rank test (b).
Extended Data Fig. 2
Extended Data Fig. 2. Autogene cevumeran induces de novo T cell clones at prime but not boost.
a, b, Vaccine-induced T cell clones at prime (a) and boost (b) identified by CloneTrack. Patient 5 did not receive boost dose and is excluded from (b). Black, blue, green, yellow symbols indicate surgery, atezolizumab, vaccination, mFOLFIRINOX times, respectively. Horizontal line, clone detection threshold; vertical line, recurrence time. Line colour indicates adjusted P value for de novo expansion. n is the number of clones. P values by modified two-tailed Fisher’s exact test (a, b). Source Data
Extended Data Fig. 3
Extended Data Fig. 3. Autogene cevumeran-induced clones identified by CloneTrack contain neoantigen-specific clones.
a-d, To identify neoantigen-specific T cell clones, we stimulated PBMCs at various timepoints post-vaccination in vitro with overlapping neopeptide pools. We then purified CD8+CD107a+/− T cells and identified clones with greater proportion of activated (CD107a+) versus inactivated (CD107a-) cells as in vitro neoantigen-specific T cell clones (NA specific) (as done previously; Methods). For select clones and patients, we validated neoepitope specificity by TCR cloning (NA mapped). a, Assay schematic. b,c, Venn diagrams show overlap of CloneTrack clones (green Venn), NA-specific clones (clones identified as neoantigen-specific with in vitro vaccine neoantigen-specific T cell activation as in a, pink Venn) and NA-mapped clones (clones mapped to neoepitopes by TCR cloning as in a, black Venn) in individual (b) and all (c) n = 8 responders. Trajectory plots/Venn shading show in vivo longitudinal expansion/contraction of clones identified by CloneTrack and validated experimentally (blue shading in Venn diagrams), identified by CloneTrack but not experimentally validated (green shading in the Venn diagrams), and experimentally validated but not found by CloneTrack (pink shading in Venn diagrams). Flow cytometry (b) shows 4-1BB expression on neoantigen-specific TCR-transduced CD8+ T cells (identified as in a, NA mapped clones) cultured with HLA-matched, neo or irrelevant peptide-pulsed antigen-presenting cells. Cells were gated on live, CD3+CD8+ TCR-transduced cells. * Denotes CloneTrack- clones. (d) Percentage of NA-specific and NA-mapped clones (as in c) contained in tissues. Black, blue, green, and yellow symbols indicate surgery, atezolizumab, vaccination, and mFOLFIRINOX times, respectively. n is the number of clones. Source Data
Extended Data Fig. 4
Extended Data Fig. 4. Dynamics, half-lifes and lifespans of autogene cevumeran-induced CloneTrack clones.
a, Number of autogene cevumeran priming doses for CloneTrack clones (identified as in Extended Data Fig. 2a) to reach peak expansion in blood. Red line, median doses to reach peak expansion. b, Percentage of individual patient T cell repertoires represented by individual CloneTrack clones at peak expansion in (a). c, Longitudinal average number of all CloneTrack clone cells per million T cells in responders (n = 8) over time. Circles, mean; error bars, s.e.m. d, Peak expansion (top) and half-life (bottom) of CloneTrack clones post-prime and boost. e, (Top) Representative estimated trajectories post vaccine prime and boost. (Bottom) Root mean square error (RMSE) of exponential fits of estimated trajectories for each clone in each patient. Dashed lines denote where average estimated differences between observed and estimated measurements vary by a factor of 2 (red) or 10 (black). f, Correlation of vaccine-induced expansion peak frequency post-prime (top) and post-boost (bottom) with estimated lifespan (left) and half-life (right). g, CloneTrack clone half-life (top) and lifespan (bottom) with one or more co-expanded clones post-prime (left) and boost (right). h, CloneTrack clone half-life (top) and lifespan (bottom) post-prime (left) and boost (right) in monotope and polytope responders. i, Lifespan of CloneTrack clones stratified by mapped/unmapped neoantigen (NA) specificity in vitro (as in Extended Data Fig. 3a–c). In d-h, n = 8 patients post-prime and n = 7 patients post-boost (patient 5 no boost). n is the number of clones. P values by Kruskal-Wallis test (b), two-tailed Mann Whitney test (d, g, h) and two-tailed Spearman correlation (f). Source Data
Extended Data Fig. 5
Extended Data Fig. 5. T cell clones in shared TCR Vβ specificity groups do not co-expand with autogene cevumeran-induced CloneTrack clones.
a, Generation probability (Pgen) of CloneTrack clones that do/do not persist >2 years post-vaccination (persistent/non-persistent). b, Percentage of CloneTrack clones with intra-patient metaclones in shared TCR Vβ specificity groups. Metaclones were identified as clonotypes with TCR sequences similar to the vaccine-reactive clones (i.e., CloneTrack clones) using GLIPH2.0. c, Individual longitudinal trajectories of CloneTrack metaclones and aggregate CloneTrack clones for comparison. Black, blue, green, and yellow symbols indicate surgery, atezolizumab, vaccination, and mFOLFIRINOX times, respectively. n is the number of clones. P value by two-tailed Mann Whitney test (a). Source Data
Extended Data Fig. 6
Extended Data Fig. 6. Dynamics of atezolizumab-induced T cell clones.
a, Atezolizumab (anti-PD-L1)-induced T cell clones identified by CloneTrack in all vaccine responders. Horizontal line, clone detection threshold; red box, autogene cevumeran responders. Black, blue, green, and yellow indicate surgery, atezolizumab, vaccination and mFOLFIRINOX times, respectively. n is the number of clones. P values by modified two-tailed Fisher’s exact test. Source Data
Extended Data Fig. 7
Extended Data Fig. 7. Autogene cevumeran-induced CloneTrack clone T cells do not acquire exhaustion features long-term.
a, UMAPs of single-cell RNA and TCR sequencing of all blood T cells (all patients, all times) stratified by patient (left), CloneTrack clones (middle) and CD8 expression (right). b-d, Violin plots of select central/effector memory (b), tissue retention (c) and T cell exhaustion (d) associated genes in CloneTrack clone T cells at expansion, contraction and memory phases by single-cell RNA/TCR sequencing as shown in Fig. 3a. n is the number of cells or clones. P values by two-sided pairwise Wilcoxon rank sum test.
Extended Data Fig. 8
Extended Data Fig. 8. Autogene cevumeran-induced CloneTrack clones retain an effector phenotype despite post-vaccination chemotherapy.
a, UMAPs of single-cell RNA and TCR sequencing of CloneTrack clone T cells (all patients, all times) stratified by patient (left) and phenotype (right). b, PhenoTrack plots of phenotype composition and conversion of CloneTrack clones over time in individual responders. Vertical coloured bars show the proportion of cells of each phenotype at corresponding times. Black, blue, green and yellow rectangles indicate surgery, atezolizumab, vaccination and mFOLFIRINOX times, respectively. c, Phenotype conversion of CloneTrack clones from expansion to contraction (top) and contraction to memory (bottom) phases in individual responders. Arrows, individual clones; axis proximity of arrow base, fraction of cells per clone in a phenotype; arrows point from phenotype origin to destination; arrow width, clone frequency. n is the number of cells. Source Data
Extended Data Fig. 9
Extended Data Fig. 9. Autogene cevumeran-induced CloneTrack clone frequency correlates with neoantigen-specific functional recall in vitro.
a, b, Longitudinal cytokine production and lytic capacity (flow cytometry, left; colored curves, right) of CD8+ T cells post bulk PBMC in vitro rechallenge with immunodominant and sub-dominant ELISpot+ vaccine neoantigens, and aggregate fraction of autogene cevumeran-induced CloneTrack clones (black curves) in monotope (a) and polytope (b) responders. Flow cytometry is gated on live, CD3+CD56CD8+ cells. Data for patients 10, 25 (cytokine production) and 11 (flow cytometry) are in Fig. 4a,b. Source Data
Extended Data Fig. 10
Extended Data Fig. 10. Autogene cevumeran responders do not acquire immune activity against non-vaccine neoantigens.
a, b, Longitudinal cytokine production of CD8+ and CD4+ T cells post bulk PBMC in vitro rechallenge with pools of non-vaccine tumor neoantigens depicting individual (a, flow cytometry) and aggregated (b) data in responders. Flow cytometry is gated on live, CD3+CD56CD8+ cells (left) and on live, CD3+CD56CD4+ cells (right). Source Data

References

    1. Rojas, L. A. et al. Personalized RNA neoantigen vaccines stimulate T cells in pancreatic cancer. Nature618, 144–150 (2023). - PMC - PubMed
    1. Neoptolemos, J. P. et al. Adjuvant chemotherapy with fluorouracil plus folinic acid vs gemcitabine following pancreatic cancer resection: a randomized controlled trial. JAMA304, 1073–1081 (2010). - PubMed
    1. Uesaka, K. et al. Adjuvant chemotherapy of S-1 versus gemcitabine for resected pancreatic cancer: a phase 3, open-label, randomised, non-inferiority trial (JASPAC 01). Lancet388, 248–257 (2016). - PubMed
    1. Neoptolemos, J. P. et al. Comparison of adjuvant gemcitabine and capecitabine with gemcitabine monotherapy in patients with resected pancreatic cancer (ESPAC-4): a multicentre, open-label, randomised, phase 3 trial. Lancet389, 1011–1024 (2017). - PubMed
    1. Murugan, A., Mora, T., Walczak, A. M. & Callan, C. G. Statistical inference of the generation probability of T-cell receptors from sequence repertoires. Proc. Natl Acad. Sci. USA109, 16161–16166 (2012). - PMC - PubMed

Publication types

MeSH terms