. 2025 Apr;640(8059):722-731.
doi: 10.1038/s41586-024-08580-w. Epub 2025 Feb 19.

A dual-pathway architecture for stress to disrupt agency and promote habit

Affiliations

A dual-pathway architecture for stress to disrupt agency and promote habit

Jacqueline R Giovanniello et al. Nature. 2025 Apr.

Abstract

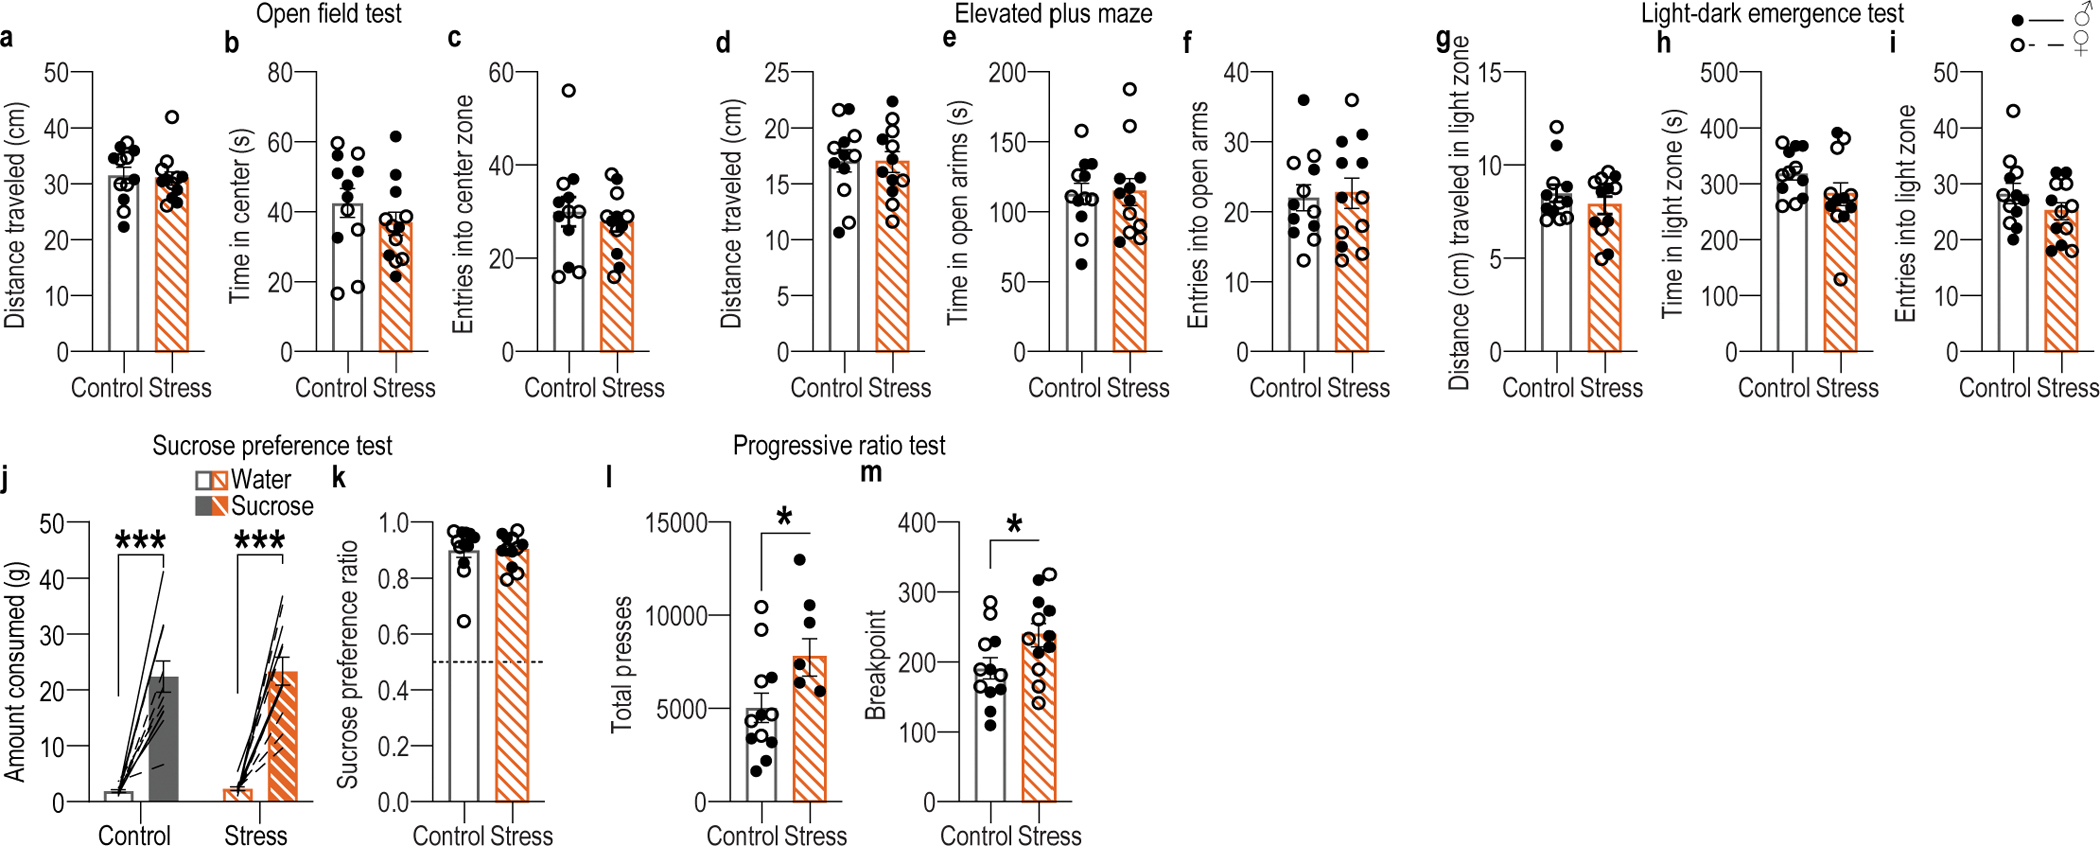
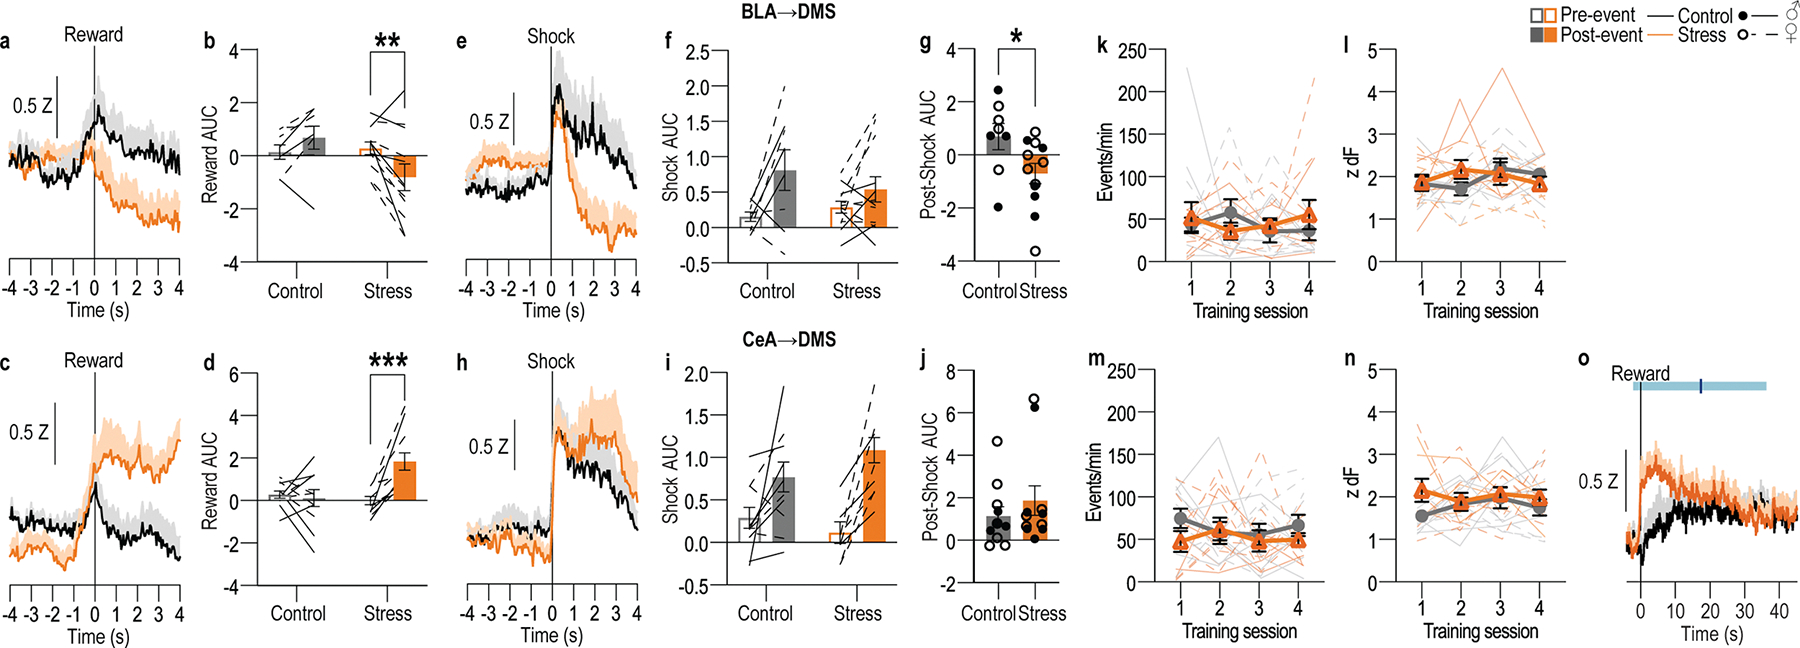
Chronic stress can change how we learn and, thus, how we make decisions1-5. Here we investigated the neuronal circuit mechanisms that enable this. Using a multifaceted systems neuroscience approach in male and female mice, we reveal a dual-pathway, amygdala-striatal neuronal circuit architecture by which a recent history of chronic stress disrupts the action-outcome learning underlying adaptive agency and promotes the formation of inflexible habits. We found that the projection from the basolateral amygdala to the dorsomedial striatum is activated by rewarding events to support the action-outcome learning needed for flexible, goal-directed decision-making. Chronic stress attenuates this to disrupt action-outcome learning and, therefore, agency. Conversely, the projection from the central amygdala to the dorsomedial striatum mediates habit formation. Following stress, this pathway is progressively recruited to learning to promote the premature formation of inflexible habits. Thus, stress exerts opposing effects on two amygdala-striatal pathways to disrupt agency and promote habit. These data provide neuronal circuit insights into how chronic stress shapes learning and decision-making, and help understanding of how stress can lead to the disrupted decision-making and pathological habits that characterize substance use disorders and mental health conditions.


Conflict of interest statement

Competing interests: The authors declare no competing interests.

Figures

Extended data Figure 1:
Extended data Figure 1:. Chronic mild unpredictable stress does not cause classic anxiety- and depression-like phenotypes.
Mice received 14 consecutive d of chronic mild unpredictable stress (stress) including twice daily exposure to 1 of 6 mild stressors at pseudorandom times and orders: damp bedding (16 hr), tilted cage (16 hr), white noise (80 db; 2 hr), continuous illumination (8 hr), physical restraint (2 hr), footshock (0.7-mA, 1-s, 5 shocks/10 min) prior to subsequent testing in a battery of behavioral assays classically used to assess anxiety- and depression-like behavior. (a-c) Open field test. Distance traveled (a; 2-sided t-test: t(22) = 0.32, P = 0.75, 95% CI −4.43 – 3.24), time spent in center zone (b; 2-sided t-test: t(22) = 1.10, P = 0.28), and entries into center zone (c; 2-sided t-test: t(22) = 0.63, P = 0.54, 95% CI −10.03 – 5.36). (d-f) Elevated plus maze. Distance traveled (d; 2-sided t-test: t(22) = 0.08, P = 0.94, 95% CI −2.72 – 2.92), time spent in open arms (e; 2-sided t-test: t(22) = 0.01, P = 0.92, 95% CI −26.17 – 23.70), and entries into open arms (f; 2-sided t-test: t(22) = 0.23, P = 0.82, 95% CI −6.56 – 5.23). (g-i) Light-dark emergence test. Distance traveled in light zone (g; 2-sided t-test: t(22) = 0.97, P = 0.34, 95% CI −0.73 – 2.01), time spent in light zone (h; 2-sided t-test: t(22) = 1.57, P = 0.13, 95% CI −11.93 – 86.98), and entries into light zone (I; 2-sided t-test: t(22) = 1.37, P = 0.19, 95% CI −1.708 to 8.041). (j-k) Sucrose preference test. Average amount consumed of water and 10% sucrose over 24 hr (j; 2-way ANOVA: Solution: F(1, 22) = 113.20, P < 0.0001; Stress: F(1, 22) = 0.14, P = 0.71, Solution x Stress: F(1, 22) = 0.02, P = 0.89) and ratio of sucrose:water consumed (k; t(22) = 0.03, P = 0.98, 95% CI −0.064 – 0.063). (l-m) Progressive ratio Tests. Total presses (l; 2-sided t-test: t(22) = 2.13, P = 0.04, 95% CI 72.94 – 5346) and breakpoint (k; Final ratio completed; 2-sided t-test: t(22) = 2.12, P = 0.46, 95% CI 1.02 – 94.31). Control N = 12 (6 male), Stress N = 12 (6 male) mice. Males = closed circles, Females = open circles. Data presented as mean +/− SEM. *P <0.05, ***P <0.001. Our stress procedure does not affect general locomotor activity or avoidance of anxiogenic spaces or create an anhedonia phenotype. Rather this stress procedure appears to cause elevated motivation to exert effort to obtain reward. This contrasts with more severe, longer-lasting stress procedures, which do produce anxiety- and depression-like phenotypes in these tasks,,. Thus, our stress procedure models chronic, low-level stress.
Extended data Figure 2:
Extended data Figure 2:. Food-port entries during training and probe tests following handling control or chronic stress.
(a) Food-port entry rate across training for subjects in the devaluation experiment. 2-way ANOVA: Training: F(2.42, 108.90) = 3.17, P = 0.04; Stress: F(1, 45) = 0.07, P = 0.79; Training x Stress: F(3, 135) = 0.57, P = 0.64. (b) Food-port entries during the devaluation probe tests. 2-way ANOVA: Value: F(1, 45) = 6.77, P = 0.01, Stress: F(1, 45) = 0.29, P = 0.60; Stress x Value: F(1, 45) = 2.42, P = 0.13. Control N = 22 (13 male), Stress N = 25 (12 male) mice. (c) Food-port entry rate across training for subjects in the contingency degradation experiment. 3-way ANOVA: Training: F(2.84, 62.10) = 6.44, P = 0.001; Stress: F(1, 25) = 0.01, P = 0.91; Future Contingency Degradation group: F(1, 25) = 1.27, P = 0.27; Training x Stress: F(3, 75) = 1.62, P = 0.19; Training x Group: F(3, 75) = 0.24, P = 0.87; Stress x Group: F(1, 25) = 0.004, P = 0.95; Training x Stress x Group: F(3, 75) = 1.49, P = 0.23. (d) Food-port entries during the probe test 24 hr following contingency degradation or non-degraded control. 2-way ANOVA: Stress x Contingency Degradation Group: F(1, 25) = 18.88, P = 0.0002; Contingency Degradation: F(1, 25) = 4.29, P = 0.05; Stress: F(1, 25) = 1.41, P = 0.25. Control, Non-degraded N = 7 (3 male), Control, Degraded N = 7 (3 male), Stress Non-degraded N = 7 (3 male) Stress Degraded N = 8 (4 male) mice. Males = solid lines, Females = dashed lines. Data presented as mean +/− SEM. *P < 0.05, **P < 0.01, corrected for multiple comparisons.
Extended data Figure 3:
Extended data Figure 3:. Lever presses and food-port entries during contingency degradation.
(a) Contingency degradation Procedure. Following stress and training, half the subjects in each group received a 20-min contingency degradation session during which lever pressing continued to earn reward with a probability of 0.1, but reward was also delivered non-contingently with the same probability. This session was identical for non-degraded controls, except they did not receive free rewards. (b) 3-way ANOVA: Press rate in 1-min bins during the contingency degradation session. Time x Contingency Degradation Group: F(19, 475) = 2.03, P = 0.0063; Time x Stress: F(19, 475) = 2.43, P = 0.0007; Stress x Group: F(1, 25) = 0.0001, P = 0.99; Time: F(9.17, 229.20) = 2.13, P = 0.03; Stress: F(1, 25) = 1.36, P = 0.26; Degradation Group: F(1, 25) = 68.23, P < 0.0001; Time x Stress x Degradation Group: F(19, 475) = 1.30, P = 0.19. Contingency degradation cause lower press rates across the session in both control (Time x Contingency Degradation Group: F(12, 228) = 2.47, P = 0.0009; Time: F(6.62, 79.39) = 2.47, P = 0.03; Degradation Group: F(1, 12) = 45.16, P < 0.0001) and stressed (Contingency Degradation Group: F(1, 13) = 28.22, P = 0.0001; Time: F(6.01, 78.16) = 2.19, P = 0.05; Time x Contingency Degradation Group: F(19, 247) = 1.10, P = 0.35) mice. (c) Rate of entry into the food-delivery port in 1-min bins during the contingency degradation session. 3-way ANOVA: Time x Contingency Degradation Group: F(19, 475) = 3.80, P < 0.0001; Time x Stress: F(19, 475) = 1.20, P = 0.26; Stress x Group: F(1, 25) = 0.006, P = 0.94; Time: F(6.26, 156.60) = 7.53, P < 0.0001; Stress: F(1, 25) = 2.51, P = 0.13; Degradation Group: F(1, 25) = 1.37, P = 0.5; Time x Stress x Degradation Group: F(19, 475) = 0.86, P = 0.63. Control, Non-degraded N = 7 (3 male), Control, Degraded N = 7 (3 male), Stress Non-degraded N = 7 (3 male) Stress Degraded N = 8 (4 male) mice. Males = closed circles/solid lines, Females = open circles/dashed lines. Data presented as mean +/− SEM. *P <0.05, **P < 0.01, corrected for multiple comparisons.
Extended Data Figure 4:
Extended Data Figure 4:. BLA and CeA directly project to DMS.
(a) Top: Anterograde tracing approach. Infusion of an AAV expressing mCherry into the CeA. Bottom: mCherry labeling at infusion site in CeA (left) and mCherry-labeled fibers in the DMS (right). N = 4 (2 male) mice. We observed mCherry-expressing putative fibers in the DMS but not dorsolateral striatum. Expression was also detected in other well-known CeA projection targets such as the bed nucleus of the stria terminalis. (b) Top: Retrograde tracing approach. We infused the fluorescently labeled retrograde tracer Fluorogold into the DMS. Bottom: Fluorogold labeling at infusion site in DMS (left) and fluorogold-labeled, DMS-projecting cell bodies in BLA and CeA (middle), with CeA magnified (right). Labeled cells was detected in both BLA and CeA, indicating that both BLA and CeA directly project to DMS. Labeling was greater in BLA than CeA, indicating the BLA→DMS pathway is denser than the CeA→DMS pathway. N = 4 (2 male) mice. (c) Top: Approach for rabies trans-synaptic retrograde tracing of DMS Drd1+ striatal neurons. We used rabies tracing to confirm monosynaptic amygdala projections onto DMS neurons. We infused a starter virus expressing cre-dependent TVA-oG-GFP into the DMS of mice expressing cre-recombinase under the control of dopamine receptor 1 (D1-Cre) or adenosine 2a receptor (A2A-Cre) genes,, followed by ΔG-deleted rabies-mCherry to retrogradely label cells that synapse onto DMS D1 or A2A neurons. Bottom: Starter oG virus (green) and ΔG-deleted rabies-mCherry (red) expression in DMS Drd1+ neurons (left) and rabies-labeled, DMS D1-projecting cell bodies in the BLA and CeA (right), consistent with prior reports,. Representative example from N = 4 (3 males) mice. (d) Top: Approach for rabies trans-synaptic retrograde tracing of DMS Adora2a+ neurons. Bottom: Starter ΔG virus (green) and rabies-mCherry (red) expression in DMS Adora2a+ neurons (left) and rabies-labeled, DMS A2A-projecting cell bodies in the BLA and CeA (right). Representative example N = 4 (3 males) mice. Scale bars = 200 μm. Combined, these data confirm that both BLA and CeA directly project to the DMS and are, thus, poised to influence the learning that supports goal-directed decision making and habit formation.
Extended Data Figure 5:
Extended Data Figure 5:. Food-port entries during training with fiber photometry recording of BLA→DMS or CeA→DMS calcium activity following handling control or chronic stress.
(a) Food-port entry rates across training for BLA→DMS GCaMP8s mice. 2-way ANOVA: Training: F(2.47, 46.99) = 0.65, P = 0.56; Stress: F(1, 19) = 0.05, P = 0.82; Training x Stress: F(3, 57) = 0.24, P = 0.87. BLA Control N = 9 (4 male), BLA Stress N = 12 (5 male) mice. (b) Food-port entry rates across training for CeA→DMS GCaMP8s mice. 2-way ANOVA: Training: F(2.36, 47.19) = 0.89, P = 0.43; Stress: F(1, 20) = 2.71, P = 0.12; Training x Stress: F(3, 60) = 0.09, P = 0.96. CeA Control N = 11 (6 male), CeA Stress N = 11 (4 male) mice. Males = solid lines, Females = dashed lines. Data presented as mean +/− SEM.
Extended Data Figure 6:
Extended Data Figure 6:. BLA→DMS and CeA→DMS pathway baseline activity and pathway responses to unpredicted rewarding and aversive events in control and stressed mice.
(a-j) Following instrumental training (Figure 2), we used fiber photometry to record GCaMP8s fluorescent changes in either BLA (top) or CeA (bottom) neurons that project to the DMS in response to unpredicted food-pellet reward deliveries or unpredicted 2-s, 0.7 mA footshocks in control and stressed mice. (a) Trial-averaged Z-scored Δf/F BLA→DMS GCaMP8s fluorescence changes around unpredicted food-pellet reward delivery. (b) Trial-averaged quantification of area under the BLA→DMS GCaMP8s Z-scored Δf/F curve (AUC) during the 3-s period prior to (baseline) and following reward collection. 2-way ANOVA: Stress x Reward: F(1, 18) = 10.88, P = 0.004; Reward: F(1, 18) = 1.19; P = 0.03; Stress: F(1, 18) = 1.77, P = 0.20. (c) Trial-averaged Z-scored Δf/F CeA→DMS GCaMP8s fluorescence changes around unpredicted food-pellet reward delivery. (d) Trial-averaged quantification CeA→DMS GCaMP8s Z-scored Δf/F AUC during the 3-s period prior to and following reward collection. 2-way ANOVA: Stress x Reward: F(1, 20) = 11.79, P = 0.02; Reward: F(1, 20) = 8.14, P = 0.01; Stress F(1, 20) = 4.49, P = 0.05. (e) Trial-averaged Z-scored Δf/F BLA→DMS GCaMP8s fluorescence changes around unpredicted footshock. (f) Trial-averaged quantification of BLA→DMS GCaMP8s Z-scored Δf/F AUC during the 1-s acute shock response compared to a 1-s pre-shock baseline. 2-way ANOVA: Shock: F(1, 18) = 8.533, P = 0.01; Stress: F(1, 18) = 0.1433, P = 0.71; Stress x Shock F(1, 18) = 1.725, P = 0.21 (g) Trial-averaged quantification of BLA→DMS GCaMP8s Z-scored Δf/F AUC during 2-s post-shock period. 2-sided t-test: t(18) = 2.26, P = 0.04, 95% CI −2.681 to −0.09544. (h) Trial-averaged Z-scored Δf/F CeA→DMS GCaMP8s fluorescence changes around unpredicted footshock. (i) Trial-averaged quantification of CeA→DMS GCaMP8s Z-scored Δf/F AUC during the 1-s acute shock response, compared to baseline. 2-way ANOVA: Shock: F(1, 20) = 28.24, P < 0.0001; Stress: F(1, 20) = 0.22, P = 0.64; Stress x Shock: F(1, 20) = 3.201, P = 0.09. (j) Trial-averaged quantification of CeA→DMS GCaMP8s Z-scored Δf/F AUC during 2-s post-shock period. 2-sided t-test: t(20) = 0.88, P = 0.39, 95% CI −0.99 – 2.43. BLA Control N = 8 (4 male), BLA Stress N = 12 (5 male) mice. CeA Control N = 11 (6 male), CeA Stress N = 11 (4 male) mice. BLA→DMS projections are activated by unpredicted rewards and this is attenuated by prior chronic stress. Conversely, CeA→DMS projections are not normally robustly activated by unpredicted rewards, but are activated by unpredicted rewards following chronic stress. Interestingly, unpredicted rewards robustly activated CeA→DMS projections here, but rewards did not evoke such a response early in instrumental training (Figure 2m). Rather rewards responses developed with training. This indicates that stress-induced engagement of the CeA→DMS pathway may require repeated reward experience, which may reflect engagement of this pathway with repeated reinforcement and/or opportunity to learn the value or salience of the reward. We speculate this CeA→DMS engagement could be a compensatory mechanism triggered in response to the lack of engagement of the BLA→DMS pathway. Both BLA→DMS and CeA→DMS pathways are acutely activated by unpredicted footshock regardless of prior stress. Chronic stress reduces post-shock activity in the BLA→DMS pathway. (k-l) Frequency (k; 2-way ANOVA: Training: F(2.41, 45.69) = 0.17, P = 0.88; Stress: F(1, 19) = 0.08, P = 0.78; Training x Stress: F(3, 57) = 0.85, P = 0.47) and amplitude (l; 2-way ANOVA: Training: F(2.48, 47.10) = 0.86, P = 0.45; Stress: F(1, 19) = 0.034, P = 0.85; Training x Stress: F(3, 57) = 1.37, P = 0.26) of Z-scored Δf/F spontaneous calcium activity of BLA→DMS projections during the 3-min baseline period prior to each training session in handled control and stressed mice. (m-n) Frequency (m; 2-way ANOVA: Training: F(2.70, 53.97) = 0.21, P = 0.88; Stress F(1, 20) = 3.03, P = 0.10; Training x Stress: F(3, 60) = 0.55, P = 0.65) and amplitude (n; 2-way ANOVA: Training: F(2.59, 51.83) = 0.32, P = 0.78; Stress: F(1, 20) = 3.70, P = 0.07; Training x Stress: F(3, 60) = 0.75, P = 0.52) of Z-scored Δf/F spontaneous calcium activity of CeA→DMS projections during the 3-min baseline period prior to each training session handled control and stressed mice. Chronic stress did not alter baseline spontaneous calcium activity in either pathway. (o) Trial-averaged Z-scored Δf/F CeA→DMS GCaMP8s fluorescence changes aligned to reward collection during training, with 40-s post-collection window. Blue line is the average time of the next lever press (light blue bar = s.e.m.). In stressed mice, CeA→DMS neurons respond to earned reward and this activity takes ~30 s on average to come back to baseline. Control N = 11 (6 male), Stress N = 11 (4 male) mice. Males = solid lines, Females = dashed lines. Data presented as mean +/− SEM. **P < 0.01, corrected for multiple comparisons.
Extended Data Figure 7:
Extended Data Figure 7:. Food-port entries during training with BLA→DMS manipulations and devaluation probe tests.
(a-b) Optogenetic inactivation of BLA→DMS projections at reward during instrumental learning. (a) Food-port entries across training. 2-way ANOVA: Training: F(2.03, 38.55) = 3.30, P = 0.05; Virus: F(1, 19) = 0.14, P = 0.71; Training x Virus: F(3, 57) = 0.43, P = 0.73. (b) Food-port entry rates during devaluation probe tests. 2-way ANOVA: Stress x Value: F(1, 19) = 4.38, P = 0.05; Stress: F(1, 19) = 0.47, P = 0.50; Value: F(1, 19) = 0.39, P = 0.54. eYFP N = 10 (5 males), Arch N = 11 (5 male) mice. (c-d) Optogenetic activation of BLA→DMS projections during post-stress instrumental learning. (c) Food-port entry rate across training. 3-way ANOVA: Training: F(2.5, 82.82) = 6.47, P = 0.001; Stress: F(1, 33) = 3.78, P = 0.06; Virus: F(1, 33) = 0.02, P = 0.89; Training x Stress: F(3, 99) = 0.67, P = 0.57; Training x Virus: F(3, 99) = 0.45, P = 0.72; Stress x Virus: F(1, 33) = 2.18, P = 0.15; Training x Stress x Virus: F(3, 99) = 0.26, P = 0.86. (d) Food-port entry rate during the devaluation probe tests. 3-way ANOVA: Value: F(1, 33) = 15.65, P = 0.0004; Stress: F(1, 33) = 0.23, P = 0.63; Virus: F(1, 33) = 0.20, P = 0.65; Value x Stress: F(1, 33) = 2.75, P = 0.11; Value x Virus: F(1, 33) = 0.09, P = 0.76; Virus x Stress: F(1, 33) = 0.17, P = 0.68; Value x Stress x Virus: F(1, 33) = 1.73, P = 0.20. Control, Value: F(1, 16) = 12.42, P = 0.003; Virus: F(1, 16) = 0.0007, P = 0.98; Value x Virus: F(1, 16) = 0.40, P = 0.53. Stress, Value: F(1, 17) = 3.46, P = 0.08; Virus: F(1, 17) = 0.45, P = 0.51; Value x Virus: F(1, 17) = 1.71, P = 0.21. Control eYFP N = 11 (7 male), Control ChR2 N = 7 (4 males), Stress eYFP N = 9 (2 male), Stress ChR2 N = 10 Stress (3 male) mice. (e-f) Chemogenetic activation of BLA→DMS projections during post-stress instrumental learning. (e) Food-port entry rate across training. 3-way ANOVA: Training: F(2.55, 84.12) = 1.64, P = 0.19; Stress: F(1, 33) = 0.05, P = 0.95; Virus: F(1, 33) = 0.08, P = 0.78; Training x Stress: F(3, 99) = 0.16, P = 0.92; Training x Virus: F(3, 99) = 0.21, P = 0.89; Stress x Virus: F(1, 33) = 0.02, P = 0.89; Training x Stress x Virus: F(3, 99) = 3.07, P = 0.03. (f) Food-port entry rate during the devaluation probe test. Planned comparisons 2-sided t-test valued v. devalued, Control mCherry: t(20) = 1.88, P = 0.07, 95% CI - 0.21 – 5.41; Control hM3Dq: t(10) = 1.32, P = 0.20, 95% CI −1.40 – 6.54; Stress mCherry: t(16) = 0.75, P = 0.46, 95% CI −2.04 – 4.44; Stress hM3Dq: t(18) = 3.36, P = 0.002, 95% CI 2.01 – 8.16. Control mCherry N = 12 (7 male), Stress mCherry N = 9 (5 male), Stress hM3Dq N = 10 Stress (5 male) mice. Males = solid lines, Females = dashed lines. Data presented as mean +/− SEM. **P < 0.01, corrected for multiple comparisons.
Extended Data Figure 8:
Extended Data Figure 8:. Manipulation of BLA or CeA terminals in DMS is neither rewarding or aversive.
(a) Following training and testing (Figure 3h–n) mice receive a real-time place preference test in which 1 side of a 2-chamber apparatus was paired with optogenetic inhibition of BLA axons and terminals in the DMS. Average percent time spent in light-paired chamber across 2, 10-minute sessions (one with light paired with each side). 2-sided t-test: t(19) = 0.65, P = 0.52, 95% CI −0.04 – 0.08. eYFP N = 10 (5 male), Arch N = 11 (5 male) mice. Males = closed circles, Females = open circles. Data presented as mean +/− SEM. (b-c) Following training and testing mice receive a real-time place preference test in which 1 side of a 2-chamber apparatus was paired with optogenetic stimulation of DMS-projecting CeA neurons. (b) Average percent time spent in light paired chamber across 2, 10-minute sessions (one with light paired with each side) in handled control subjects. 2-sided t-test: t(21) = 1.75, P = 0.10, 95% CI −0.79 – 9.06. eYFP N = 17 (9 male), ChR2 N = 6 (3 male) mice. (c) Average percent time spent in light paired chamber across 2, 10-minute sessions (one with light paired with each side) in subjects with a prior once/daily stress for 14 d. 2-sided t-test: t(16) = 0.52, P = 0.61, 95% CI −3.74 – 6.17. eYFP N = 8 (4 male), ChR2 N = 10 (6 male) mice. Males = closed circles, Females = open circles. Data presented as mean +/− SEM.
Extended data Figure 9:
Extended data Figure 9:. Food-port entries during training with CeA→DMS manipulations and devaluation probe tests.
(a-b) Optogenetic inhibition of CeA→DMS projections during instrumental overtraining. (a) Food-port entry rates across training. 2-way ANOVA: Training: F(2.29, 45.82) = 1.81, P = 0.17; Virus: F(1, 20) = 0.67, P = 0.42; Training x Virus: F(8, 160) = 0.60, P = 0.77. (b) Food-port entry rates during the devaluation probe tests. 2-way ANOVA: Virus x Value: F(1, 20) = 4.51, P = 0.046; Value: F(1, 20) = 1.47, P = 0.24; Virus: F(1, 20) = 0.41, P = 0.53;. eYFP N = 11 (3 male), Arch N = 11 (7 male) mice. (c-d) Optogenetic inactivation of CeA→DMS projections at reward during post-stress learning. (c) Food-port entry rates across training. 3-way ANOVA: Training: F(2.63, 84.18) = 3.21, P = 0.03; Stress: F(1, 32) = 0.60, P = 0.44; Virus: F(1, 32) = 4.75, P = 0.04; Training x Stress: F(3, 96) = 1.55, P = 0.21; Training x Virus: F(3, 96) = 2.42, P = 0.07; Stress x Virus: F(1, 32) = 0.04, P = 0.84; Training x Stress x Virus: F(3, 96) = 1.14, P = 0.34. (k) Food-port entry rate during the devaluation probe test. 3-way ANOVA: Value x Stress x Virus: F(1, 32) = 0.03, P = 0.86; Value: F(1, 32) = 6.44, P = 0.02; Stress: F(1, 32) = 2.02, P = 0.16; Virus: F(1, 32) = 1.09, P = 0.30; Value x Stress: F(1, 3) = 0.99, P = 0.33; Value x Virus: F(1, 32) = 0.02, P = 0.89; Virus x Stress: F(1, 32) = 0.24, P = 0.63. Control groups, 2-way ANOVA: Value x Virus: F(1, 18) = 0.09, P = 0.77; Value: F(1, 18) = 1.99, P = 0.17; Virus: F(1, 18) = 0.21, P = 0.65. Stress groups, 2-way ANOVA: Value x Virus: F(1, 14) = 0.0005, P = 0.98; Value: F(1, 14) = 3.94, P = 0.06; Virus: F(1, 14) = 0.85, P = 0.87. Control eYFP N = 9 (5 male), Control Arch N = 11 (4 male), Stress eYFP N = 7 (6 male), Stress Arch N = 9 (5 male) mice. (e-f) Chemogenetic inhibition of CeA→DMS projections during post-stress instrumental learning. (e) Food-port entry rates across training. Training: F(1.85, 75.67) = 2.02, P = 0.14; Stress: F(1, 41) = 4.42, P = 0.04; Virus: F(1, 41) = 0.41, P = 0.53; Training x Stress: F(3, 123) = 3.08, P = 0.03; Training x Virus: F(3, 123) = 0.64, P = 0.59; Stress x Virus: F(1, 41) = 0.20, P = 0.66; Training x Stress x Virus: F(3, 123) = 3.23, P = 0.02. (f) Food-port entry rates during the devaluation probe tests. Planned comparisons 2-sided t-test valued v. devalued, Control mCherry: t(11) = 1.94, P = 0.06, 95% CI −0.25 – 12.07; Control hM4Di: t(12) = 0.38, P = 0.71, 95% CI −4.81 – 7.03; Stress mCherry: t(10) = 0.05, P = 0.96, 95% CI −6.33 – 5.99; Stress hM4Di: t(8) = 0.47, P = 0.64, 95% CI −5.47 – 8.76. Control mCherry N = 12 (5 male), Control hM4Di N = 13 (8 male), Stress mCherry N = 11 (5 male), Stress hM4Di N = 9 (4 male) mice. (g-h) Optogenetic stimulation of CeA→DMS projections at reward during learning following subthreshold once daily stress (SubStress). (g) Food-port entry rate across training. 2-way ANOVA: Training: F(1.73, 34.50) = 0.89, P = 0.41; Virus: F(1, 20) = 0.46, P = 0.51; Training x Virus: F(3, 60) = 0.39, P = 0.76. (g) Food-port entry rate during the devaluation probe test. 2-way ANOVA: Virus x Value: F(1, 20) = 1.37, P = 0.26; Virus: F(1, 20) = 0.005, P = 0.94; Value: F(1, 20) = 1.36, P = 0.26. eYFP N = 10 (4 male), ChR2 N = 12 (6 male) mice. Males = solid lines, Females = dashed lines. Data presented as mean +/− SEM.
Extended data Figure 10:
Extended data Figure 10:. Optogenetic stimulation of CeA→DMS projections in control mice.
(a) We used an intersectional approach to express the excitatory opsin Channelrhodopsin 2 (ChR2), or a fluorophore control in DMS-projecting CeA neurons and implanted optic fibers above the CeA. (b) Representative images of retro-cre expression in DMS and immunofluorescent staining of cre-dependent ChR2 expression in CeA (scale bars = 200 μm) and ap of retro-cre in DMS and cre-dependent ChR2 expression in CeA for all subjects. (c) Procedure. Lever presses earned food pellet rewards on a random-ratio (RR) reinforcement schedule. We used blue light (473 nm, 10 mW, 20 Hz, 25-ms pulse width, 2 s) to stimulate CeA→DMS neurons during the collection of each earned reward in mice without a history of stress. Mice were then given a lever-pressing probe test in the Valued state, prefed on untrained food-pellet type to control for general satiety, and Devalued state prefed on trained food-pellet type to induce sensory-specific satiety devaluation (order counterbalanced). (d) Press rates across training. 2-way ANOVA: Training: F(1.85, 38.75) = 62.18, P < 0.0001; Virus: F(1, 21) = 0.23, P = 0.64; Training x Virus: F(3, 63) = 0.05, P = 0.98. (e) Food-port entries across training. 2-way ANOVA: Training: F(2.42, 50.77) = 2.00, P = 0.14; Virus: F(1, 21) = 1.85, P = 0.19; Training x Virus: F(3, 63) = 0.22, P = 0.88. (f) Press rate during the devaluation probe test. 2-way ANOVA: Value: F(1, 21) = 20.32, P = 0.0002; Virus: F(1,21) = 0.92, P = 0.35; Virus x Value: F(1, 21) = 1.17, P = 0.29. (g) Devaluation index. 2-sided t-test: t(21) = 1.37, P = 0.19, 95% CI −0.25 – 0.05. (h) Food-port entries during the devaluation probe tests. 2-way ANOVA: Value: F(1, 21) = 30.07, P < 0.0001; Virus: F(1, 21) = 0.12, P = 0.73; Virus x Value: F(1, 21) = 3.45, P = 0.08. eYFP N = 17 (9 male), ChR2 N = 6 (3 male) mice. Data presented as mean +/− SEM. ** P < 0.01, *** P < 0.001, corrected for multiple comparisons. Optogenetic activation of CeA→DMS projections at reward during learning neither affects affect acquisition of the lever-press behavior, nor the action-outcome learning needed to support flexible goal-directed decision making during the devaluation test.
Figure 1:
Figure 1:. Chronic stress disrupts action-outcome learning and potentiates habit formation.
(a) Procedure. Stress, chronic unpredictable mild stress; RR-10, presses earned food pellet rewards on a random-ratio reinforcement schedule prior to devaluation tests (b) Blood serum corticosterone 24 hr after 14 d of 1 stressor/d, 2 stressors/d, or daily handling (Control). 1-way ANOVA: Stress: F(2, 20)=17.35, P<0.0001. Control N=8 (4 male), 1x stress N=7 (3 male), 2x stress N=8 (4 male). (c) Percent change (Δ) in body weight averaged across the first 10 d of stress. 2-sided t-test: t14=4.50, P=0.0005, 95% Confidence interval (CI) −6.95 - −2.46. N=8/group (4 male) mice. (d) Training press rate (beginning with the last day of fixed-ratio 1 training). 2-way ANOVA: Training: F(2.12, 95.32)=168.20, P<0.0001. See Supplemental Table 1 for full statistical reporting. (e) Devaluation test press rate. 2-way ANOVA: Stress x Value: F(1, 45)=4.43, P=0.04. (f) Devaluation index [(Devalued condition presses)/(Valued condition presses + Devalued presses)]. 2-sided t-test: t(45)=2.99, P=0.005, 95% CI 0.05 – 0.24. Control N=22 (13 male), Stress N=25 (12 male) mice. (g) Procedure. P(Reward|Press)=0.1, presses earned pellets with a probability of 0.1 prior to contingency degradation and test. (h) Training press rate. 2-way ANOVA: Training: F(1.66, 41.39)=211.10, P<0.0001. (i) Press rate during the post-contingency degradation lever-pressing probe test. 2-way ANOVA: Stress x Contingency Degradation Group: F(1, 25)=12.75, P=0.002. Control, Non-degraded N=7 (3 male), Control, Degraded N=7 (3 male), Stress Non-degraded N=7 (3 male) Stress Degraded N=8 (4 male) mice. Males=closed circles/solid lines, Females=open circles/dashed lines. Data presented as mean +/− SEM. **P <0.01, ***P<0.001, corrected for multiple comparisons.
Figure 2:
Figure 2:. Chronic stress attenuates BLA→DMS activity during action-outcome learning and progressively recruits CeA→DMS activity.
(a) Intersectional BLA→DMS or CeA→DMS fiber photometry calcium imaging approach. (b) Expression and fiber map for all subjects. Adapted from. (c) Procedure. Stress, chronic unpredictable stress; RR-10, random-ratio reinforcement schedule. (d-i) Fiber photometry recordings of GCaMP8s in BLA→DMS neurons during learning. (d) Images of retro-cre expression in DMS and immunofluorescent staining of cre-dependent GCaMP8s expression and fiber placement in BLA. Scale bars = 200 μm. (e) Training press rate. 2-way ANOVA: Training: F(1.72, 32.66)=81.40, P<0.0001. (f-g) Trial-averaged Z-scored Δf/F BLA→DMS GCaMP8s fluorescence changes aligned to bout-initiating presses (f) and reward collection (g) across training. (h-i) Area under curve (AUC) 3-s prior to initiating presses (h; 2-way ANOVA: Training: F(2.49, 47.38)=0.91, P=0.43) or following reward collection (i; 2-way ANOVA: Stress: F(1, 19)=24.13, P<0.0001). Control N=9 (4 male), Stress N=12 (5 male) mice. (j-o) Fiber photometry recordings of GCaMP8s in CeA→DMS neurons during learning. (j) Immunofluorescent image of retro-cre expression in DMS and cre-dependent GCaMP8s expression and fiber placement in CeA. (k) Training press rate. 2-way ANOVA: Training: F(1.51, 30.23)=65.61, P<0.0001. (l-m) Trial-averaged Z-scored Δf/F CeA→DMS GCaMP8s fluorescence changes aligned to bout-initiating presses (l) and reward collection (m) across training. (n-o) AUC 3-s prior to initiating presses (n; 2-way ANOVA: Stress: F(1, 20)=0.74, P=0.40) or following reward collection (o; 2-way ANOVA: Training x Stress: F(3, 60)=4.51, P=0.006). Control N=11 (6 male), Stress N=11 (4 male) mice. Males=closed circles/solid lines, Females=open circles/dashed lines. Data presented as mean +/− SEM. *P <0.05, **P <0.01, ***P<0.001, corrected for multiple comparisons.
Figure 3:
Figure 3:. BLA→DMS mediates action-outcome learning and is suppressed by stress to disrupt agency and promote habit formation.
(a-f) Optogenetic BLA→DMS inactivation at reward during instrumental learning. (a) Optogenetic inhibition approach. (b) Top, immunofluorescent images of Arch expression in BLA and optical fiber tip in the vicinity of Arch-expressing BLA terminals in DMS. Scale bars = 200 μm. Bottom, expression and fiber map for all subjects. (c) Procedure. RR-10, random-ratio reinforcement schedule. (d) Training press rate. 2-way ANOVA: Training: F(1.70, 32.34)=41.26, P<0.0001. (e) Devaluation test press rate. 2-way ANOVA: Stress x Value: F(1, 19)=14.35, P=0.001. (f) Devaluation index [(Devalued presses)/(Valued presses + Devalued presses)]. 2-sided t-test: t(19)=5.03, P<0.0001, 95% CI 0.18 – 0.44. eYFP N=10 (5 male), Arch N=11 (5 male) mice. (g-l) Optogenetic BLA→DMS activation at reward during post-stress learning. (g) Intersectional optogenetic activation approach. (h) Top, immunofluorescent images of retro-cre expression in DMS and cre-dependent ChR2 expression and fiber in BLA. Bottom, expression and fiber map for all subjects. (i) Procedure. Stress, chronic unpredictable stress; RI-30s, random-interval reinforcement schedule. (j) Training press rate. 2-way ANOVA: Training: F(1.95, 64.18)=30.17, P<0.0001. (k) Devaluation test press rate. 3-way ANOVA: Value x Stress x Virus: F(1, 33)=6.74, P=0.01. Control groups, 2-way ANOVA: Value x Virus: F(1, 16)=0.3.13, P=0.10. Stress groups, 2-way ANOVA: Value x Virus: F(1, 17)=4.23, P=0.05. (l) Devaluation index. 2-way ANOVA: Stress x Virus: F(1, 33)=9.64, P=0.004. Control eYFP N=11 (7 male), Control ChR2 N=7 (4 males), Stress eYFP N=9 (2 male), Stress ChR2 N=10 Stress (3 male) mice. (m-r) Chemogenetic BLA→DMS activation during post-stress learning. (m) Intersectional chemogenetic activation approach. (n) Top, immunofluorescent images of retro-cre expression in DMS and cre-dependent hM3Dq expression in BLA. Bottom, expression map for all subjects. (o) Procedure. CNO, clozapine-N-oxide. (p) Training press rate. 2-way ANOVA: Training: F(2.04, 67.36)=73.32, P<0.0001. (q) Devaluation test press rate. Planned comparisons 2-sided t-test valued v. devalued, Control mCherry: t(11)=2.76, P=0.01, 95% CI 1.20 – 7.97; Control hM3Dq: t(5)=0.89, P=0.38, 95% CI −2.69 – 6.89; Stress mCherry: t(8)=1.25, P=0.22, 95% CI −1.51 – 6.31; Stress hM3Dq: t(9)=2.9, P=0.007, 95% CI 1.57 – 8.99. (r) Devaluation index. 2-way ANOVA: Stress x Virus: F(1, 33)=11.60, P=0.002. Control mCherry N=12 (7 male), Control hm3Dq N=6 (3 male), Stress mCherry N=9 (5 male), Stress hM3Dq N=10 (5 male) mice. Males=closed circles/solid lines, Females=open circles/dashed lines. Data presented as mean +/− SEM. *P<0.05, **P<0.01, ***P<0.001, corrected for multiple comparisons.
Figure 4:
Figure 4:. CeA→DMS mediates habit formation and is recruited by chronic stress to promote premature habit.
(a-f) Optogenetic inactivation of CeA→DMS projections at reward during natural habit formation. (a) Optogenetic inhibition approach. (b) Top, immunofluorescent images of Arch expression in CeA and optical fiber tip in the vicinity of Arch-expressing CeA terminals in the DMS. Scale bars = 200 μm. Bottom, expression and fiber map for all subjects. (c) Procedure. RI-30s, random-interval overtrain reinforcement schedule. (d) Training press rate. 2-way ANOVA: Training: F(1.46, 29.09)=15.69, P=0.0001. (e) Devaluation test press rate. 2-way ANOVA: Virus x Value: F(1, 20)=4.72, P=0.04. (f) Devaluation index [(Devalued presses)/(Valued presses + Devalued presses)]. 2-sided t-test: t(20)=2.80, P=0.01, 95% CI −0.45 - −0.06. eYFP N=11 (3 male), Arch N=11 (7 male) mice. (g-l) Optogenetic CeA→DMS inactivation at reward during post-stress learning. (g) Optogenetic inhibition approach. (h) Top, immunofluorescent images of Arch expression in CeA and optical fiber tip in the vicinity of Arch-expressing CeA terminals in the DMS. Bottom, expression and fiber map for all subjects. (i) Procedure. Stress, chronic unpredictable stress. (j) Training press rate. Training: F(2.15, 68.91)=31.05, P<0.0001. (k) Devaluation test press rate. 3-way ANOVA: Value x Stress x Virus: F(1, 32)=4.14, P=0.05. Control groups, 2-way ANOVA: Value x Virus: F(1, 18)=0.15, P=0.70. Stress groups, 2-way ANOVA: Value x Virus: F(1, 14)=12.88, P=0.003. (l) Devaluation index. 2-way ANOVA: Stress x Virus: F(1, 32)=4.47, P=0.04. Control eYFP N=9 (5 male), Control Arch N=11 (4 male), Stress eYFP N=7 (6 male), Stress Arch N=9 (5 male) mice. (m-r) Chemogenetic CeA→DMS inhibition during post-stress learning. (m) Intersectional chemogenetic inhibition approach. (n) Top, immunofluorescent images of retro-cre expression in DMS. Bottom, expression map for all subjects. (o) Procedure. CNO, clozapine-N-oxide. (p) Training press rate. 2-way ANOVA: Training: F(1.54, 63.31)=21.12, P<0.0001. (q) Devaluation test press rate. Planned comparisons 2-sided t-tests valued v. devalued, Control mCherry: t(11)=4.59, P<0.0001, 95% CI 4.57 – 11.73; Control hM4Di: t(12)=0.73, P=0.46, 95% CI −2.18 to 4.71; Stress mCherry: t(10)=0.47, P=0.64, 95% CI −4.62 – 2.87; Stress hM4Di: t(8)=2.41, P=0.02, 95% CI 0.79 – 9.07. (r) Devaluation index. 2-way ANOVA: Stress x Virus: F(1, 41)=5.99, P=0.02. Control mCherry N=12 (5 male), Control hM4Di N=13 (8 male), Stress mCherry N=11 (5 male), Stress hM4Di N=9 (4 male) mice. (s-x) Optogenetic CeA→DMS stimulation at reward during learning following subthreshold chronic stress. (s) Intersectional optogenetic stimulation approach. (t) Top, images of retro-cre expression in DMS and immunofluorescent staining of cre-dependent ChR2 expression and fibers in CeA. Bottom, expression and fiber map for all subjects. (u) Procedure. Subthresold stress, 1x daily chronic unpredictable stress; RR-10, random-ratio reinforcement schedule. (v) Training press rate. 2-way ANOVA: Training: F(2.30, 45.90)=71.93, P<0.0001. (w) Devaluation test press rate. 2-way ANOVA: Virus x Value: F(1, 20)=7.40, P=0.01. (x) Devaluation index. 2-sided t-test t(20)=4.29, P=0.0004, 95% CI 0.19 – 0.55. eYFP N=10 (4 male), ChR2 N=12 (6 male) mice. Males=closed circles/solid lines, Females=open circles/dashed lines. Data presented as mean +/− SEM. ^P=0.069, *P<0.05, **P<0.01, ***P <0.001, corrected for multiple comparisons.

Update of

References

    1. Schwabe L & Wolf OT Stress prompts habit behavior in humans. J Neurosci 29, 7191–7198 (2009). - PMC - PubMed
    1. Pool ER et al. Determining the effects of training duration on the behavioral expression of habitual control in humans: a multilaboratory investigation. Learn Mem 29, 16–28 (2022). 10.1101/lm.053413.121 - DOI - PMC - PubMed
    1. Friedel E et al. How Accumulated Real Life Stress Experience and Cognitive Speed Interact on Decision-Making Processes. Front Hum Neurosci 11, 302 (2017). 10.3389/fnhum.2017.00302 - DOI - PMC - PubMed
    1. Schwabe L, Dalm S, Schächinger H & Oitzl MS Chronic stress modulates the use of spatial and stimulus-response learning strategies in mice and man. Neurobiol Learn Mem 90, 495–503 (2008). 10.1016/j.nlm.2008.07.015 - DOI - PubMed
    1. Dias-Ferreira E et al. Chronic stress causes frontostriatal reorganization and affects decision-making. Science 325, 621–625 (2009). 10.1126/science.1171203 - DOI - PubMed

ADDITIONAL REFERENCES

    1. Tye KM et al. Dopamine neurons modulate neural encoding and expression of depression-related behaviour. Nature 493, 537–541 (2013). 10.1038/nature11740 - DOI - PMC - PubMed
    1. Cerniauskas I et al. Chronic Stress Induces Activity, Synaptic, and Transcriptional Remodeling of the Lateral Habenula Associated with Deficits in Motivated Behaviors. Neuron 104, 899–915.e898 (2019). 10.1016/j.neuron.2019.09.005 - DOI - PMC - PubMed
    1. Monteiro S et al. An efficient chronic unpredictable stress protocol to induce stress-related responses in C57BL/6 mice. Front Psychiatry 6, 6 (2015). 10.3389/fpsyt.2015.00006 - DOI - PMC - PubMed
    1. Bavley CC, Fischer DK, Rizzo BK & Rajadhyaksha AM Ca. Neurobiol Stress 7, 27–37 (2017). 10.1016/j.ynstr.2017.02.004 - DOI - PMC - PubMed
    1. Freymann J, Tsai PP, Stelzer HD, Mischke R & Hackbarth H Impact of bedding volume on physiological and behavioural parameters in laboratory mice. Lab Anim 51, 601–612 (2017). 10.1177/0023677217694400 - DOI - PubMed