. 2025 Apr;640(8058):534-542.
doi: 10.1038/s41586-025-08588-w. Epub 2025 Feb 19.

Cooperative nutrient scavenging is an evolutionary advantage in cancer

Affiliations

Cooperative nutrient scavenging is an evolutionary advantage in cancer

Gizem Guzelsoy et al. Nature. 2025 Apr.

Abstract

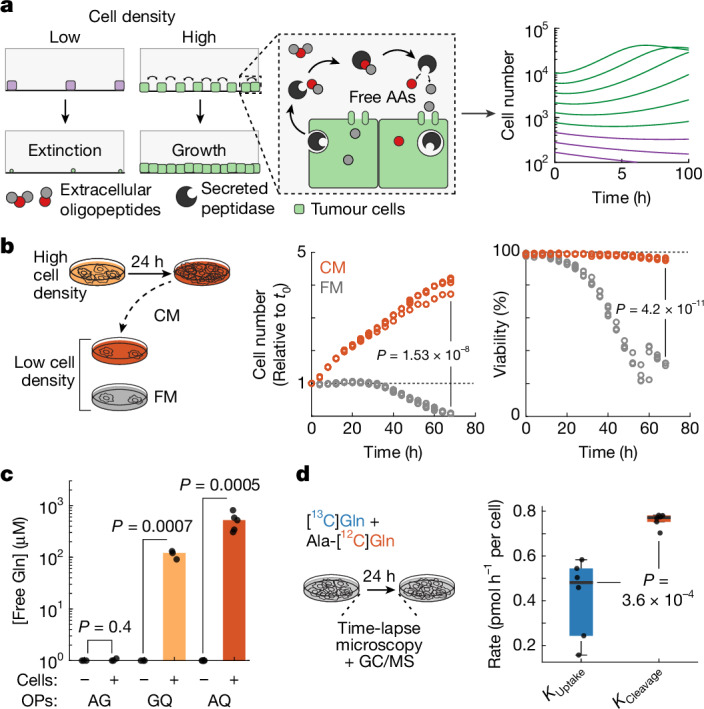
The survival of malignant cells within tumours is often seen as depending on ruthless competition for nutrients and other resources1,2. Although competition is certainly critical for tumour evolution and cancer progression, cooperative interactions within tumours are also important, albeit poorly understood3,4. Cooperative populations at all levels of biological organization risk extinction if their population size falls below a critical tipping point5,6. Here we examined whether cooperation among tumour cells may be a potential therapeutic target. We identified a cooperative mechanism that enables tumour cells to proliferate under the amino acid-deprived conditions found in the tumour microenvironment. Disruption of this mechanism drove cultured tumour populations to the critical extinction point and resulted in a marked reduction in tumour growth in vivo. Mechanistically, we show that tumour cells collectively digest extracellular oligopeptides through the secretion of aminopeptidases. The resulting free amino acids benefit both aminopeptidase-secreting cells and neighbouring cells. We identified CNDP2 as the key enzyme that hydrolyses these peptides extracellularly, and loss of this aminopeptidase prevents tumour growth in vitro and in vivo. These data show that cooperative scavenging of nutrients is key to survival in the tumour microenvironment and reveal a targetable cancer vulnerability.


Conflict of interest statement

Competing interests: NYU has filed a patent application covering the subject matter described in the Article that names C.C.-F. as inventor.

Figures

Fig. 1
Fig. 1. Tumour cells cooperate to use oligopeptides as amino acid sources.
a, Population growth over time for A375 cells. Purple lines show populations whose sizes decreased over time. b, Population density and environmental adversity are critical in cooperation. c, Left, theoretical per capita versus population size in non-cooperative populations (logistic growth, blue) or with cooperation (Allee growth, orange). Right, experimental data for A375 cells, showing clear cooperative growth. K, maximum population size (carrying capacity); max, maximum; NA, Allee threshold. d, Cartoon showing how NA increases under harsher environments. In this example, larger groups of penguins are required to cope with colder temperatures. e, Estimation of NA values under different glucose (left) and glutamine (right) concentrations. Dots were obtained from experimental data; lines are a fit from the Allee effect model. f, Analysis of liquid chromatography–mass spectrometry (LC/MS) data from Wu et al.. Tumour dipeptide concentration were measured in n = 9 patients with non-small cell lung cancer (NSCLC) and compared to levels in normal lung tissue from the same patients. Left, data for all detected dipeptides. Right, detailed information for Gln-containing dipeptides. Sequences shown using the one-letter amino acid code. Asterisks indicate YX and XY sequences that were not chromatographically resolvable. g, Left, expected growth curves for cells growing without cooperation (logistic growth, blue) or with cooperation (Allee growth, orange). Right, growth curves for A375 cells seeded at high and low densities supplemented with Gln or with the dipeptide Ala-Gln. h, Representative images from data shown in g. Percentage cell viability is shown; estimated via propidium iodide incorporation. Green and magenta dots indicate software-detected live and dead cells, respectively. Growth curves for other cell types and cells grown on other oligopeptides are shown in Extended Data Fig. 1f–j. Scale bars, 75 µm.
Fig. 2
Fig. 2. Tumour cells cleave oligopeptides in the extracellular space and share resulting amino acids.
a, Schematic (left) and mechanistic mathematical model (right) showing that the Allee effect and cell cooperation emerge spontaneously from the collective hydrolysis of extracellular peptides. Green lines show populations that grew over time. Purple lines show populations that decreased in size over time. Data for this figure were obtained from A375 cells. AAs, amino acids. b, Sparse cultures of A375 cells were cultured in conditioned medium (CM) collected from high-density populations that were grown in Ala-Gln for 24 h. Fresh medium (FM) had the same formulation as conditioned medium, but was incubated without cells. Plots show relative cell numbers and population viability over time. c, High levels of free glutamine were detected in conditioned media from cells grown with 2 mM of glutamine-containing dipeptides (GQ or AQ). Glutamine was not detected in fresh media or in conditioned media supplemented with dipeptides not containing glutamine (for example, Ala-Gly). Data are mean ± s.d. of n = 3 (AG and GQ) and n = 5 (AQ) replicates. OPs, oligopeptides. d, Estimation of glutamine consumption rate (KUptake), and the cleavage rate of Ala-Gln (KCleavage). n = 6. Error bars denote s.d. Two-sided t-test. See Extended Data Fig. 2h–k for information on additional cell lines.
Fig. 3
Fig. 3. The aminopeptidase CNDP2 mediates the cooperative cleavage of extracellular oligopeptides.
a, Inhibitors used to identify proteases responsible for cooperation. Cila, cilastatin; Dox, doxycycline; iAN, aminopeptidase N inhibitor; JPM, JPM-OEt; Lina, linagliptin; SC, Sigma C-, S-, T- and D-peptidase inhibitor cocktail. b, Growth curves (bottom) and representative images (top) of A375 cells growing on Ala-Gln and treated with bestatin or with bestatin and Gln. Scale bars, 100 µm. c, We synthesized PEGylated analogues of bestatin to reduce its cell permeability. All tested analogues inhibited growth on Ala-Gln with no effects on cells growing on Gln. d, The strategy used to identify CNDP2 as the key extracellular aminopeptidase for cooperative peptide cleavage. Proteomic analysis of conditioned media revealed the presence of 16 secreted aminopeptidases (SAPs). APs, aminopeptidases; PSM, peptide-spectrum match. e, Growth curves of lung KP Keap1-KO (Cndp2-wild-type (WT)) and isogenic Cndp2-KO cells, and Cndp2-KO cells expressing CNDP2 from a CMV promoter. Plots show relative cell numbers and population viability over time. f, Cell lysates and conditioned media from Cndp2-WT and Cndp2-KO cells were immunoblotted for CNDP2. Representative data from three independent experiments. For gel source data, see Supplementary Fig. 1. g, Recombinant CNDP2 (rCNDP2) was used to estimate the levels of endogenous CNDP2 in CM. Right, quantification of the enhanced chemiluminescence (ECL) from blots on the left. Data representative of three independent experiments. For gel source data, see Supplementary Fig. 1. a.u., arbitrary units. h, Growth of lung KP Cndp2-KO cells on Ala-Gln is rescued by extracellular rCNDP2. Data are mean ± s.d. of three replicates. Student’s t-test. i, Conditioned medium from Cndp2-KO cells does not stimulate growth in cultures of Cndp2-WT cells. Conditioned medium was collected from Cndp2-WT or Cndp2-KO cells grown in Ala-Gln for 24 h. Data points depict averages from four visual fields. Two-tailed t-tests.
Fig. 4
Fig. 4. CNDP2 is the key aminopeptidase in the collective cleavage of oligopeptides.
a, C57BL/6J mice on a glycine- and serine-restricted diet were injected with 5 × 104 wild-type or Cndp2-KO lung adenocarcinoma cells or Cndp2-KO adenocarcinoma cells in which CNDP2 was re-expressed (n = 14, 24 and 10 mice, respectively). Kaplan–Meier plots compared using log-rank test. b, Western blots from cell lysates and conditioned media from Cndp2-KO cells engineered to express CNDP2, an intracellularly enriched CNDP2 variant (NLSSV40–CNDP2) or an extracellularly enriched form (SSPIL-2–CNDP2). For gel source data, see Supplementary Fig. 1. c, Mice on a glycine- and serine-restricted diet were injected with 5 × 104 lung adenocarcinoma cells as described in a. Kaplan–Meier plots show that NLSSV40–CNDP2 does not rescue tumour growth. n = 5 mice per condition. P values by log-rank test. d, Left, structures of bestatin and PEGstatin, a PEGylated analogue with reduce cell permeability. Mice were injected intravenously with lung KPK cells and treated for 10 days with bestatin, PEGstatin or vehicle. AUC, area under the curve. n = 4 mice per condition. e, C57BL/6 mice were injected intravenously with lung KP cells with a dominant-negative Keap1 mutation (R470C). They were then treated with bestatin or PBS for 10 days (n = 4 mice per treatment). Lungs were examined at the end of the experiment (approximately 3 weeks after the start). In d,e, data are presented as box plots showing the 25th and 75th percentiles (boxes) and 5th and 95th percentiles (lines).
Fig. 5
Fig. 5. CNDP2 inhibition reduces tumour growth and formation.
a, Schematic representation of how non-cooperator and cooperator cells may interact. b, Growth rates of Cndp2-wild-type and Cndp2-KO cells as mono- or co-cultures. *P = 0.0013, **P = 1.4 × 10−16. Data presented as boxplots, showing the 25th and 75th percentiles (boxes) and 5th and 95th percentiles (lines). n = 4 biological replicates. c, Long-term co-culture experiments. Cell clones were labelled with mCherry (cooperators) or YFP (cooperators or non-cooperators) and seeded at 1:1 and grown in Ala-Gln or Gln. Data compared using Student’s t-test. d, Left, MEMIC experimental setup. Cooperators and non-cooperators were seeded at 1:1 ratio and grown in the MEMIC for one week. Scale bar, 100 µm. Right, representative images of week-old images and quantified fluorescence for both populations along the MEMIC. Fluorescence normalized to values at 0 µm. Dispersion estimated through bootstrapping. e, Top, mice were injected with cooperator mCherry cells mixed at a 1:1 ratio with cooperator YFP or non-cooperator YFP cells. Tumours were collected at different time points and analysed via flow cytometry and immunofluorescence microscopy (IF). Scatter plots show examples for cooperator mCherry/non-cooperator YFP tumours 13 and 30 days after injection. Bottom, percentage of YFP+ tumour cells. t1/2, half-life. n = 4 per timepoint and condition. f, Representative section of a 30-day tumour, showing the end of a cooperator/non-cooperator competition experiment. Blood vessels stained with an anti-CD31. n = 4 per timepoint and condition. Scale bar, 100 µm. g, Quantification of f. Top left, detail of a tumour section showing nuclear and endothelial staining. Yellow lines are separated by 20 µm and follow the contour of vessels. Top right, image shows the same visual field, but regions are colour-coded by their distance to the closest vessel. Bottom, histogram depicting the distance to the closest vessel for wild-type and Cndp2-KO cells. Non-cooperators (Cndp2-KO, purple) were rarely found further than 100 µm from a vessel (purple arrow). Data pooled from 3 different tumours. Data compared using Student’s t-test.
Extended Data Fig. 1
Extended Data Fig. 1. Tumor cell growth on oligopeptides requires cooperation.
a. High-throughput live microscopy and image analysis were used to track cell growth and compare it to mathematical models of cooperative and non-cooperative populations. b. Examples and validation of the automated image analysis. Left: representative image of a high-density culture at high and low magnification. Cell nuclei were stained with Hoechst to test automated cell detection algorithm. Bar: 50 µm. Center plot: image analysis allows accurate cell counts over a large range of cell densities. Right plot: this method is more accurate than others, such as MTT, especially at low cell densities. It also allows discriminating between different fluorophores. In this case cells expressing H2B-Teal, H2B-mCitrine, or H2B-mCherry. c. Models of population growth over time using a logistic (left, no cooperation) or an Allee effect (right, cooperative) models. Allee threshold (NA) is the critical population size under which growth cannot resume. d. Experimental data for A375 cells showing cooperative growth that increases with limiting levels of glutamine (Gln, higher Allee threshold, NA). K: maximum population size (carrying capacity). e. Di-and tripeptides detected in renal carcinoma patients, comparing paired normal and malignant tissues. Metabolomic data was re-analyzed from published work. f. A375 cells were seeded at different cell densities and then fed with Gln, with all Xaa-Gln dipeptides, or kept without any source of Gln. Colors show growth relative to +Gln condition. Dipeptide sequences shown using one-letter code. g. Representative growth plots of A375 cells seeded at high and low densities and starved of glutamine and then fed with Gln or Ala-Gln (Alanyl-Glutamine). h. Representative growth plots of A375 cells seeded at high and low densities and starved of glutamine and then fed with Gln, oligopeptide mixes without free Gln, or kept without any source of Gln. Cas: Casitone, Tryp: Tryptone. i. Growth of glutamine-starved cells on tri- and tetra-peptides. Peptide sequences shown using one-letter code. j. Similar experiments conducted on different lung and breast cancer cell lines. Growth data obtained via multichannel live microscopy and automated image analysis. We acquired 4 visual fields per well/per replicate/per timepoint. Viability was determined by propidium iodide incorporation in non-viable cells. Data are represented as mean +/− SD (g-j) and were analyzed using Student’s t-test (g-i).
Extended Data Fig. 2
Extended Data Fig. 2. Cell cooperation emerges from the extracellular digestion of oligopeptides.
a-c. High density cultures of A375 cells expressing H2B-YFP were grown on Gln, Ala-Gln, or without a glutamine source (-Gln) and treated with different inhibitors including dipeptide transporter (PEPT1/2) inhibitors (a, b), and a vesicle trafficking inhibitor (Vacuolin-1, c). d. High density cultures of A375 cells expressing H2B-YFP were grown on Gln or Ala-Gln, and then treated with DMSO (control), or inhibitors for macropinocytosis (EIPA), and autophagy (3-MA). e. Low doses of amino acid transporter inhibitors, prevent growth in low glutamine levels. Ben-Ser: and O-benzyl-L-serine. GPNA: L-γ-glutamyl-p-nitroanilide. f. The utilization of glutamine-containing peptides was prevented by amino acid transporter inhibitors. g. Estimation of Michaelis-Menten half saturation constant (KM) for glutamine utilization. Dots: experimental data. Line: model using KM = 200 µM. Schematic representation of the proposed mechanism of the cooperative utilization of extracellular oligopeptides. h. Sparse cultures of KP cells were cultured on conditioned media collected from high-density populations grown in Ala-Gln for 24 h. Fresh media had the same formulation than conditioned media but were incubated without cells. i. Sparse culture of A375 cells grown in media conditioned by a variety of human and mouse cell lines. j. Growth of sparse A375 populations grew in Ala-Gln and supplemented with conditioned media (CM). Complete CM was separated into a low and high molecular weight (MW) fractions. k. Growth rates for cells supplemented with dipeptides with and without glutamine. Dipeptide sequences shown using their one-letter code. Data presented as boxplots showing the 25th and 75th percentiles (box), and 5th and 95th percentiles (lines). b-k. Data obtained via multichannel live microscopy and automated image analysis. We acquired 4 visual fields per well/per replicate/per timepoint. Viability was determined by propidium iodide incorporation by non-viable cells. Data are represented as mean +/− SD (b-f, i) and were analyzed using Student’s t-test (b, d, h, j).
Extended Data Fig. 3
Extended Data Fig. 3. The cooperative cleavage of extracellular oligopeptides is mediated by a secreted aminopeptidase.
a. Cell number relative to initial population size for different human and mouse tumor cell lines. In all cells, bestatin inhibited growth on Ala-Gln, but growth was rescued by the addition of free glutamine. Dots correspond to data from individual replicates imaged at 4 different visual fields. b. Similar to (a) but for non-malignant immortalized cell lines. c. Similar to (b) but for primary bone marrow-derived macrophages. d. High levels of free glutamine were detected in conditioned media from cells grown with 2 mM of Ala-Gln but not when cells were treated with bestatin. e. Cells from freshly resected tumors were cultured in Matrigel for tumor organoid formation. Cultures were then supplemented with Gln, Ala-Gln, or with neither (-Gln). After 14 days, we imaged these cultures using propidium iodide (PI) incorporation to detect non-viable cells. Dot plots (right) show area of individual tumor organoid colonies automatically detected through H2B-YFP signal and were analyzed using Student’s t-test. Numbers on bottom show total colonies detected in each condition. Scale bars: 2 mm. f. Similar to (a) but for A375 and KP cells starved of Leucine. Ala-Leu can rescue growth, but this effect is inhibited by bestatin. g. Similar to (f) but A375 cells were starved of Phenylalanine or Leucine which can be rescued by Ala-Phe or Leu-Leu, respectively. This rescue is inhibited by bestatin. h. Similar to (a) but for KP KEAP1 cells starved of Gln or of Glycine and Serine. These cells require high levels of exogenous sources of these amino acids. Ala-Gly (AG) and Ala-Ser (AS) rescued the growth of starved cells. Dots correspond to data from individual replicates imaged at 4 different visual fields. i. Growth of isogenic cells with or without Keap1 mutations. Keap1 KO cells rely more on cooperation (higher Allee Threshold, NA) under different levels of glutamine. For a-d, f and h, data are represented as mean +/− SD of at least 3 biological replicates.
Extended Data Fig. 4
Extended Data Fig. 4. Identification of CNDP2 as the key aminopeptidase in the catabolism of extracellular peptides.
a. qPCR data quantifying mRNA expression levels of main aminopeptidases relative to actin. b. We synthetized several PEGylated bestatin analogues. We targeted the carbonyl sites away from the α-amine that interacts with aminopeptidases. c. Conditioned media fractionation shows that protein fraction (High molecular weight, High MW) retains the catalytic activity of secreted peptidases. We detected high levels of glutamine after incubation of this fraction with Ala-Gln for 24 h. This activity was inhibited by bestatin or heat inactivation. d. Growth of sparse cell culture showing that High MW fraction of conditioned media, incubated with Ala-Gln, can rescue cell growth. e. Growth of KO lines grown in Gln or Ala-Gln targeting peptidases identified in the proteomic analysis of conditioned media. Mutations were generated using CRISPR/Cas9 sgRNAs. f. Western blot analyses and relative growth curves of different Cndp2-WT/KO for isogenic cell pairs. g. Tumor organoid formation in Cndp2-WT and KO cells embedded in Matrigel. Cultures were supplemented with Gln or Ala-Gln. After 14 days, cultures were imaged and the area of individual tumor organoid colonies was automatically detected through H2B-YFP signal. Numbers on top show total colonies detected in each condition. h. Western Blots showing CNDP2 levels in WT, KO, with or without the re-expression of CNDP2. The strong activity of the CMV promoter causes CNDP2 overexpression even on KO parentals i. Overexpression of CNDP2 reduces the dependency on cooperation dramatically lowering the Allee threshold (NA, orange triangles). j. CNDP2 is detectable in extracellular fluids of mice including plasma and BALF. Each lane is a sample from a different tumor-bearing mice. k. Viability of WT and Cndp2-KO cells during conditioned media production. l. Estimated Ala-Gln levels in media and cell lysates after 24 h of growth in media supplemented with this dipeptide. Despite not being able to cleave Ala-Gln, Cndp2-KO cells do not show intracellular levels of this dipeptide indicating these cells do not uptake this dipeptide. Data represented as boxplots showing the 25th and 75th percentiles (box), and 5th and 95th percentiles (lines) of 3 biological replicates. m. Dose response of Cndp2-KO cells to different levels of extracellular recombinant CNDP2 (rCNDP2). Gray area shows rCNDP2 levels used in our experiments. n. Lung KP Cndp2-KO cells cannot cooperate as their conditioned media does not stimulate growth in sparse cultures of Cndp2-WT cells. Conditioned media was collected from high-density populations of Cndp2-WT (green) or Cndp2-KO (purple) cells grown in Ala-Gln for 24 h. Data points depict averages from replicates imaged at 4 different visual fields. o. CNDP2 is also involved in glutathione metabolism and in the formation of the pseudopeptide Lac-Phe. However, neither the addition of Lac-Phe, or oxidized (GSSG), or reduced (GSH) glutathione rescued the growth of Cndp2-KO cells. p. CNDP2 levels do not have a clear impact on PI3K/AKT/mTOR signaling. Data are represented as mean +/− SD and representative of at least 3 biological replicates (c, f, o). Data were compared using Student’s t-test (c-g, l, n-o). For gel source data (f, I, j, p), see Supplementary Fig. 1.
Extended Data Fig. 5
Extended Data Fig. 5. Loss of CNDP2 reduces tumor growth in vivo.
a. Analysis of patient data from the Pan Cancer Atlas from the TCGA database showing the kind and frequency of cancer-associated CNDP2 mutations. b. Left: Overall survival Kaplan–Meier plot comparing patients CNDP2 mRNA levels above versus below the median. Right: Disease free and overall survival Kaplan–Meier plots for Lung Adenocarcinoma patients (TCGA). CNDP2 high: Copy number alterations (amplification and gains) and expression higher than 3 standard deviations above the mean. Patients with shallow CNDP2 loss were excluded from analysis. c. TCGA data from 503 samples from lung adenocarcinoma patients were queried for mutual exclusivity and co-occurrence between KEAP1 loss-of-function (LOF) and CNDP2 gain-of-function (GOF) genomic and transcriptional alterations. Text below shows Onco Query Language used to define LOF and GOF alterations. d. Kaplan-Meier survival plots for patients from the same database as in (c). Patients were stratified according to their Keap1 and CNDP2 alteration status. The number of patients per condition is stated in the figure. e. GC/MS analysis of serum in mice fed with a control (Control) or on a glycine- and serine-depleted diet (-Gly/Ser). Confirming numerous prior reports, this diet decreases circulating levels of several amino acids including Gly and Ser. n = 4 mice per condition. f. Effect of bestatin in Lung KP tumors (Keap1 WT). B6 mice were placed on a control (Control) or on a glycine- and serine-depleted diet (-Gly/Ser) and injected with 5 × 10⁴ syngeneic KP lung adenocarcinoma cells. Mice were then treated with daily injections of bestatin or PBS for 10 days and tumor growth was monitored for additional 2–3 weeks. Plots show tumor volume over time. Lines show trajectories of individual tumors. p-values estimated using two-tailed t student test. g. Weights of mice (n = 4 mice per condition) fed with the -Gly/Ser or control diets and treated with daily bestatin or PBS injections. Lines connect weights for the same mice on days 1 and 18 of the experiment. h. Bronchoalveolar lavages (BALF) from tumor-bearing mice were collected. Samples were divided into two and we measured Gln levels before or after adding recombinant CNDP2 for 1 h. Data from 4 mice per condition are presented as boxplots showing the 25th and 75th percentiles (box), and 5th and 95th percentiles (lines). i. Immunofluorescence of chimeric CNDP2 with different signal peptides (n = 2 biological replicates with similar results). Secreted form of CNDP2 was almost undetectable inside cells but was detectable after using Brefeldin A to inhibit the secretory pathway. Scale bars: 50 µm. For panel g data were compared using Student’s t-test. Statistics from panel c were obtained using the cBio portal (www.cbioportal.org).
Extended Data Fig. 6
Extended Data Fig. 6. Cooperation is a feature of thriving tumor clones in vivo.
a. Growth rates for CNDP2 WT labeled with H2B-mCherry or H2B-YFP showing fluorophores have no differential effect on growth. Data representative of at least 3 biological replicates and presented as boxplots showing the 25th and 75th percentiles (box), and 5th and 95th percentiles (lines). b. Relative growth curves for CNDP2 WT (cooperators) and CNDP2 KO (non-cooperators) cultured together or alone in Ala-Gln. c. Cell number over time for WT-mCherry:WT-YFP (top) or WT-mCherry:KO-YFP (bottom) grown in Gln (left) or in (Ala-Gln). Gray dots show points where cultures were passaged. d. Relative fitness for cooperators and non-cooperators seeded at different initial ratios and grown in Ala-Gln or in free Gln. e. Representative example showing that the growth rate benefit of non-cooperators is greater when they are located next to cooperators. Scale bars: 200 μm. f. When seeded at 1:1 and grown in Ala-Gln, cooperators form clonal patches, but non-cooperators do not. To quantify this effect, we located each cell and then found its closest neighboring clones. Images on the right show the space between neighbors color-coded by its area. Note that in between cooperators there are either small spaces (cells within the same patch, blue triangles) or large areas (cells from different patches, yellow triangles). In contrast non-cooperators have a more intermediate size areas (green triangles) denoting a more random distribution. Scale bars: 250 μm. g. Typical distance between neighboring clones. In all conditions that form patterns this value drops quickly. In non-cooperators growing in Ala-Gln more cells are at intermediate distances. h. Cooperators and non-cooperators seeded at 1:10 ratio and grown in the MEMIC, a culture system where nutrients levels gradually decrease from left to right. Images were taken after 1 week of co- culture. Scale bar: 200 µm. Magnified regions illustrate that despite being a minority, cooperator numbers do not decrease along the MEMIC while non-cooperators become sparser. Note that all groups of non-cooperators seem to contain at least one sustaining cooperator. i. Left: Mice were placed on a low amino acid diet (-Gly/Ser) and injected with 2 × 10⁴ syngeneic lung adenocarcinoma KP cells wildtype, KO for CNDP2 or a 1:1 mix of both. Lines and dots show tumor volume over time for individual mice. Right: Final tumor volumes. Note that final volume of mix tumors is similar to WT tumors. Data representative from 4 mice per condition presented as boxplots showing the 25th and 75th percentiles (box), and 5th and 95th percentiles (lines). j. Mice were injected with 104 cooperator-mCherry cells mixed with 104 cooperators- or non-cooperators-YFP. Tumors were collected at different time points and analyzed via flow cytometry. Representative scatter plots from one mouse per timepoint are shown. Note the disappearing YFP positive population in cooperators/non-cooperators competitions (purple box). k. Immunofluorescence image of a tumor section (representative image from n = 4 mice with similar results). Using image analysis, we were able to assign a WT or KO identity to ~95% of the cells. Remaining ~5% showed no fluorescence or similar levels of YFP and mCherry. Note that WT cells dominate over the entire tumor. Scale bars: 100 μm. For panels a-b, d, g, i, data were analyzed using Student’s t-test.

References

    1. Nowell, P. C. The clonal evolution of tumor cell populations. Science194, 23–28 (1976). - PubMed
    1. Greaves, M. & Maley, C. C. Clonal evolution in cancer. Nature481, 306–313 (2012). - PMC - PubMed
    1. Archetti, M. & Pienta, K. J. Cooperation among cancer cells: applying game theory to cancer. Nat. Rev. Cancer19, 110–117 (2018). - PMC - PubMed
    1. Axelrod, R., Axelrod, D. E. & Pienta, K. J. Evolution of cooperation among tumor cells. Proc. Natl Acad. Sci. USA103, 13474–13479 (2006). - PMC - PubMed
    1. Dai, L., Vorselen, D., Korolev, K. S. & Gore, J. Generic indicators for loss of resilience before a tipping point leading to population collapse. Science336, 1175–1177 (2012). - PubMed