. 2025 Mar;639(8056):1060-1068.
doi: 10.1038/s41586-024-08579-3. Epub 2025 Feb 19.

GABAergic neuron-to-glioma synapses in diffuse midline gliomas

Affiliations

GABAergic neuron-to-glioma synapses in diffuse midline gliomas

Tara Barron et al. Nature. 2025 Mar.

Abstract

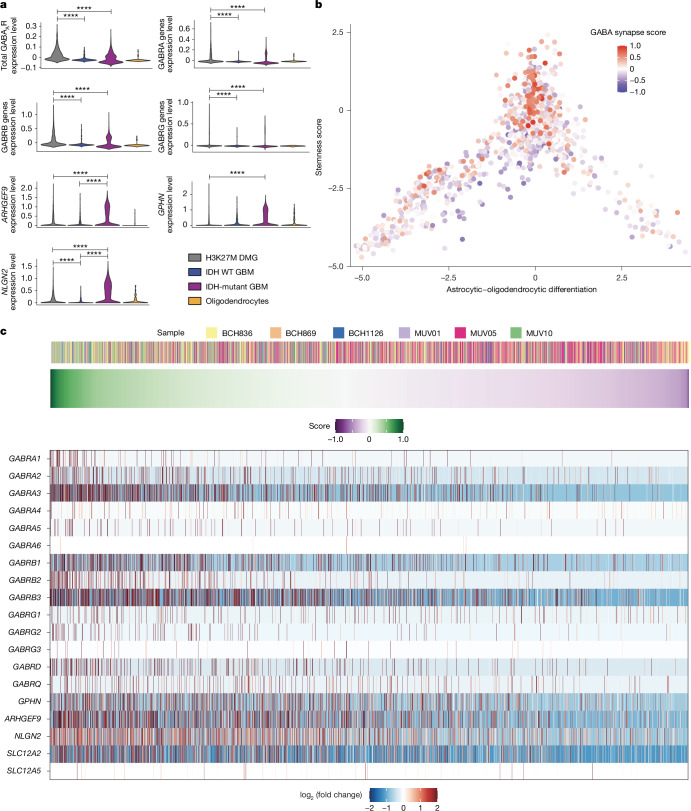
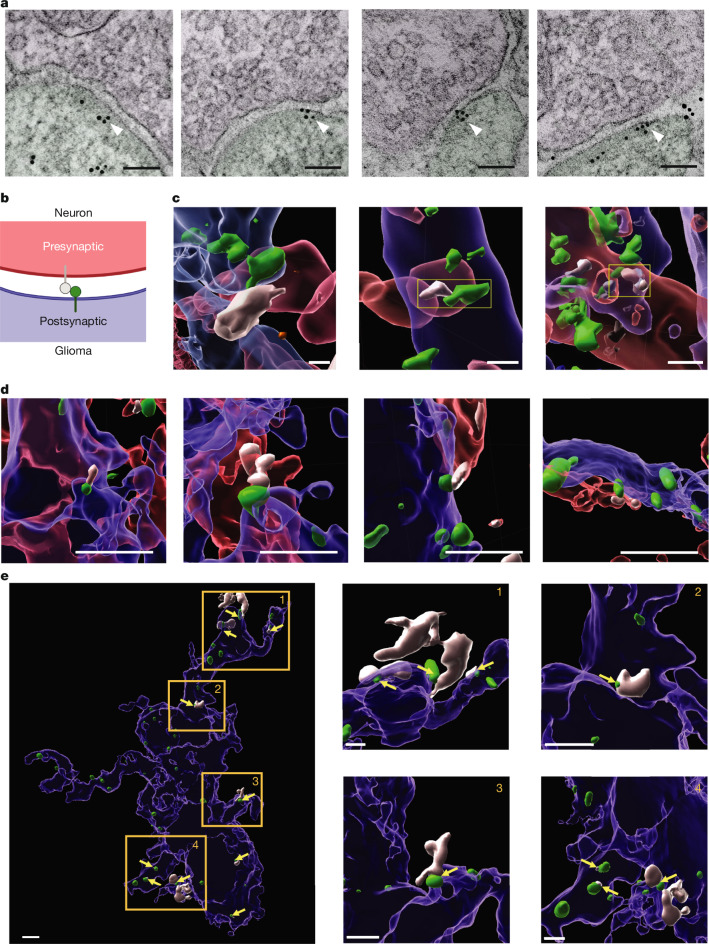
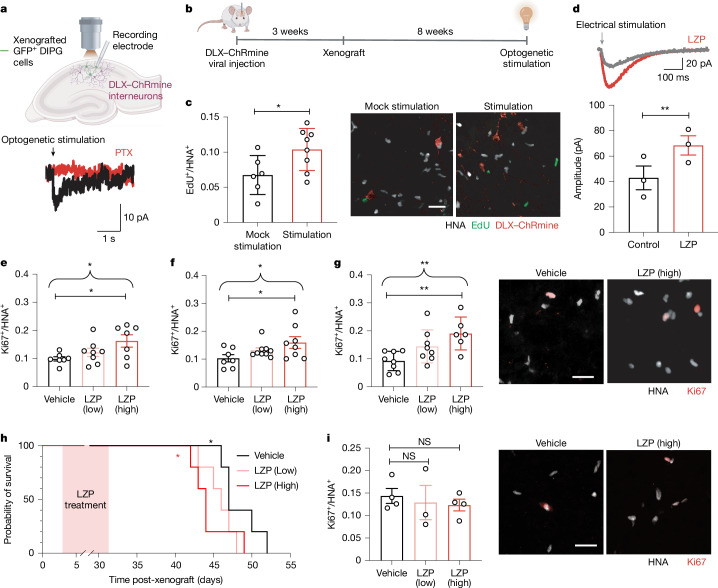
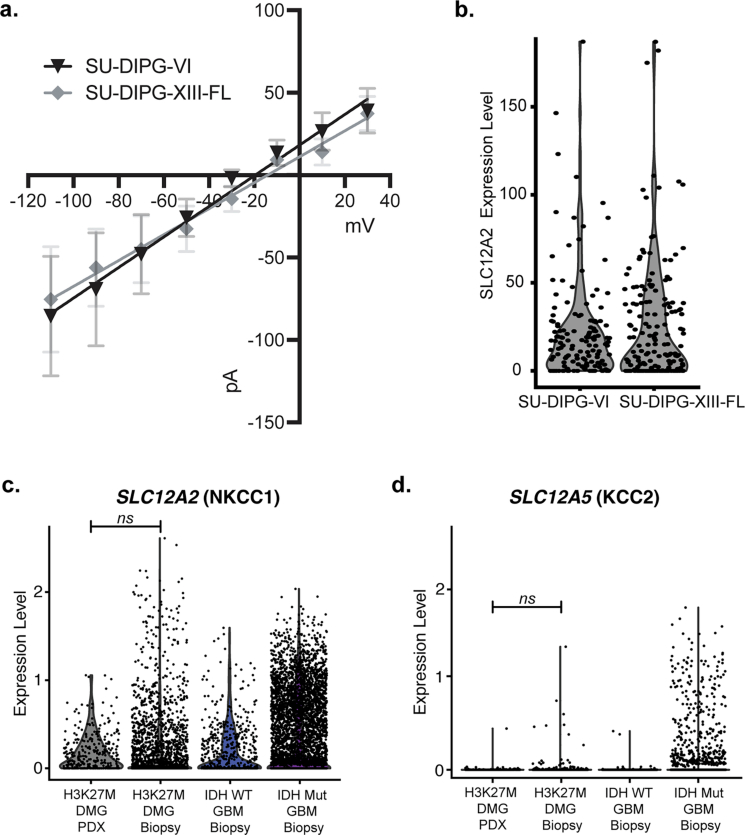
High-grade gliomas (HGGs) are the leading cause of brain cancer-related death. HGGs include clinically, anatomically and molecularly distinct subtypes that stratify into diffuse midline gliomas (DMGs), such as H3K27M-altered diffuse intrinsic pontine glioma, and hemispheric HGGs, such as IDH wild-type glioblastoma. Neuronal activity drives glioma progression through paracrine signalling1,2 and neuron-to-glioma synapses3-6. Glutamatergic AMPA receptor-dependent synapses between neurons and glioma cells have been demonstrated in paediatric3 and adult4 high-grade gliomas, and early work has suggested heterogeneous glioma GABAergic responses7. However, neuron-to-glioma synapses mediated by neurotransmitters other than glutamate remain understudied. Using whole-cell patch-clamp electrophysiology, in vivo optogenetics and patient-derived orthotopic xenograft models, we identified functional, tumour-promoting GABAergic neuron-to-glioma synapses mediated by GABAA receptors in DMGs. GABAergic input has a depolarizing effect on DMG cells due to NKCC1 chloride transporter function and consequently elevated intracellular chloride concentration in DMG malignant cells. As membrane depolarization increases glioma proliferation3,6, we found that the activity of GABAergic interneurons promotes DMG proliferation in vivo. The benzodiazepine lorazepam enhances GABA-mediated signalling, increases glioma proliferation and growth, and shortens survival in DMG patient-derived orthotopic xenograft models. By contrast, only minimal depolarizing GABAergic currents were found in hemispheric HGGs and lorazepam did not influence the growth rate of hemispheric glioblastoma xenografts. Together, these findings uncover growth-promoting GABAergic synaptic communication between GABAergic neurons and H3K27M-altered DMG cells, underscoring a tumour subtype-specific mechanism of brain cancer neurophysiology.


Conflict of interest statement

Competing interests: M.M. holds equity in MapLight Therapeutics and Stellaromics, and stock in CARGO Therapeutics. The other authors declare no competing interests.

Figures

Fig. 1
Fig. 1. GABAergic synapse-related gene expression in glioma.
a, Single-cell RNA-seq analysis of malignant cells from primary human biopsies of H3K27M+ DMG (grey; n = 2,259 cells, 6 study participants), IDH WT high-grade glioma (IDH WT GBM; blue; n = 599 cells, 3 participants) and IDH-mutant high-grade glioma (IDH-mutant GBM; purple; n = 5,096 cells, 10 participants) malignant cells, and tumour-associated, non-malignant oligodendrocytes (yellow; n = 232 cells),, demonstrating expression of total GABAAR subunit genes, α-subunit genes, β-subunit genes, γ-subunit genes and postsynaptic genes specific to GABAergic synapses. Statistical analyses performed on single cells are represented with asterisks only when also significant when analysed on a per-patient basis as well as a per-cell basis (****P < 2.2 × 10−16 for all asterisk comparisons). Comparisons to oligodendrocytes (control cell type) are not shown. Two-tailed Wilcoxon rank-sum test. b, Plot of lineage score (astrocytic–oligodendrocytic differentiation) and stemness score from single-cell RNA-seq analysis of H3K27M+ DMG malignant single cells sorted from primary biopsies (n = 2,259 cells, 6 study participants). The red–blue colour overlay indicates the relative score for GABAergic synapse-related genes. c, GABAergic synapse-related relative gene expression in H3K27M+ DMG malignant cells from primary biopsies. Cells are annotated according to patient sample (top) and are sorted from left to right based on their GABA synapse-related gene expression score, as indicated by the green-to-purple gradient (middle); a heatmap of expression of individual GABAergic synapse-related genes in each DMG cell is also shown (bottom).
Fig. 2
Fig. 2. Structural GABAergic neuron-to-glioma synapses in DMG.
a, Immuno-electron microscopy of SU-DIPG-VI cells with GFP-tagged GABRG2 xenografted into the mouse hippocampus. The white arrowheads denote immunogold labelling of GFP (glioma GABRG2). Presynaptic neurons are shaded purple, and glioma cells are shaded green. Scale bars, 100 nm. n = 39 synapses identified from 4 mice. b, Schematic of colours representing structures in GABAergic neuron-to-glioma synapses imaged in panels c,d, including neurons (red), gliomas (blue), presynaptic puncta (white) and postsynaptic puncta (green). The schematic was created using BioRender (https://biorender.com). c, Representative confocal micrograph 3D reconstructions of GABAergic neuron-to-glioma synaptic puncta in neuron–glioma co-cultures. Patient-derived DMG cells (SU-DIPG-XIII-FL; nestin in blue) expressing GABRG2–GFP (postsynaptic marker in green) colocalize with the presynaptic marker synapsin (white) on rat hippocampal neurons (neurofilament in red). Scale bars, 2 µm. d, Representative confocal micrograph 3D reconstructions of GABAergic neuron-to-glioma synaptic puncta in patient-derived xenografts. Postsynaptic gephyrin (green) on GFP-expressing patient-derived DMG cells (SU-DIPG-XIII-FL; GFP in blue) colocalizes with the presynaptic marker VGAT (white) on neurons (DLX–mCherry in red) in the mouse hippocampus. Scale bars, 2 µm. e, Representative confocal micrograph 3D reconstruction of a glioma cell (blue) with several gephyrin puncta (green) colocalized with presynaptic VGAT puncta (white). Colocalized puncta are indicated with yellow arrows and some examples are highlighted in yellow boxes. Scale bars, 2 µm.
Fig. 3
Fig. 3. Depolarizing GABAergic neuron-to-glioma synapses in DMG.
a, Schematic depicting the electrophysiological recording of DMG cells xenografted into hippocampal CA1 in response to local stimulation. The schematic was created using BioRender (https://biorender.com). b, Representative traces (grey) of currents elicited by electrical stimulation in the presence of NBQX in two patient-derived DMG xenografts (SU-DIPG-VI and SU-DIPG-XIII-FL). c, Xenografted DMG (SU-DIPG-VI) cell dye filled (Alexa 568; red) during recording and co-labelled with GFP (green) and human nuclear antigen (HNA; white) post-recording. Scale bar, 10 µm. n = 5 biological replicates. d, Representative voltage-clamp trace of a tetrodotoxin (TTX; red)-sensitive DMG (SU-DIPG-VI) cell current in the presence of NBQX (grey). e, Representative trace of stimulation-evoked voltage change in a DMG (SU-DIPG-VI) cell in the presence of NBQX (grey) using current clamp at −70 mV. f, Representative voltage-clamp trace of the picrotoxin (PTX; red)-sensitive GABAergic postsynaptic current (PSC) in a DMG (SU-DIPG-VI) cell in the presence of NBQX (grey; left), and quantification of the current amplitude (right; n = 7 cells from 5 mice; P = 0.0341). Paired two-tailed Student’s t-test. g, Representative voltage-clamp trace of GABAergic PSC in a DMG (SU-DIPG-VI) cell with NBQX + D-AP5 (grey) and bicuculline (Bic; red; left), or no inhibitors (black trace), and quantification of the current amplitude (right; n = 5 cells from 3 mice; P = 0.1787 (control versus D-AP5), P = 0.1093 (control versus NBQX) and P = 0.0287 (control versus Bic)). Repeated measures one-way ANOVA with Dunnett’s post-hoc test. h, Representative voltage-clamp trace of a DMG (SU-DIPG-VI) cell response to stimulation demonstrating Bic-sensitive GABAergic PSC (left) and NBQX-sensitive glutamatergic PSC in the same DMG cell (right). Red trace, in the presence of Bic; grey trace, in the presence of NBQX; black trace, no inhibitors. i,j, Representative traces of perforated patch recordings from xenografted patient-derived DMG (SU-DIPG-VI) and hemispheric high-grade glioma (SU-pcGBM-2) cells in voltage clamp (i) and current clamp (j) in response to GABA. Black traces, H3K27M+ DMG with no inhibitors; red traces, H3K27M+ DMG in the presence of PTX; blue traces, hemispheric high-grade glioma. k, GABA current–voltage relationship of perforated patch recordings in DMG cells (SU-DIPG-VI; black; n = 6 cells from 5 mice) and H3/IDH WT hemispheric high-grade glioma cells (SU-pcGBM-2; blue; n = 6 cells from 5 mice), and whole-cell patch with high internal Cl concentration in DMG cells (SU-DIPG-VI; grey; n = 4 cells from 4 mice). Representative traces of a DMG cell response to GABA at membrane potentials from −70 mV to +30 mV are also shown (inset). l, GABA current–voltage relationship of perforated patch recordings in DMG (SU-DIPG-VI) cells with no inhibitor (black) or in the presence of 100 μM bumetanide (red; n = 5 cells from 3 mice). Representative traces of membrane potentials from −70 mV to +10 mV with bumetanide are also shown (inset). m, GABA current–voltage relationship in DMG (SU-DIPG-VI) cells in whole-cell patch clamp with low internal Cl concentration (negative Cl load) in the presence (red) or absence (black) of 10 µM bumetanide (n = 5 cells from 3 mice). n, Representative voltage-clamp trace of the GABA current in DMG (SU-DIPG-VI) cells at membrane potentials from −70 mV to +10 mV under negative Cl load conditions. o, Representative time course of bumetanide (10 µM) effect on GABA current in DMG (SU-DIPG-VI) cells at −70 mV under negative Cl load conditions. Dashed line indicates baseline amplitude before addition of bumetanide. All data are mean ± s.e.m. NS, not significant, *P < 0.05. Source Data
Fig. 4
Fig. 4. GABAergic signalling drives DMG proliferation.
a, Electrophysiological recording of DMG cells xenografted into hippocampal CA1 in response to optogenetic stimulation of interneurons (top), and PTX-sensitive glioma current in response to optogenetic stimulation of GABAergic interneurons (bottom). The diagram was created using BioRender (https://biorender.com). b, In vivo optogenetic stimulation of DLX–ChRmine interneurons near xenografted DMG cells in the CA1 region of the hippocampus. The illustrations were created using BioRender (https://biorender.com). c, Proliferation index (EdU+/HNA+ cells) after optogenetic stimulation or mock stimulation (n = 6 mice; stimulation, n = 8 mice, P = 0.0075; two-tailed Student’s t-test; left), and representative images of DLX–ChRmine interneurons (red) near xenografted DMG cells expressing EdU (green) and HNA (white; right). Scale bar, 25 µm. d, Representative trace of GABAergic PSC in DMG elicited by electrical stimulation in the presence of NBQX before and after perfusion of 10 μM lorazepam (LZP; top), and quantification of current amplitude (n = 3 cells from 3 mice; P = 0.0386, two-tailed paired Student’s t-test; right). eg, H3K27M+ diffuse midline glioma: dose-dependent (2 mg kg−1 (low) and 8 mg kg−1 (high)) effect of LZP treatment in mice with patient-derived DMG xenografts, SU-DIPG-XIII-FL (n = 7 mice (vehicle), n = 8 mice (low) and n = 7 mice (high); P = 0.0374 (e)), SU-DIPG-50 (n = 7 mice (vehicle), n = 9 mice (low) and n = 8 mice (high); P = 0.0573 (f)) and SU-DIPG-VI (n = 8 mice (vehicle), n = 8 mice (low) and n = 6 mice (high); P = 0.0075 (g); one-way ANOVA). The straight brackets denote Dunnett’s multiple comparisons test between two groups (vehicle versus high: P = 0.0228 (e), P = 0.033 (f) and P = 0.0041 (g)). The curved brackets denote a post-test for linear contrast among all groups (P = 0.0124 (e), P = 0.0181 (f) and P = 0.002 (g)). Representative images of xenografted SU-DIPG-VI cells in the pons expressing Ki67 (red) and HNA (white) are also shown (g, right). Scale bar, 25 µm. h, Kaplan–Meier survival curves of mice xenografted with patient-derived DMG cells (SU-DIPG-XIII-pons) and treated with LZP or vehicle (n = 5 mice per group), demonstrating a significant reduction in survival in mice treated with a high dose of LZP (red asterisk; P = 0.0495, Mantel–Cox test), and a dose-dependent reduction in survival (black asterisk; P = 0.0320, log-rank test for trend). i, Hemispheric high-grade glioma: LZP treatment in mice with patient-derived pcGBM (SU-pcGBM2) xenografts (n = 4 mice (vehicle), n = 3 mice (low) and n = 4 mice (high); left), and representative images of xenografted SU-pcGBM2 cells expressing Ki67 (red) and HNA (white; right). Scale bar, 25 µm. One-way ANOVA. All data are mean ± s.e.m. *P < 0.05 and **P < 0.01. Source Data
Extended Data Fig. 1
Extended Data Fig. 1. GABAA subunit expression patterns in gliomas.
Single cell RNAseq analysis illustrating expression of GABAA subunit genes in patient-derived DMG xenografts (grey; n = 335 cells, 4 mice) and primary human biopsies of H3K27M+ diffuse midline glioma (DMG; grey; n = 2,259 cells, 6 study participants), IDH-wild-type (WT) high-grade glioma (GBM; blue; n = 599 cells, 3 participants), and IDH-mutant (mut) high-grade glioma (GBM; purple; n = 5,096 cells, 10 participants) malignant cells,.
Extended Data Fig. 2
Extended Data Fig. 2. Inter- and intra-patient heterogeneity of GABAergic synapse-related gene expression.
UMAP of H3K27M+ DMG malignant cells from primary biopsies, colored once by sample (left) and once by GABA synapse-related gene score (red to blue, right).
Extended Data Fig. 3
Extended Data Fig. 3. DMG infiltration of human hippocampus and immuno-electron micrographs of GABAergic neuron-to-glioma synapses in hippocampal DMG xenografts.
a. DMG infiltration of human hippocampus. 10x magnification light microscopy image of primary patient tissue with H3K27M+ DMG cells (brown) in the CA1 region of the hippocampus. Hematoxylin counterstain. DMG infiltration of hippocampus is not uncommon, as this case of a 14-year-old female with H3K27M-mutated DMG, also called diffuse intrinsic pontine glioma (DIPG), illustrates. Patient sample taken at time of autopsy. Scale bar, 100 µm. b-c. Immuno-electron microscopy of SU-DIPG-VI (n = 39 synapses identified from 4 mice, b) and SU-DIPGXIII-FL (n = 97 synapses identified from 3 mice, c) cells with GFP-tagged GABRG2 xenografted into mouse hippocampus. Six examples of GABAergic neuron-to-glioma synapses are shown here, in addition to those shown in Fig. 2a. Scale bar, 100 nm. d. Secondary-only control for immuno-electron microscopy of SU-DIPGXIII-FL with GFP-tagged GABRG2 xenografted into mouse hippocampus to demonstrate low background immuno-gold labelling. Scale bar, 1000 nm. n = 7 biological replicates.
Extended Data Fig. 4
Extended Data Fig. 4. GABAergic neuron-to-glioma synaptic puncta imaging and 3D reconstruction.
a. 3-dimensional (3D) reconstruction shown in Fig. 2c and associated zoomed-out confocal images of GABAergic neuron-to-glioma synaptic puncta in neuron-glioma co-cultures. H3K27M+ DMG cells (SU-DIPGXIII-FL, nestin, blue) expressing GARBRG2-GFP (green, post-synaptic) co-localizes with synapsin (white, pre-synaptic) on rat hippocampal neurons (neurofilament, red). Scale bars, 2 µm. b. Zoomed-out 3-dimensional (3D) reconstructions and zoomed-in 3D reconstructions (as shown in Fig. 2d,e) with associated confocal images of GABAergic neuron-to-glioma synaptic puncta in patient-derived DMG xenografts in the mouse hippocampus. Gephyrin (green) on GFP-expressing DMG cells (SU-DIPGXIII-FL, GFP,blue) co-localizes with VGAT (white) on neurons (DLX-mCherry, red). Scale bars, 2 µm. Top left, quantification of co-localized synaptic puncta as a percent of total gephyrin puncta on glioma cells (n = 4 mice). Select colocalized puncta are indicated with yellow arrows, and some examples are highlighted in yellow boxes. Please note that several 3D-reconstructed images from Fig. 2 are shown again here to provide additional spatial and contextual information. All data are mean ± s.e.m. Source Data
Extended Data Fig. 5
Extended Data Fig. 5. Cl transporter expression in patient-derived xenografts of H3K27M + DMG.
a. Current-voltage relationship of GABA current in two patient-derived DMG xenograft models recorded with perforated patch. Reversal potential of GABA was −25.0 ± 3.7 mV in SU-DIPGVI cells (n = 6 cells from 5 mice), and −20.7 ± 4.9 mV in SU-DIPGXIII-FL cells (n = 5 cells from 3 mice). b. Single cell RNAseq analysis of SLC12A2 (NKCC1) in two DMG patient-derived xenografts (PDX). c,d. Single cell RNAseq analysis illustrating expression of SLC12A2 (NKCC1; c) and SLC12A5 (KCC2; d) in patient-derived DMG xenografts (grey; n = 335 cells, 4 mice) and primary human biopsies of H3K27M+ diffuse midline glioma (grey; n = 2,259 cells, 6 study participants), IDH-wild-type high-grade glioma (IDH WT GBM; blue; n = 599 cells, 3 participants), and IDH-mutant high-grade glioma (IDH-mut GBM; purple; n = 5,096 cells, 10 participants) malignant cells,. Two-tailed Wilcoxon Rank Sum test. All data are mean ± s.e.m. ns, not significant. Source Data
Extended Data Fig. 6
Extended Data Fig. 6. Optogenetic stimulation of GABAergic interneurons expressing DLX-ChRmine.
a. Immunostaining and representative confocal micrographs of DLX-ChRmine (red) expression colocalized with GAD65 (green) and/or GAD67 (white). Arrows indicate co-labelled interneurons. Scale bar, 100 µm. b. Inward current and corresponding depolarization of GABAergic interneurons expressing DLX-ChRmine in response to optogenetic stimulation were recorded using patch clamp electrophysiology. c. Unbiased stereological quantification of GAD67+ interneurons in tumor-affected frontal cortex and contralateral control frontal cortex of mice bearing patient-derived DMG xenografts, SU-DIPGVI (n = 4 mice, p = 0.1147) and SU-DIPGXIII-FL (n = 3 mice, p = 0.829). Paired two-tailed student’s t-test. Right, representative confocal images of GAD67+ interneurons (white, arrows) near H3K37M+ DMG cells (red). Scale bar, 100 µm. d. Optogenetic stimulation of interneurons expressing DLX-ChRmine (red) induces neuronal activity, indicated by cfos expression (green). Arrows indicate co-labeled interneurons. Scale bar, 100 µm. Above, experimental timeline. Right, quantification of cfos expression in interneurons 90 min after optogenetic stimulation in the stimulated hemisphere (stim) indicates greater numbers of cfos-labeled interneurons than in the unstimulated hemisphere (unstim); n = 5 mice per group; p = 0.0078. Paired two-tailed student’s t-test. e. Optogenetic stimulation of interneurons expressing DLX-ChRmine (red) in the microenvironment of DMG xenografts increases cfos expression (white) in GFP+/HNA+ glioma cells (green). Arrows indicate co-labeled DMG cells. Scale bar, 100 µm. Above, experimental timeline. Right, quantification of cfos expression in glioma 24 h after optogenetic stimulation of interneurons in the stimulated group (stim) indicates greater numbers of cfos-labeled DMG cells than in the mock stimulated group (mock stim); n = 3 mice per group; p = 0.0264. Two-tailed student’s t-test. All data are mean ± s.e.m. *P < 0.05, **P < 0.01. The diagrams in panels b,d,e were created using BioRender (https://biorender.com). Source Data
Extended Data Fig. 7
Extended Data Fig. 7. Lorazepam promotes tumor growth in vivo but has no effect on proliferation of patient-derived DMG cells in monoculture.
a. LZP treatment of patient-derived DMG cultures SU-DIPGVI and SU-DIPGXIII-FL had no effect on malignant cell proliferation in monoculture (n = 3 wells per group). One-way ANOVA. P = 0.42 and P = 0.62, respectively. b. In vivo bioluminescent imaging (IVIS) quantification of tumor burden in mice bearing luciferase-expressing SU-DIPG-VI xenografts in the pons, treated with vehicle control or LZP (8 mg kg−1) at 14 days following the start of treatment (vehicle, n = 6 mice; LZP, n = 5 mice p = 0.0006). Data are represented as change from baseline luminescence (photon flux). Right, representative IVIS images of xenografted mice treated with LZP or vehicle control. Increased H3K27M+ DMG tumor burden is evident in the LZP-treated mice. Two-tailed Student’s t-test. All data are mean ± s.e.m. ***P < 0.001. Source Data

References

    1. Venkatesh, H. S. et al. Neuronal activity promotes glioma growth through neuroligin-3 secretion. Cell161, 803–816 (2015). - PMC - PubMed
    1. Pan, Y. et al. NF1 mutation drives neuronal activity-dependent initiation of optic glioma. Nature594, 277–282 (2021). - PMC - PubMed
    1. Venkatesh, H. S. et al. Electrical and synaptic integration of glioma into neural circuits. Nature573, 539–545 (2019). - PMC - PubMed
    1. Venkataramani, V. et al. Glutamatergic synaptic input to glioma cells drives brain tumour progression. Nature573, 532–538 (2019). - PubMed
    1. Venkataramani, V. T. K. et al. Glioblastoma hijacks neuronal mechanisms for brain invasion. Cell10.1016/j.cell.2022.06.054 (2022). - PubMed

Substances