. 2025 Mar;639(8055):754-764.
doi: 10.1038/s41586-025-08585-z. Epub 2025 Feb 19.

Human-correlated genetic models identify precision therapy for liver cancer

Affiliations

Human-correlated genetic models identify precision therapy for liver cancer

Miryam Müller et al. Nature. 2025 Mar.

Abstract

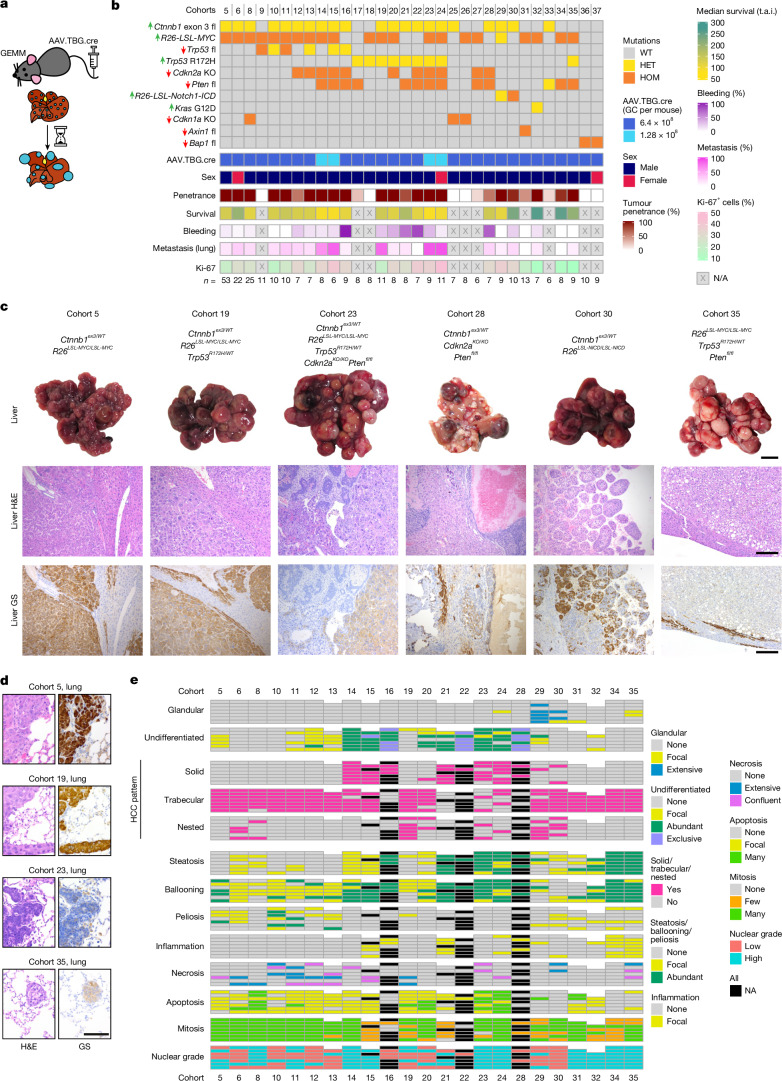
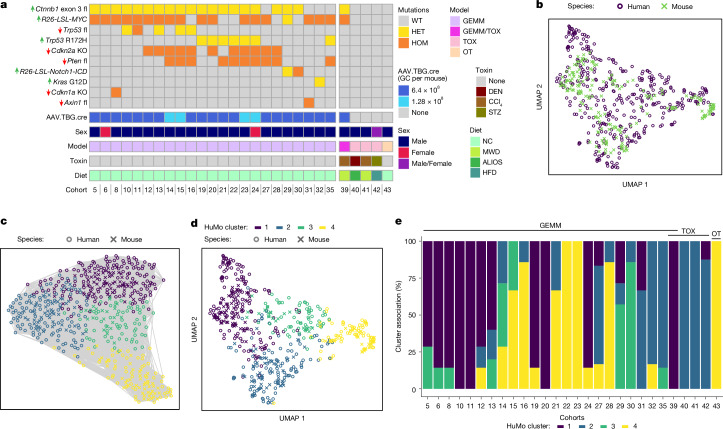
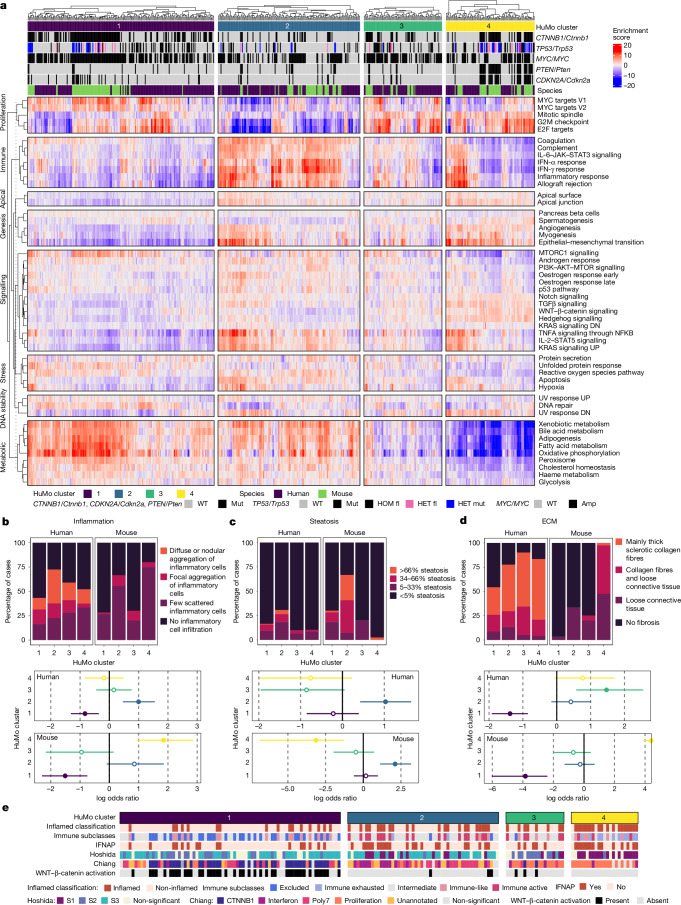
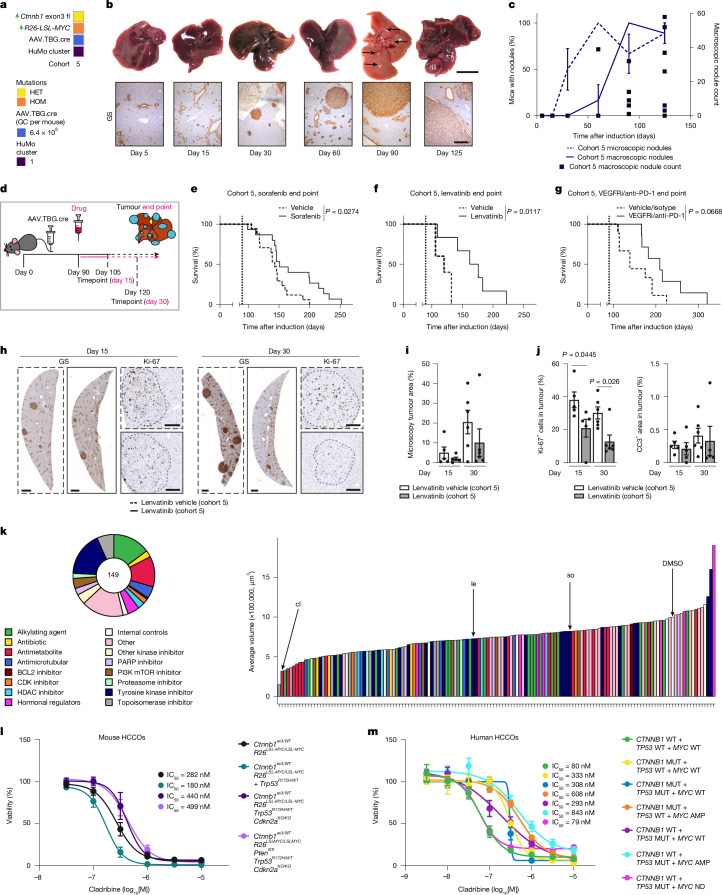
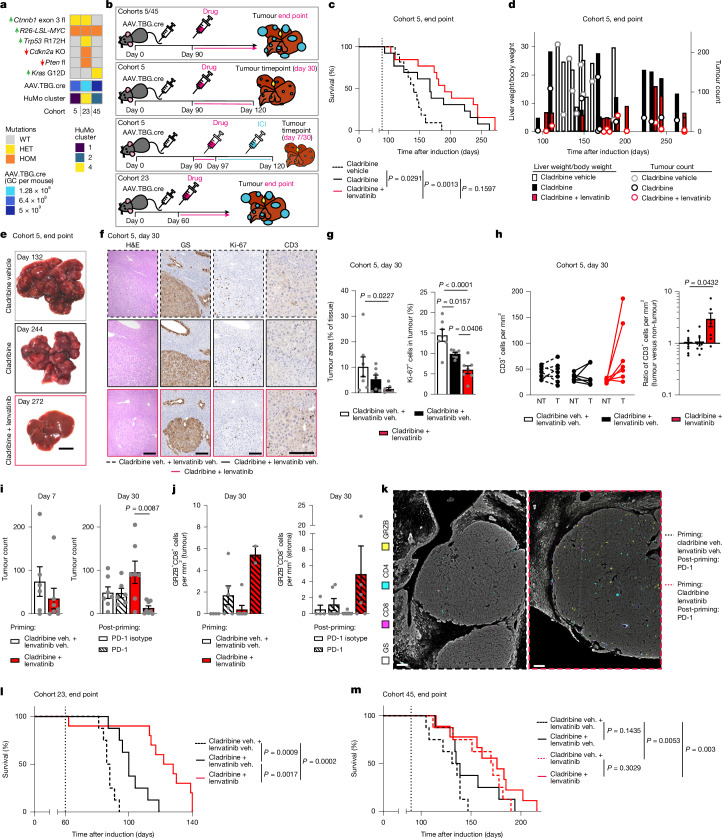
Hepatocellular carcinoma (HCC), the most common form of primary liver cancer, is a leading cause of cancer-related mortality worldwide1,2. HCC occurs typically from a background of chronic liver disease, caused by a spectrum of predisposing conditions. Tumour development is driven by the expansion of clones that accumulate progressive driver mutations3, with hepatocytes the most likely cell of origin2. However, the landscape of driver mutations in HCC is broadly independent of the underlying aetiologies4. Despite an increasing range of systemic treatment options for advanced HCC, outcomes remain heterogeneous and typically poor. Emerging data suggest that drug efficacies depend on disease aetiology and genetic alterations5,6. Exploring subtypes in preclinical models with human relevance will therefore be essential to advance precision medicine in HCC7. Here we generated a suite of genetically driven immunocompetent in vivo and matched in vitro HCC models. Our models represent multiple features of human HCC, including clonal origin, histopathological appearance and metastasis. We integrated transcriptomic data from the mouse models with human HCC data and identified four common human-mouse subtype clusters. The subtype clusters had distinct transcriptomic characteristics that aligned with the human histopathology. In a proof-of-principle analysis, we verified response to standard-of-care treatment and used a linked in vitro-in vivo pipeline to identify a promising therapeutic candidate, cladribine, that has not previously been linked to HCC treatment. Cladribine acts in a highly effective subtype-specific manner in combination with standard-of-care therapy.


Conflict of interest statement

Competing interests: Material for the lenvatinib day 15 and day 30 timepoint experiments (Fig. 4h–j) was provided by Eisai. AZD2171 was provided by AstraZeneca. D.A.M. is a director, shareholder and employee of FibroFind. L.M.C. has consulted for Ono Pharmaceuticals UK on unrelated work. J.M.L. is receiving research support from Eisai Inc and Bayer Pharmaceuticals; is consulting and performing sponsored lectures for Eisai Inc., Merck, Roche, Genentech, AstraZeneca, Bayer Pharmaceuticals, AbbVie, Sanofi, Moderna, Glycotest and Exelixis; and participates in the Data Safety Monitoring Board for Bristol Myers Squibb. The other authors declare no competing interests.

Figures

Fig. 1
Fig. 1. Comprehensive characterization of the genetic HCC mouse models.
a, Experimental scheme. Conditional genetically engineered mice induced with AAV.TBG.cre virus develop tumours after clonal recombination of genes classically associated with HCC in a TCGA study. b, Specific combinations of mutations, but not numbers of mutations, drive model-specific features such as survival, tumour proliferation (Ki-67), bleeding from tumour and metastasis in mouse models of HCC. The up arrows represent gain of function (green) and the down arrows represent loss of function (red). T.a.i., time after induction (days); HET, heterozygous; HOM, homozygous. Exact values are provided in Supplementary Table 1. c, Representative images showing that variation in macroscopic and microscopic phenotype depends on combinations of mutations. Glutamine synthetase (GS) was used as an indicator of activated CTNNB1 signalling. Scale bars, 1 cm (macroscopy) and 200 µm (microscopy). Histology for the full range of HCC GEMMs is shown in Extended Data Fig. 3. d, Representative images show lung metastases resembling the primary tumour phenotype as demonstrated by haematoxylin and eosin (H&E) and GS staining. Scale bar, 100 µm. e, Mouse HCC models present common patterns and characteristics used for identification and classification of human HCC based on in-depth histopathological examination. n = 5–7 mice per cohort as indicated by bars. Source data
Fig. 2
Fig. 2. Transcriptional alignment classifies four common human/mouse (HuMo) clusters.
a, Summary overview of mouse models used for transcriptional analysis. In addition to the GEMMs, described in Fig. 1, TOX and OT models were included. These include mice that were treated with diethylnitrosamine (DEN), carbon tetrachloride (CCl4) and streptozotocin (STZ), as well as multiple diets: modified western diet (MWD), American-lifestyle-induced obesity syndrome (ALIOS), high-fat diet (HFD) or normal chow (NC). b, The UMAP visualization demonstrates overlap of mouse (GEMM, TOX and OT) and human (TCGA) HCC transcriptional datasets. c, Unbiased clustering using a Louvain community detection algorithm identifies four groups within human and mouse (GEMM, TOX and OT) HCC data. d, The distribution of the subgroups identified in c with UMAP highlights shared HuMo clusters. e, All HuMo clusters are represented in the analysed GEMMs with varying heterogeneity within the individual cohorts. Source data
Fig. 3
Fig. 3. Individual HuMo clusters have distinct transcriptional and histological features.
a, Pathway enrichment analysis across the GEMMs, non-GEMMs and human TCGA-HCC data, indicating distinct identifying characteristics, including metabolic activity/differentiation, MYC/Myc pathway activation, proliferation propensity or immune status for the four HuMo clusters. n = 371 (human) and 187 (mouse). DN, downregulated; UP, upregulated; mut, mutated; amp, amplified; fl, floxed. bd, Transcriptional alignment correlates with histopathological similarities (inflammation (b), steatosis (c) and extracellular matrix (ECM) (d)) between human (n = 334) and mouse (n = 147) liver samples from the same HuMo clusters. Data are the log odds ratio (dots) 95% confidence intervals (bars). Statistical analysis was performed using Fisher tests; P > 0.05 (open circles), P ≤ 0.05 (closed circles). e, The distribution of HuMo clusters 1 to 4 and their alignment to previously reported molecular and immune HCC classifications and signatures in a validation cohort of human HCC. The full pathway heat map is shown in Extended Data Fig. 6 and associated statistical analysis is shown in Supplementary Table 2. n = 171 (human HCC). Source data
Fig. 4
Fig. 4. Testing standard-of-care therapies and new therapeutic class identification in a representative mouse cohort of HuMo cluster 1.
a, The cohorts used in bk. b, Temporal tracking of tumour development from a single clone to established HCC in male BM (cohort 5) mice using microscopic nodule detection through GS and macroscopic whole-liver assessment. The black arrows indicate macroscopic lesions at day 90. Scale bars, 200 µm (microscopic) and 1 cm (macroscopic). c, Quantification of microscopic and macroscopic nodules and macroscopic nodule count over time in male BM mice. n = 5, 6 and 9 mice for days 15, 30/60/90 and 125 respectively. Data are mean ± s.e.m. d, The treatment scheme for ej. e,f, Treatment with the TKIs sorafenib (45 mg per kg, oral) (e) or lenvatinib (10 mg per kg, oral) (f) in male BM mice. The dotted vertical line indicates the treatment start. n = 17, 15, 5 and 6 mice for sorafenib vehicle, sorafenib, lenvatinib vehicle and lenvatinib, respectively. Statistical analysis was performed using log-rank tests. g, Combination treatment with VEGFRi (3 mg per kg, oral) and the immune-checkpoint inhibitor anti-PD1 (200 µg per mouse, intraperitoneal) in male BM mice. The dotted vertical line indicates the treatment start. n = 9 (vehicle + IgG isotype) and 8 (VEGFi + anti-PD1). Statistical analysis was performed using log-rank tests. hj, Timepoint analysis (h) and quantification of GS (i) and Ki-67 and cleaved caspase 3 (CC3) (j) immunohistochemistry at day 15 and 30 after lenvatinib treatment in male BM mice. The dotted lines indicate the tumour borders. Scale bars, 1 mm (GS) and 200 µm (Ki-67). n = 5 and 6 mice at days 15 and 30, respectively (for vehicle and lenvatinib). Data are mean ± s.e.m. Statistical analysis was performed using a two-tailed unpaired t-test (day 15) and a Mann–Whitney U-test (day 30). k, High-throughput screening of 147 FDA-approved anti-cancer drugs plus internal controls, highlights antimetabolites (red) having an effect on growth of the HCCO tumouroids from BM mice; with cladribine (cl) having the greatest effect, while lenvatinib (le)/sorafenib (so) have only modest effect on the tumour cells. The full ranking is shown in Supplementary Table 3. l,m, In vitro validation of cladribine efficacy in mouse (l) and human (m) HCCOs. n = 3 different passages from 1–2 HCCO lines per mouse cohort, technical duplicates; 3 different passages from one to five human HCCO lines per driver combination, technical duplicates. Data are mean ± s.e.m. Source data
Fig. 5
Fig. 5. HuMo-cluster-specific treatment response to cladribine.
a,b, Summary of the cohorts (a) and treatments (b) in cm. c, Survival after cladribine treatment alone/or in combination with lenvatinib in male BM mice (cohort 5, HuMo 1). The dotted vertical line indicates the treatment start. n = 11 (vehicle), 13 (cladribine) and 13 (cladribine + lenvatinib). Statistical analysis was performed using log-rank tests. d, The liver-weight/body-weight ratio and tumour count over time. Data are shown as bars (liver weight/body weight) and symbols (tumour count) for individual mice. n = 10 and 9 (vehicle), 11 and 11 (cladribine), and 13 and 12 (cladribine + lenvatinib). e, Representative macroscopy images of male BM mice treated with vehicle, cladribine or cladribine + lenvatinib at the indicated days. Scale bar, 1 cm. fh, BM mice treated with cladribine + lenvatinib were assessed for tumour proliferating cells (Ki-67) and CD3+ T cells. Representative images (f) and quantification of tumour area and Ki-67+ cells (g) and CD3+ cells (h). Non-tumour tissue (NT) and tumour tissue (T) are matched. Scale bars, 200 μm (H&E, GS and Ki-67) and 100 µm (CD3). n = 7 throughout. Data are mean ± s.e.m. Statistical analysis was performed using two-tailed Kruskal–Wallis tests with Dunn’s correction (tumour area) and one-way analysis of variance (ANOVA) with Tukey’s correction (Ki-67 and CD3 quantification). ik, Priming of BM mice with cladribine + lenvatinib before treatment with anti-PD-1. i, Tumour counts at the day 7 and 30 timepoints. n = 7 (cladribine + lenvatinib, day 7; cladribine vehicle + lenvatinib vehicle + anti-PD-1 isotype, day 30; and cladribine + lenvatinib + anti-PD-1 isotype, day 30), n = 6 (cladribine vehicle + lenvatinib vehicle, day 7; and cladribine vehicle + lenvatinib vehicle + anti-PD-1, day 30), n = 8 (cladribine + lenvatinib + anti-PD-1, day 30). Data are mean ± s.e.m. Statistical analysis was performed using two-tailed Mann–Whitney U-tests (day 7) and Kruskal–Wallis tests with Dunn’s correction (day 30). j, The density of cytotoxic T cells in the tumour and stroma at day 30 after priming + anti-PD-1. n = 4 (cladribine vehicle + lenvatinib vehicle + anti-PD-1 isotype), n = 6 (cladribine vehicle + lenvatinib vehicle + anti-PD-1; and cladribine + lenvatinib + anti-PD-1 (note that four mice had no tumours to evaluate)) and n = 7 (cladribine + lenvatinib + anti-PD-1 isotype, day 30). Data are mean ± s.e.m. k, Representative images. Scale bars, 100 µm. l, Treatment with cladribine with or without lenvatinib in male cohort 23 mice (Ctnnb1ex3/WTR26LSL-MYC/LSL-MYCPtenfl/flTrp53R172H/WTCdkn2aKO/KO, HuMo 4). The dotted vertical line indicates the treatment start. n = 9 (cladribine vehicle + lenvatinib vehicle), 9 (cladribine + lenvatinib vehicle) and 10 (cladribine + lenvatinib). Statistical analysis was performed using log-rank tests. IC50, half-maximal inhibitory concentration. m, Treatment with cladribine with or without lenvatinib in male cohort 45 (R26LSL-MYC/LSL-MYCKrasG12D/WT, HuMo 2). The dotted vertical line indicates the treatment start. n = 8 (cladribine vehicle + lenvatinib vehicle), 8 (cladribine + lenvatinib vehicle), 8 (cladribine vehicle + lenvatinib) and 9 (cladribine + lenvatinib). Statistical analysis was performed using log-rank tests. Source data
Extended Data Fig. 1
Extended Data Fig. 1. Justification for and validation of the genetics and genetic induction approach employed in the suite of GEMMs.
(a) Dose finding for clonal induction using AAV.TBG.Cre in a R26-LSL-tdTomato reporter mouse model. Experimental scheme for b-d. (b-d) Decreasing doses of AAV.TBG.Cre lead to decreased recombination of the LSL and thus less RFP+ hepatocytes (b-c) Quantification of RFP+ hepatocytes by sex and dose. n = 4 mice throughout except n = 3 for 5×10⁹ female (single sample excluded due to inconsistent RFP staining). Data shown as mean ± s.e.m.. GC = genomic copies. (d) Representative images of immunofluorescent staining demonstrating exclusive and dose-dependent targeting of hepatocytes by AAV.TBG.Cre. Individual Channels for the zone 3 marker glutamine synthetase (GS, yellow), HNF4a (magenta), RFP (green), DAPI (blue). Scale bar equals 100 µm. (e) AAV.TBG.Cre sex-dependent clonal induction variation over time. Experimental scheme for f-i. (f) Quantification of RFP+ hepatocytes using GS shows clonal induction within zone 3 and outside zone 3 but no significant zonal expansion over time using a dose of 6.4*108 GC/mouse. n = 5 (male d3 + d7, female d3 + d7), 8 (female d5), 9 (male d5). Data shown as mean ± s.e.m. Two-way ANOVA with Tukey correction (g) Male mice recombine at a higher rate than female mice after induction with 6.4*108 GC/mouse with no additional residual recombination from 5 to 7 days post induction. n = 5 (male d3 + d7, female d3 + d7), 8 (female d5), 9 (male d5). Data shown as mean ± s.e.m., Kruskal-Wallis test with Dunn’s correction (h) Representative images of Cre-driven recombination rates in males and females on d3, d5, and d7 post induction; GS (green), HNF4a (magenta), RFP (yellow) and DAPI (blue). Scale bar equals 50 µm. (i) Summary of mouse cohorts used in j-l. (j) A lower induction rate in females leads to a lower tumour burden compared to males with the same mutational background. n = 28 (Cohort 5) and 19 (Cohort 6) mice. Data shown as mean ± s.e.m. Unpaired two tailed t-test. (k) Lower tumour burden due to a lower induction rate causes a prolonged survival in female mice compared to males with the same mutational background. n = 53 (male, Cohort 5) and 22 (female, Cohort 6) mice. Log rank test. (l) Mutational burden and induction dose influence tumour penetrance and survival outcomes. n = 11 (Cohort 1), 8 (Cohort 2), 14 (Cohort 3), 9 (Cohort 4), 53 (Cohort 5 – same data as k), 3 (Cohort 7). Log rank test. All panels: GC = genomic copies. Please note that individual cohort survival data shown for Cohort 5 and 6 are also shown in Extended Data Fig. 2a to allow direct comparison with data in that figure. (m) Analysis of the TCGA PanCancer dataset shows odds ratio for co-occurrence and mutual exclusivity of modelled HCC driver genes. n = 353. One-sided Fisher Exact Test, */**/*** denote p ≤ 0.05/0.01/0.001 respectively. (n) Mutual exclusivity of drivers is fluid and can change depending on tumour stage as shown for CTNNB1 and TP53; reanalysis of data from Nault et al.. n = 73 (BCLC 0), 404 (BCLC A), 157 (BCLC B), 101 (BCLC C). One-sided Fisher Exact Test. (o) Genotyping of bulk end stage tumour in representative cohorts. Genotyping by cohort and allelic recombination within individual mice (bars) – representative mice are aligned between alleles within cohorts. Comparison is made to known colony genotype testing presence/absence of allelic recombination to prediction displayed as false/true positives/negatives. Recombination accuracy denotes true positive + true negative/positive + negative. Cdkn1a and Cdkn2a were constitutive knockouts in the relevant colonies. Source data
Extended Data Fig. 2
Extended Data Fig. 2. Endpoint survival and tumour penetrance varies depending on co-occurrence of mutations.
(a) Detailed survival data for summary data shown in Fig. 1b. Median survival reported as time after AAV.TBG.Cre induction in days (dpi). Number of mice used per cohort is shown in the Figure. All cohorts except Cohort 6, 24, and 37 are male mice. Unless otherwise specified mice were induced with 6.4*108 GC/mouse. (H) indicates heterozygosity of an otherwise homozygous allele. (b) Correlation analysis of mutational burden with survival, tumour proliferation, and metastasis. n = 7 (2 Mutations), 9 (3 Mutations), 5 (4 Mutations), 3 (5 Mutations). Spearman Rank Test (two-tailed). (c) Correlation analysis of mutational burden and bleeding. n = 7 (2 Mutations), 9 (3 Mutations), 5 (4 Mutations), 3 (5 Mutations). Spearman Rank Test (two-tailed). Please note that survival data shown for Cohort 5 and 6 are also shown in Extended Data Fig. 1l to allow direct comparison with data in that figure. Source data
Extended Data Fig. 3
Extended Data Fig. 3. Macroscopic and microscopic tumour nodule phenotype reflect the heterogeneity of human HCC.
Representative images for each Cohort with staining for general morphology (H&E), glutamine synthetase (GS) for activated beta-catenin signalling, SOX9 as a progenitor marker, and Sirius Red as an indicator for extracellular matrix content in the tumours. All cohorts except Cohort 6 and 24 are male mice. Unless otherwise specified mice were induced with 6.4*108 GC/mouse. (H) indicates heterozygosity of an otherwise homozygous allele. Scale bar equals 1 cm (macroscopic) or 200 µm (microscopic). Macroscopic images and microscopic of H&E and GS for Cohorts 5, 19, 23, 28, 30, and 35 are the same as in Fig. 1c and are shown here to allow direct comparison with data in this figure. Scanned whole liver lobes across biological replicates from each cohort are available via BioImage Archive (https://www.ebi.ac.uk/) via accession number S-BIAD1365.
Extended Data Fig. 4
Extended Data Fig. 4. Mutational status alone does not explain cluster association.
(a) UMAP plots showing distribution of mouse cohorts by specific genetic alterations, carcinogen treatment (TOX), or orthotopic transplant (OT). (b-f) Samples with mutated CTNNB1/Ctnnb1 (b) are spread over the whole UMAP spectrum, whereas samples with expression of beta-catenin pathway downstream targets GLUL/Glul (c), LGR5/Lgr5 (d), LECT2/Lect2 (e), and NOTUM/Notum (f) are confined to the upper left quadrant.
Extended Data Fig. 5
Extended Data Fig. 5. Histopathological features in mice and human HCC within the same cluster are comparable.
(a) Transcriptional subclasses translate to similar histopathologies between human and mouse liver samples from the same HuMo clusters as shown by H&E staining; representative images from n = 4 biological replicates in each HuMo shown. Scale bars equal 200 µm. (b-d) Analysis of tumour grade (b + c) and steatohepatitis (d) highlights the resemblance of human (n = 334) and mouse (n = 147) HCC within the same HuMo cluster. Dots/bars as log odds ratio/95% Cis respectively; Fisher test, >0.05 (open circles) and ≤0.05 (closed circles). Scanned whole liver lobes across biological replicates from each cohort are available via BioImage Archive (https://www.ebi.ac.uk/) via accession number S-BIAD1365. Source data
Extended Data Fig. 6
Extended Data Fig. 6. Independent human HCC dataset validates HuMo cluster classification.
(a + b) Validation of the HuMo cluster classification system with a previously published, independent human HCC dataset shows similar distribution dynamics as for the TCGA data set. HuMo cluster 1 was enriched for immune-evasive signatures including the IFNAP signature, HuMo cluster 2 had higher inflammatory signalling signatures and was enriched for immune-active tumours, and HuMo clusters 3 and 4 featured a strong progenitor signature (CK19 mutation signature) consistent with the previously observed histological phenotype of these clusters. Only HuMo cluster 4 was significantly enriched for the inflamed HCC class with an immune-exhaustion signature and displays the lowest tumour purity, meaning higher fraction of stroma/immune infiltrate. Significant statistical comparisons between HuMos in a); Immune classification - 4 v.s rest, 3E-05; Immune exhausted – 4 vs. rest, 1E-08; Immune excluded – 1 vs rest 4E-10; IFNAP - 1 vs rest 3E-03; Hoshida S1 - 4 vs rest 2E-09; Hoshida S2 - 3 vs rest 9E-04; Hoshida S3 1 + 2 vs rest 1E-10; Chiang CTNNB1 – 1 vs rest 5E-15; Wnt-βcat activation - 1 vs rest 1E-13, Wnt-TGFβ – 4 vs rest 3E-09; CTNNB1 - 1 vs rest 1E-07. Continuous variables were compared using Two-tailed student T-test (normally distributed, equal variance), Welch’s T-test (normally distributed, unequal variance) or Wilcoxon-rank sum test (not normally distributed data). Categorical variables were compared using Fisher’s exact test. Statistical comparisons related to Extended Data Fig. 7 are shown separately in Supplementary Table 2.
Extended Data Fig. 7
Extended Data Fig. 7. Conventional clinically used classifications of human hepatocellular carcinoma fail to cluster mouse and TCGA HCC data sets distinctly.
(a) UMAP visualization of data sets by HuMo cluster (b + c) Survival of HCC patients (n = 396) and mice (n = 165) by HuMo cluster. (d) UMAP visualization of data sets by Hoshida subgroups. (e + f) Survival of HCC patients (n = 396) and mice (n = 165) by Hoshida subgroup. (g) Classification comparison (Hoshida vs HuMo cluster) by species. (h) UMAP visualization of data sets by Chiang subgroups. (i + j) Survival of HCC patients (n = 396) and mice (n = 165) by Chiang subgroup. (k) Classification comparison (Chiang vs HuMo cluster) by species. Survival analysis performed using univariate Cox Proportional-Hazards model reporting hazards ratio (HR), confidence intervals (95% CI), the p value was corrected for multiple testing (q value) using the false discovery rate method. UMAP in (a) is the same as in Fig. 2d and is shown here to allow direct comparison with data in this figure.
Extended Data Fig. 8
Extended Data Fig. 8. HuMo cluster 1 tumours display immune-paucity whilst a representative HuMo cluster 1 model displays mild inter-tumoural heterogeneity.
(a) Percentage (total number) of human TCGA HCC samples with mutations in CTNNB1 associated with each HuMo cluster. (b) Ratio of wild type and mutated CTNNB1 in human TCGA HCC samples within each HuMo cluster. (c) Immune-pathway analysis shows a clear association of HuMo cluster 1 with immune paucity, whereas HuMo cluster 2 shows the highest association with immune-cell enrichment. (d + e). Correlation analysis of immune score, fibroblast, and endothelial signatures with HuMo clusters and mutations in human (d) and mouse (e) emphasizes the negative enrichment for immune score in HuMo cluster 1 and CTNNB1 mutated samples in both species. (f) Summary of cohorts used in this figure; cohort 5 = BM. All mice used in this figure were male. (g) Experimental scheme for samples used in h + i. (h) Heatmap of differentially expressed genes between liver tissue from mice with global hepatocyte induction of altered genes and, non-tumour and tumour, tissue from mice with clonal hepatocyte induction of altered genes. Tumour tissue, despite induction of the same genetic alterations, differs greatly from the global induction group suggesting evolution of induced clones to develop tumours. n = 3 (global and non-tumour), 6 mice with up to 3 tumour samples per mouse (tumour). (i) Gene Ontology over-representation analysis shows upregulation of biological processes associated with oncogenesis in tumour tissue. One-sided Fisher’s exact test; adjusted using the Benjamini-Hochberg procedure. Source data
Extended Data Fig. 9
Extended Data Fig. 9. Treatment with the tyrosine kinase inhibitor lenvatinib leads to phenotypic changes and increased metastasis.
(a) Summary of cohorts used in b-j. All mice used in this figure were male. (b) Treatment with immune checkpoint inhibitor anti-PD1 (200 µg/mouse, ip) does not significantly improve survival in a mouse model representative of HuMo cluster 1. Dotted vertical line indicates treatment start. n = 6 (IgG Isotype), 7 (anti-PD1). Log rank test. (c) Treatment with immune checkpoint inhibitor anti-PD1 (200 µg/mouse, ip) and VEGFRi (3 mg/kg, oral) significantly improves survival in a mouse model representative of HuMo cluster 2. Dotted vertical line indicates treatment start. n = 8 (Vehicle/IgG Isotype), 12 (VEGFi/anti-PD1). Log rank test. (d) Macroscopic liver images of drug and vehicle treated Cohort 5 (BM) mice at endpoint. Scale bar equals 1 cm. (e + f) Treatment with lenvatinib, but not sorafenib or anti-PD1, results in a more aggressive tumour morphology (indicated by black arrows) and increased number of mice with detectable metastasis at endpoint in Cohort 5 (BM) mice. Scale bar equals 1 mm. n = 17 (sorafenib vehicle), 13 (sorafenib), 5 (lenvatinib vehicle + lenvatinib + IgG Isotype), 7 (anti-PD1) mice. (g) Non-invasive magnetic resonance imaging of Cohort 5 (BM) mice reveals delayed tumour growth in lenvatinib treated mice with liver volume as a proxy for tumour burden. n = 5 (lenvatinib Vehicle), 6 (lenvatinib). (h) Treatment scheme for i-j with drug given from d60 post induction to accommodate for faster model progression (see Extended Data Fig. 2a). (i) Lenvatinib treatment improves endpoint survival in a representative GEMM of HuMo cluster 4 (Cohort 23, BM + Ptenfl/fl + Trp53R172H/wt + Cdkn2aKO/KO). Dotted vertical line indicates treatment start. n = 8 (lenvatinib vehicle), 7 (lenvatinib). Log rank test. (j) Cohort 23 (BM + Ptenfl/fl + Trp53R172H/wt + Cdkn2aKO/KO) mice treated with lenvatinib have increased number of mice with detectable metastasis at endpoint. n = 6 (lenvatinib vehicle), 7 (lenvatinib). Source data
Extended Data Fig. 10
Extended Data Fig. 10. HCCOs mimic features of the primary tumour and are suited to investigate drug effects on tumour cells.
(a) Schematic of murine HCCO assay pipeline. HTP = high-throughput, GEMM = genetically-engineered mouse model, HCC = hepatocellular carcinoma, HCCOs = HCC organoids. (b) HCCOs keep characteristics of primary tumour tissue such as accumulation of beta-catenin (CTNNB1), proliferation marker Ki67, differentiation marker HNF4a, glutamine synthetase (GS) and MYC expression; representative images of single organoids from a bulk culture from a single organoid line and of single tumours from multiple autochthonous tumours within a single mouse. Scale bars equal 100 µm. NT = non-tumour, T = tumour. (c) The transcriptional phenotype of HCCOs differed from the original tumours of the same Cohort, likely due to the simplified nature of HCCOs as an epithelial-cell-only model as well adaptive response to the culture conditions. Note that all GEMMs and HCCOs are mutated/overexpressing of both CTNNB1/Myc respectively.
Extended Data Fig. 11
Extended Data Fig. 11. A high-throughput tumouroid assay pipeline identifies anti-cancer drugs for repurposing as potential HCC therapy.
(a) Volumetric measurements of HCCOs after 9 d treatment with indicated drugs; merged data from 4 technical replicates in each of two plates per condition. Ranking position in parenthesis. Nucleobase/Nucleoside analogues indicated by asterisks. Box centre=median with box bounding 25–75th centiles, the upper whisker extend +/− 1.5*IQR from the hinge. N = 2421/2259/2748/1700/2172/2314/1555/2964/2383/3840/3192/1820/2876/4491/1561/1624/18/45/1608/2408/3564/1649/2066/2538/1911/2273/2008 organoids for Azacitidine/Bleomycin sulfate/Bortezomib/Brigatinib/Cladribine/Clofarabine/Copanlisib/Cytarabine hydrochloride/Decitabine/DMSO/Doxorubicin hydrochloride/Everolimus/Gemcitabine hydrochloride/Idarubicin hydrochloride/Lenvatinib/Methotrexate/Mitomycin/Osimertinib/Oxaliplatin/Paclitaxel/Regorafenib/Sorafenib internal/Thioguanine/Topotecan hydrochloride/Triethylenemelamine/Valrubicin respectively. (b + c) Testing a wide variety of antimetabolites demonstrates a drug-specific on-target effect for antimetabolites in the same subclass as cladribine. No synergy between cladribine and lenvatinib was observed in HCCOs. n = 3 (different passages from one to two HCCO lines per named mouse cohort, technical duplicates; black/green/blue/magenta = HCCOs originated from tumours of cohort 5/19/20/23 respectively). Data shown as mean ± s.e.m. (d) In vitro dose-dependency testing of drug efficacy in murine HCCOs validates results from screen. n = 3 (different passages from one to two HCCO lines per named mouse cohort, technical duplicates). Data shown as mean ± s.e.m. (e) Representative images of dose-dependent drug effects on murine HCCOs after 9 days of treatment. Scale bar equals 200 µm. (f) In vitro dose-dependency testing of drug efficacy in human HCCOs validates results from screen. n = 3 (different passages from one to five human HCCO lines per driver combination, see methods for details, technical duplicates). Data shown as mean ± s.e.m. Source data
Extended Data Fig. 12
Extended Data Fig. 12. Cladribine decreases tumour burden associated with increasing immune cell infiltration and primes tumours for ICI therapy.
(a + b) Cohort summary and schematic of treatment regimens used in c-h. All mice used in this figure were male. (c + d) Cohort 5 (BM) mice treated with cladribine + lenvatinib have fewer proliferating cells in their tumours and more infiltration of CD3+ T-cells, but levels of cleaved Caspase 3 (CC3) as well as general morphology are unaltered when compared at endpoint. (c) Representative images. Scale bars equal 200 µm (H&E, GS, Ki67, CC3) or 100 µm (CD3). (d) Quantification of Ki67, CC3, and CD3 in matched non-tumour (NT) and tumour (T) tissue. n = 6 (cladribine vehicle, cladribine), 8 (cladribine + lenvatinib, two of which mice did not have microscopic tumours to quantify and therefore were excluded). Data shown as mean ± s.e.m. Kruskal-Wallis test with Dunn’s correction (Ki67, CD3)/One-way ANOVA with Tukey correction (CC3). (e) After 30 days on treatment, Cohort 5 (BM) mice on cladribine + lenvatinib combination therapy have smaller and fewer tumours. n = 7 (all sample groups). Data shown as mean ± s.e.m. Kruskal-Wallis test with Dunn’s correction. (f-h) Cladribine treatment for 30 days, either as monotherapy or combination therapy, induces DNA damage in matched tumour (T) and non-tumour (NT) tissue as determined by phosphorylation of Histone 2AX (pH2AX). This does not result in increased senescence, assessed by p53, or apoptosis, assessed by cleaved caspase 3 (CC3). (f) Representative immunohistochemistry images. Scale bars equal 200 µm (pH2AX, p53) or 100 µm (CC3). (g) Quantification of pH2AX in matched non-tumour (NT) and tumour (T) tissue. n = 7 (all sample groups). Data shown as mean + s.e.m. Two-way ANOVA with Tukey correction. (h) Quantification of p53 and CC3 expression in tumour tissue. n = 7 (all sample groups). Data shown as mean ± s.e.m. One-way ANOVA with Tukey correction. (i) Schematic of treatment regimens used in j-l. All mice used in this figure were male. (j + k) Increase of cytotoxic T-cells in liver and tumour at the d30 timepoint after priming + anti-PD-1. n = 7 (cladribine veh + lenvatinib veh + PD-1 Isotype liver, cladribine + lenvatinib + PD-1 Isotype liver), 6 (cladribine veh + lenvatinib veh + PD-1 liver), 8 (cladribine + lenvatinib + PD-1 liver), 5 (cladribine veh + lenvatinib veh + PD-1 Isotype tumour, cladribine veh + lenvatinib veh + PD-1 tumour), 4 (cladribine + lenvatinib + PD-1 Isotype tumour), 3 (cladribine + lenvatinib + PD-1 tumour). Data shown as mean ± s.e.m. Kruskal-Wallis test with Dunn’s correction (CD4 liver, CD8 tumour), One-way ANOVA with Tukey correction (CD8 liver, CD4 tumour). (l) Representative whole lobe and magnified images used in Fig. 5k. Scale bars equal 1 mm (right panel) and 100 µm (middle and left panel). Source data

References

    1. Sung, H. et al. Global cancer statistics 2020: GLOBOCAN estimates of incidence and mortality worldwide for 36 cancers in 185 countries. CA. Cancer J. Clin.71, 209–249 (2021). - PubMed
    1. Llovet, J. M. et al. Hepatocellular carcinoma. Nat. Rev. Dis. Primer7, 6 (2021). - PubMed
    1. Brunner, S. F. et al. Somatic mutations and clonal dynamics in healthy and cirrhotic human liver. Nature574, 538–542 (2019). - PMC - PubMed
    1. The Cancer Genome Atlas Research Network. Comprehensive and integrative genomic characterization of hepatocellular carcinoma. Cell169, 1327–1341 (2017). - PMC - PubMed
    1. Harding, J. J. et al. Prospective genotyping of hepatocellular carcinoma: clinical implications of next-generation sequencing for matching patients to targeted and immune therapies. Clin. Cancer Res.25, 2116–2126 (2019). - PMC - PubMed

LinkOut - more resources