. 2025 Mar;639(8055):776-783.
doi: 10.1038/s41586-025-08590-2. Epub 2025 Feb 19.

Dual regulation of mitochondrial fusion by Parkin-PINK1 and OMA1

Affiliations

Dual regulation of mitochondrial fusion by Parkin-PINK1 and OMA1

Tatsuya Yamada et al. Nature. 2025 Mar.

Abstract

Mitochondrial stress pathways protect mitochondrial health from cellular insults1-8. However, their role under physiological conditions is largely unknown. Here, using 18 single, double and triple whole-body and tissue-specific knockout and mutant mice, along with systematic mitochondrial morphology analysis, untargeted metabolomics and RNA sequencing, we discovered that the synergy between two stress-responsive systems-the ubiquitin E3 ligase Parkin and the metalloprotease OMA1-safeguards mitochondrial structure and genome by mitochondrial fusion, mediated by the outer membrane GTPase MFN1 and the inner membrane GTPase OPA1. Whereas the individual loss of Parkin or OMA1 does not affect mitochondrial integrity, their combined loss results in small body size, low locomotor activity, premature death, mitochondrial abnormalities and innate immune responses. Thus, our data show that Parkin and OMA1 maintain a dual regulatory mechanism that controls mitochondrial fusion at the two membranes, even in the absence of extrinsic stress.


Conflict of interest statement

Competing interests: The authors declare no competing interests.

Figures

Extended Data Fig. 1 |
Extended Data Fig. 1 |. Generation of Dele1−/− mice.
(a) To delete the Dele1 gene in the mouse genome, exon 2 was targeted using the CRISPR-Cas9 editing system with the indicated gRNA. (b) The location of the targeted site in the Dele1 gene is shown. (c) DNA sequencing confirmed that the genome editing removed 10 nucleotides at the position from 45 to 54 and introduced a stop codon after adding four amino acids.
Extended Data Fig. 2 |
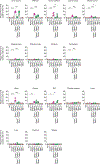
Extended Data Fig. 2 |. Representative images of mitochondria in the zona incerta, midbrain, dorsal pallidum, lateral cortex, hippocampus, olfactory bulb, striatum, and cerebellum.
Brain sections from the indicated mouse lines were analyzed by laser confocal immunofluorescence microscopy with anti-PDH antibodies. Mice were analyzed at 6 weeks of age.
Extended Data Fig. 3 |
Extended Data Fig. 3 |. Representative images of mitochondria in the kidney, brown adipose tissue (BAT), skeletal muscle, lung, intestine, and spleen.
Tissue sections from the indicated mouse lines were analyzed by laser confocal immunofluorescence microscopy with anti-PDH antibodies. Mice were analyzed at 6 weeks of age.
Extended Data Fig. 4 |
Extended Data Fig. 4 |. Quantification of cells that contain enlarged mitochondria.
Values are mean ± SD (n = 4 for all tissues in the mouse lines, except for the following: zona incerta, midbrain, dorsal pallidum, and lateral cortex in 5 Parkin−/−Oma1−/−Mfn1+/− mice; BAT in 3 Oma1−/− mice; and lung in 3 WT, 3 Parkin−/−Oma1−/−, and 3 Parkin−/−Oma1−/−Mfn1+/− mice). Significance was calculated using one-way ANOVA with post-hoc Tukey: *p < 0.05, **p < 0.01, ***p < 0.001. Mice were analyzed at 6 weeks of age.
Extended Data Fig. 5 |
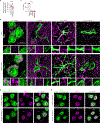
Extended Data Fig. 5 |. Megamitochondria are formed in neurons of Parkin−/−Oma1−/− mice.
(a) Quantification of cells that contain enlarged mitochondria in the pons and medulla in Parkin−/−Oma1−/− mice (mean ± SD, n = 3 mice). (b) Frozen sections of the pons/medulla from WT and Parkin−/−Oma1−/− mice were analyzed using laser confocal immunofluorescence microscopy with anti-PDH antibodies alongside cell type markers: NeuN (neurons), Iba1 (microglia), GFAP (astrocytes), and PECAM1 (vascular cells). (c) Megamitochondria-containing cells positive for each marker were quantified (mean ± SD, n = 3 mice). (d and e) Frozen sections of WT pons/medulla were analyzed using laser confocal immunofluorescence microscopy with antibodies against PDH and NeuN, with or without antigen retrieval using 1 mM EDTA. Two NeuN antibodies were used: 26975–1-AP from Proteintech in (d) and 24307 from Cell Signaling in (e). DNA was co-stained with DAPI. Significance was calculated using two-tailed Student’s t-test in (a) and one-way ANOVA with post-hoc Tukey (c): ***p < 0.001. Mice were analyzed at 6 weeks of age.
Extended Data Fig. 6 |
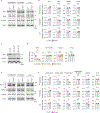
Extended Data Fig. 6 |. Western blotting analysis.
(a) The pons/medulla, cerebellum, and liver from WT and Parkin−/− mice were analyzed by Western blotting with the indicated antibodies. The asterisk indicates non-specific bands detected by the anti-Mfn1 antibodies. (b) Quantification of band intensity (mean ± SD, n = 3). (c) Confirmation of the specificity of the anti-Mfn1 antibodies was performed. Mfn1 was knocked down in mouse embryonic fibroblasts using two distinct siRNAs and subjected to Western blotting with the specified antibodies. (d) Quantification of band intensity (mean ± SD, n = 3). (e) The tissues from WT and Oma1−/− mice were analyzed by Western blotting with the specified antibodies. For Pgam5, P indicates the precursor form, and M in the mature form. (f) Quantification of band intensity (mean ± SD, n = 3). Significance was determined using two-tailed Student’s t-test in (b, f) and one-way ANOVA with post-hoc Tukey (d): *p < 0.05, **p < 0.01, ***p < 0.001. Mice were analyzed at 6 weeks of age.
Extended Data Fig. 7 |
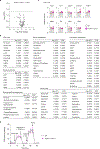
Extended Data Fig. 7 |. Comparison of the metabolomic landscapes.
(a) Volcano plot of metabolomic data from WT and Parkin−/−Oma1−/− pons/ medulla. None of the 188 metabolites identified showed significant changes in the Parkin−/−Oma1−/− pons/medulla compared to WT, using an FDR threshold of 0.05 indicated by the dotted line (n = 4 WT and 5 Parkin−/−Oma1−/− mice). (b) Log2 fold change and FDR of each metabolite involved in the TCA cycle, energy metabolism, glycolysis/gluconeogenesis, purine/pyrimidine metabolism, and amino acids. (c) Activity of each of the nine TCA cycle enzymes: aconitase (ACO), isocitrate dehydrogenase (IDH), oxoglutarate dehydrogenase (OGDH), succinyl-CoA ligase (SUCLG), fumarase (FUMH), malate dehydrogenase (MDH), citrate synthase (CS), succinate dehydrogenase (SDH), and pyruvate dehydrogenase (PDH) in WT and Parkin−/−Oma1−/− pons/medulla (mean ± SD, n = 3 mice). (d) Oxygen consumption rates (OCRs) in WT and Parkin−/−Oma1−/− brain (mean ± SD, n = 3 mice). Mice were analyzed at 6 weeks of age.
Extended Data Fig. 8 |
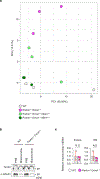
Extended Data Fig. 8 |. Principal component analysis and Western blotting.
(a) Principal component analysis of bulk RNA-seq data. (b) Postnuclear supernatants and mitochondrial fractions from WT and Parkin−/−Oma1−/− pons/ medulla were analyzed by Western blotting using antibodies against Tim23 and α-tubulin. (c) qPCR analysis of the mitochondrial fraction from WT and Parkin−/−Oma1−/− pons/medulla (mean ± SD, n = 3). Significance was determined using two-tailed Student’s t-test.
Extended Data Fig. 9 |
Extended Data Fig. 9 |. qRT-PCR analysis.
qRT-PCR analysis of Ifit3, Usp18, Oasl2, Ddx60, Bst2, and Sting1 in the pons/medulla of WT and Parkin−/−Oma1−/− mice (mean ± SD, n = 5). Significance was determined using two-tailed Student’s t-test: *p < 0.05, **p < 0.01, ***p < 0.001.
Extended Data Fig. 10 |
Extended Data Fig. 10 |. Measurement of mitochondrial fusion status.
(a) Western blotting of Drp1 KO MEFs transduced with lentiviruses carrying Opa1 and/or Mfn1. The asterisk indicates non-specific bands of anti-Mfn1 antibodies. Quantification of band intensity is shown (mean ± SD, n = 3). (b) Drp1 KO MEFs carrying matrix-targeted photoactivatable GFP (mito-PA-GFP), along with Opa1 and/or Mfn1, were stained with tetramethylrhodamine ethyl ester (TMRE). mito-PA-GFP in a single mitochondrion (indicated by the boxes) in the cell periphery was photoactivated, and images were obtained every 1 min at a single focal plane. Photoactivation was performed every 1 min on the same mitochondrion to maintain signal intensity. Representative images before and after (0 and 15 min) photoactivation are shown. (c) The mitochondrial fusion status was calculated based on the relative area containing photoactivated mito-PA-GFP signals over the total mitochondria stained with TMRE at 15 min (mean ± SD, n = 35 cells for Drp1 KO, 32 cells for Drp1 KO + Opa1, 34 cells for Drp1 KO + Mfn1, and 31 cells for Drp1 KO + Opa1 + Mfn1). Statistical analysis was performed using one-way ANOVA with post-hoc Tukey test: *p < 0.05, ***p < 0.001.
Extended Data Fig. 11 |
Extended Data Fig. 11 |. Analysis of dopaminergic and motor neurons.
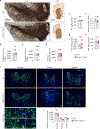
(a) Tyrosine hydroxylase (TH) immunohistochemistry images of dopaminergic neurons in the substantia nigra pars compacta (SN) and striatum (STR) of WT and Parkin−/−Oma1−/− mice are shown. Nissl staining was included for the SN. (b, c) Stereological counting of TH-positive neurons (b) and Nissl-positive neurons (c) in the SN (mean ± SD, n = 3 mice). (d) Quantification of TH-positive fiber density in the STR (mean ± SD, n = 9 from 3 mice). (e–h) Measurements of dopamine (e), 3,4-dihydroxyphenylacetic acid (f), homovanillic acid (g), and 3-methoxytyramine (h) (mean ± SD, n = 4 mice). (i) Immunofluorescence microscopy of the spinal cord using anti-choline acetyltransferase antibodies. The cervical, thoracic, and lumbar regions were analyzed. Boxed areas are enlarged. (j) The number of motor neurons per 2,500 μm length of each spinal cord region is shown (mean ± SD, n = 4 mice). Significance was determined using two-tailed Student’s t-test in (b–h, j): **p < 0.01, ***p < 0.001.
Fig. 1 |
Fig. 1 |. Parkin–PINK1 and OMA1 ensure mouse fitness by suppression of mitochondrial fusion.
a, Representative images of WT and the indicated systemic KO mice; only male mice are shown. b, Survival of mice (n = 14 for all mouse lines, except for 16 Parkin−/−Oma1−/−Opa1+/− mice; males and females are equally represented). c, Body weight of mice (mean ± s.d., n = 7 for all mouse lines, except for six Mfn1+/− mice). d, General locomotor activity was measured in an open-field test (mean ± s.d., n = 6 mice; males and females are equally represented). e, A working model. The overall mitochondrial fusion reaction requires both outer and inner membrane fusion. In WT mice, mitochondrial fusion is regulated at the outer membrane (OM) by Parkin–PINK and at the inner membrane (IM) by OMA1. Together, these mechanisms suppress excess fusion (i). In Parkin−/−, Pink1−/− and Oma1−/− mice, one of the two regulations is removed but the remaining one still blocks excess fusion (ii). In Parkin−/−Oma1−/− and Pink1−/−Oma1−/− mice, both regulations are removed, leading to harmful excess fusion (iii). Heterozygous loss of OPA1 or MFN1 mitigates excess fusion by mimicking the function of the suppression mechanism (iv). Significance was calculated using one-way analysis of variance (ANOVA) with post hoc Tukey: *P < 0.05, **P < 0.01, ***P < 0.001. a,c,d, Mice were analysed at 6 weeks of age.
Fig. 2 |
Fig. 2 |. Parkin and OMA1 prevent excess mitochondrial fusion.
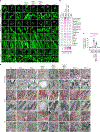
a, Representative images of mitochondria in different tissues from WT and the indicated KO mice. Laser confocal immunofluorescence microscopy using anti-PDH antibodies was performed. Boxed areas are enlarged. b, Heatmap representation of cells with enlarged mitochondria (n = 4 for all tissues in mouse lines, except for the following: pons/medulla, zona incerta, midbrain, dorsal pallidum and lateral cortex, in five Parkin−/−Oma1−/−Mfn1+/− mice; brown adipose tissue (BAT) in three Oma1−/− mice; and lung in three WT, three Parkin−/−Oma1−/− and three Parkin−/−Oma1−/−Mfn1+/− mice). Quantitative analysis is presented in c and Extended Data Fig. 4. c, Quantification of cells containing enlarged mitochondria in the pons/medulla (mean ± s.d., n = 4 for all mouse lines, except for five Parkin−/−Oma1−/−Mfn1+/− mice). d, Transmission electron microscopy of pons/medulla, heart and liver in the indicated mouse lines. Mitochondria are highlighted in red, and boxed areas are enlarged. Significance was calculated using one-way ANOVA with post hoc Tukey: ***P < 0.001. Mice were analysed at 6 weeks of age. Scale bars, 10 μm (a), 1 μm (d).
Fig. 3 |
Fig. 3 |. Parkin and OMA1 protect the mitochondrial genome.
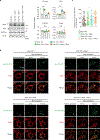
a, RNA-seq analysis of pons/medulla from WT and Parkin−/−Oma1−/− mice (n = 3). GSEA was performed using two types of gene set: the Gene Ontology (GO) biological process and MSigDB hallmark pathway. b, Heatmap showing upregulated differentially expressed genes (DEGs) in gene sets highlighted in pink in a. WT, Parkin−/−Oma1−/−, Parkin−/−Oma1−/−Opa1+/− and Parkin−/−Oma1−/−Mfn1+/− mice were analysed (n = 3). GSEA in a and z-scoring and DEG analysis in b were performed using RNAseqChef 1.1.2 (DESeq2, log2(fold change) > 0.4, FDR < 0.05). c, Laser confocal immunofluorescence microscopy of pons/medulla from the indicated mice using antibodies to a mitochondrial matrix protein (Aco2) and DNA. For Parkin−/−Oma1−/− mice, examples of cells containing either normal-shaped mitochondria or megamitochondria are shown. Boxed areas are enlarged. Arrowheads indicate mtDNA signal outside of mitochondria. d, Quantification of mtDNA nucleoid size in the indicated cells (mean ± s.d., n = 937–1,877 nucleoids from three mice). e, mtDNA in the extramitochondrial region was quantified (mean ± s.d., n = 30 cells from three mice). f, Quantification of cytosolic mtDNA by qPCR using two sets of primers (D-loop and 16S) in cytosolic extracts of pons/medulla from the indicated mice (mean ± s.d., n = 3). g, Immunoblot analysis of the whole-cell extract and cytosolic fraction. h, Representative images of male Stinggt/gt, Parkin−/−Oma1−/− and Parkin−/−Oma1−/−Stinggt/gt mice. i, Mouse body weight (mean ± s.d., n = 5). j, Mouse survival (n = 10, males and females equally represented). Significance was calculated using one-way ANOVA with post hoc Tukey (d,e,i), two-tailed Student’s t-test (f) or log-rank test with Bonferroni correction (j): *P < 0.05, **P < 0.01, ***P < 0.001. ai, Mice were analysed at 6 weeks of age. Please refer to Methods for exact n numbers. Scale bars, 10 μm (c), 1 cm (h). NS, not significant.
Fig. 4 |
Fig. 4 |. Parkin and OMA1 suppress stress-induced mitochondrial enlargement in the liver.
a, Body weight (n = 4 for all mouse lines, except for five male Alb-ParkinOma1 KO mice and three female Alb-Drp1 KO mice). b, Liver weight relative to body weight (n = 4). c, Laser confocal immunofluorescence microscopy of frozen liver sections using anti-PDH antibodies. d, Quantification of cells with enlarged mitochondria (n = 3–4). e, Quantification of mitochondrial size (n = 542–604 mitochondria from three or four mice). f, Transmission electron microscopy of the liver. gk, Quantification of mitochondrial morphology (n = 258–356 mitochondria from three or four mice): size (g), perimeter (h), presence of disorganized cristae (i), aspect ratio (j) and circularity (k). l, Immunoblotting of the liver. Asterisk indicates non-specific bands of anti-MFN1 antibodies. m, Quantification of band intensity (n = 3–4 mice). n, Laser confocal immunofluorescence microscopy of frozen liver sections using antibodies to PDH, ubiquitin (Ub) and p62. o, Quantification of ubiquitin-positive cells (n = 3–4). p, Plasmids carrying Su9-mCherry-GFP were delivered to livers by hydrodynamic tail vein injection. Four days following injection, liver sections were analysed by confocal microscopy. q, Mitophagy index (n = 28 cells for control, 41 for Alb-Drp1 KO, 27 for Alb-ParkinOma1 KO and 28 for Alb-Drp1ParkinOma1 KO). r, Serum ALT levels (n = 7 mice for control, 7 for Alb-Drp1 KO, 5 for Alb-ParkinOma1 KO and 6 for Alb-Drp1ParkinOma1 KO). Results are shown as mean ± s.d. Significance was calculated using one-way ANOVA with post hoc Tukey test: *P < 0.05, **P < 0.01, ***P < 0.001. Mice were analysed at 6 weeks of age, except for l,m,r, in which mice were examined at 3 months. Please refer to Methods for exact n numbers. Scale bars, 10 μm (c,n,p), 1 μm (f).

References

    1. Konig T et al. MIROs and DRP1 drive mitochondrial-derived vesicle biogenesis and promote quality control. Nat. Cell Biol 23, 1271–1286 (2021). - PubMed
    1. Yang Q et al. LONP-1 and ATFS-1 sustain deleterious heteroplasmy by promoting mtDNA replication in dysfunctional mitochondria. Nat. Cell Biol 24, 181–193 (2022). - PMC - PubMed
    1. Vargas JNS, Hamasaki M, Kawabata T, Youle RJ & Yoshimori T The mechanisms and roles of selective autophagy in mammals. Nat. Rev. Mol. Cell Biol 24, 167–185 (2023). - PubMed
    1. Murata D, Arai K, Iijima M & Sesaki H Mitochondrial division, fusion and degradation. J. Biochem 167, 233–241 (2020). - PMC - PubMed
    1. Friedman JR & Nunnari J Mitochondrial form and function. Nature 505, 335–343 (2014). - PMC - PubMed

MeSH terms

LinkOut - more resources