. 2025 Mar;639(8054):463-473.
doi: 10.1038/s41586-024-08552-0. Epub 2025 Feb 19.

Tumour-wide RNA splicing aberrations generate actionable public neoantigens

Affiliations

Tumour-wide RNA splicing aberrations generate actionable public neoantigens

Darwin W Kwok et al. Nature. 2025 Mar.

Abstract

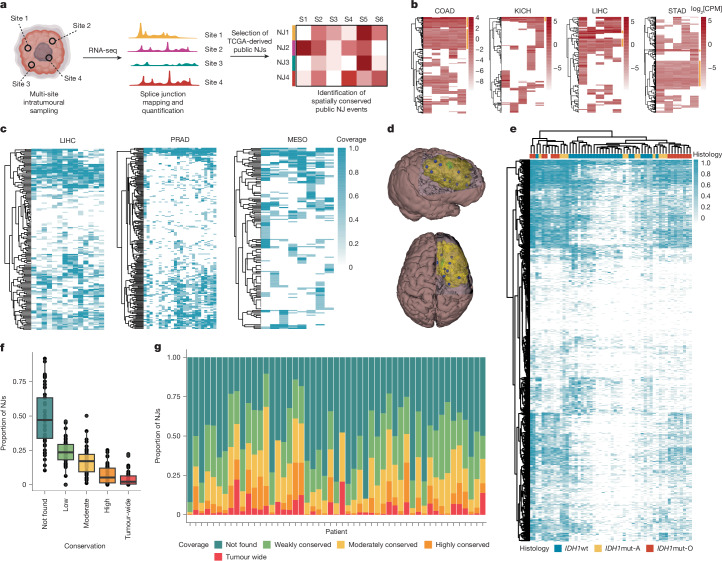
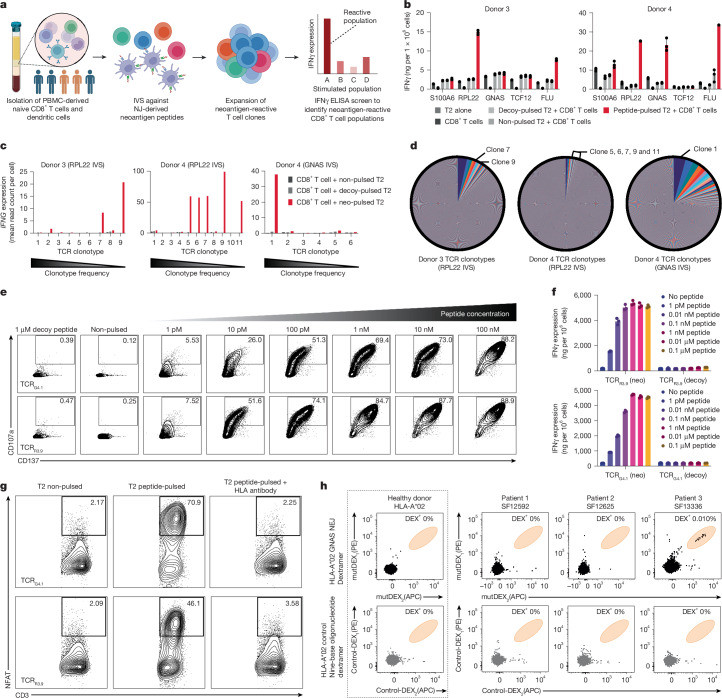
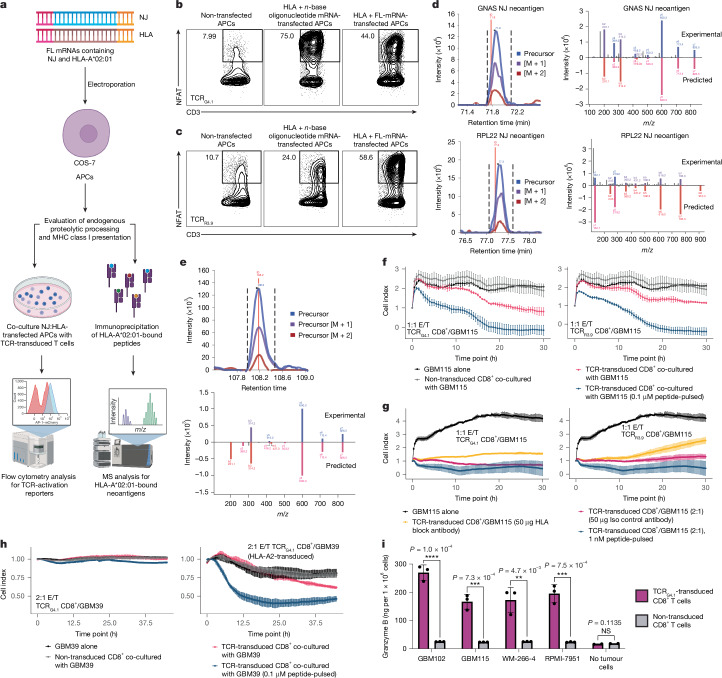
T cell-based immunotherapies hold promise in treating cancer by leveraging the immune system's recognition of cancer-specific antigens1. However, their efficacy is limited in tumours with few somatic mutations and substantial intratumoural heterogeneity2-4. Here we introduce a previously uncharacterized class of tumour-wide public neoantigens originating from RNA splicing aberrations in diverse cancer types. We identified T cell receptor clones capable of recognizing and targeting neoantigens derived from aberrant splicing in GNAS and RPL22. In cases with multi-site biopsies, we detected the tumour-wide expression of the GNAS neojunction in glioma, mesothelioma, prostate cancer and liver cancer. These neoantigens are endogenously generated and presented by tumour cells under physiologic conditions and are sufficient to trigger cancer cell eradication by neoantigen-specific CD8+ T cells. Moreover, our study highlights a role for dysregulated splicing factor expression in specific cancer types, leading to recurrent patterns of neojunction upregulation. These findings establish a molecular basis for T cell-based immunotherapies addressing the challenges of intratumoural heterogeneity.


Conflict of interest statement

Competing interests: C.A.K. and I.E. are inventors on patents related to public neoantigen-specific TCRs unrelated to the present manuscript and are recipients of licensing revenue shared according to Memorial Sloan Kettering Cancer Center institutional policies. C.A.K. has consulted for or is on the scientific advisory boards for Achilles Therapeutics, Affini-T Therapeutics, Aleta BioTherapeutics, Bellicum Pharmaceuticals, Bristol Myers Squibb, Catamaran Bio, Cell Design Labs, Decheng Capital, G1 Therapeutics, Klus Pharma, Obsidian Therapeutics, PACT Pharma, Roche/Genentech, Royalty Pharma and T-knife. C.A.K. is a scientific co-founder and equity holder in Affini-T Therapeutics.

Figures

Fig. 1
Fig. 1. Characterization of public NJs across multiple cancer types.
a, TCGA RNA-seq data were analysed across GBM (n = 167 samples), LGG (n = 516), LUAD (n = 517), lung squamous cell carcinoma (LUSC; n = 501), mesothelioma (MESO; n = 516), LIHC (n = 371), stomach adenocarcinoma (STAD; n = 415), SKCM (n = 470), kidney renal papillary cell carcinoma (KIRP; n = 290), kidney chromophobe (KICH, n = 66), colon adenocarcinoma (COAD; n = 458) and prostate adenocarcinoma (PRAD; n = 497). b, Samples with tumour purity ≥60% (solid colour) were selected for analysis, excluding MESO and STAD owing to unavailable purity data. c, Interpatient NJ frequency (PSR) was analysed, with public NJs defined as PSR ≥ 10% (red line). d,e, Total number (d) and log2[read frequency] (e) of public NJs detected per sample across tumour types (COAD, n = 265; GBM, n = 391; KICH, n = 773; KIRP, n = 247; LGG, n = 327; LIHC, n = 173; LUAD, n = 175; LUSC, n = 555; MESO, n = 277; PRAD, n = 245; SKCM, n = 353; STAD, n = 1,433). f,g, Public NJs were categorized by splice type: exonic loss at the 3′ or 5′ splice site (A3 or A5 loss (A3−; A5−)), intronic gain at the 3′ or 5′ splice site (A3 or A5 gain (A3+; A5+)), exon skip (ES), junction in exon, junction in intron and others (f) and frameshift (FS) status (g); IF, in-frame. h, Expression of all pan-cancer-spanning NJs (log2[counts per million (CPM)]) across all studied TCGA tumour types. Further statistical details are provided in Supplementary Table 3. a, Created in BioRender (credit: D.W.K., https://BioRender.com/k09l557; 2024).
Fig. 2
Fig. 2. A subset of NJs are expressed tumour-wide.
a, Overview of tumour-wide NJ characterization using RNA-seq data from multiple intratumoural regions in various cancer types. S1–S6 indicate an example numbering of samples isolated per patient. b, Heat maps representing log2[CPM] for NJs (rows) across five intratumoural regions in COAD, KICH, LIHC and STAD, with tumour-wide NJs highlighted in yellow. c, Heat map illustrating the proportion of intratumoural regions with detectable NJ expression (rows) in LIHC (left), PRAD (centre) and MESO (right). Each column represents a single patient. d, Three-dimensional brain and tumour (yellow) models for patient 470. Approximately 10 spatially mapped and maximally distanced biopsies (blue) were taken in each tumour (refer to Supplementary Video 1). e, Heat map of NJ (rows) expression across glioma subtypes: IDHwt (blue), IDHmut-A (yellow) and IDHmut-O (red). Columns represent patients, and cell intensity indicates the percentage of intratumoural regions expressing each NJ. f,g, NJ ITH in gliomas (n = 789) shown using a bar plot (f) and parts-of-whole chart (g). NJs are classified as: tumour-wide (100% intratumoural regions, red), highly conserved (>70%, orange), moderately conserved (>30% to ≤70%, yellow), or weakly conserved (≥1 region but ≤30%, green). In f, the data are represented as box plots, in which the median line represents the 50th percentile. Further statistical details are provided in Supplementary Table 3. a, Created in BioRender (credit: D.W.K., https://BioRender.com/h58s281; 2024).
Fig. 3
Fig. 3. Tumour subtypes demonstrate differential NJ expression.
a,b, Density (left) and box (right) plots showing the total putative NJs expressed in IDHmut (orange) and IDHwt (green) cases in TCGA GBM and LGG (IDHwt, n = 166; IDHmut, n = 263; a) and spatially mapped GBM and LGG data (IDHwt, n = 258; IDHmut, n = 277; b). c,d, Histograms and box plots depicting NJ counts in IDHwt (blue), IDHmut-A (yellow), and IDHmut-O (red) in TCGA GBM and LGG (c) and in-house GBM and LGG datasets (d). e,f, Volcano plots illustrating significantly upregulated (P < 0.05 and NES > 1, blue) and downregulated (P < 0.05 and NES < –1, red) gene sets comparing IDHmut-O versus IDHwt (left), IDHmut-A versus IDHwt (centre), and IDHmut-O versus IDHmut-A (right). GOBP (e) and Gene Ontology Cellular Component (f) gene sets were investigated. Splicing-related gene sets are denoted in yellow. NES, normalized enrichment score. g,h, Box-and-whisker plots depicting log2[RNA-seq by expectation–maximization (RSEM)] of splicing-related genes from GOBP sets with significant (P < 0.05) log2[fold expression] differences: increased (log2[fold increase] ≥ 1.5) between IDHmut-A (yellow) and IDHmut-O (red) cases when compared to IDHwt cases (blue) (g) and decreased (log2[fold decrease] ≤ 1.5) between IDHmut-O when compared to IDHmut-A and IDHwt cases (h). i,k, Pearson correlation of glioma-specific NJs against CELF2 (i), SNRPD2 (k, left) and SF3A3 (k, right) in IDHmut-O (z axis), IDHmut-A (y axis) and IDHwt (x axis) cases. NJs with correlations of ≥0.10 (purple) or ≤−0.10 (yellow) are highlighted, with NJACAP2 (i,k (left)) and NJPEA15 (k, right) analysed. j,l, Expression of splicing-related genes was assessed in LGG (SF10417; j) or GBM (GBM115; l) cell lines transduced with dCAS9–KRAB and control single guide RNAs (sgRNAs; n = 6), CELF2 sgRNAs (j) SNRPD2 sgRNAs (l, left, n = 3) or SF3A3 sgRNAs (l, right, n = 3). m,n, Box plots (left) and heat maps (right) showing NJ expression per case and Wilcoxon rank-sum test results across iCluster (C) subtypes in TCGA LIHC (iCluster 1, n = 65; iCluster 2, n = 55; iCluster 3, n = 63) (m) and LUAD (iCluster 1, n = 26; iCluster 2, n = 19; iCluster 3, n = 47; iCluster 4, n = 31; iCluster 5, n = 18; iCluster 6, n = 61) (n). Further statistical details are provided in Supplementary Table 3. NS, not significant; **P < 0.01; ***P < 0.001; ****P  < 0.0001.
Fig. 4
Fig. 4. TCRs specifically react to NEJ-derived neoantigens.
a, Pipeline overview for identifying T cell populations reactive to NEJ-derived neoantigen through IVS of CD8+ T cells derived from PBMCs from healthy donors against APC-presented neopeptides. b, IFNγ ELISA of reactive CD8+ T cell populations (n = 3) following IVS with neoantigen. c, 10× V(D)J sequencing shows IFNG signatures of highly proliferated TCR clonotypes cultured with T2 cells pulsed with neoantigen (coloured), control peptide (light grey) or no peptide (dark grey). Specific TCR clonotypes are highlighted for NeoARPL22 and NeoAGNAS reactivity in donors 3 (left) and 4 (centre and right). d, Clonotype frequency analysis of TCR clones in CD8+ T cells from donors 3 (left) and 4 (centre and right) following IVS with NeoARPL22 or NeoAGNAS. Neoantigen-reactive TCR clones are denoted by text. e, NeoAGNAS-specific (top) and NeoARPL22-specific (bottom) TCR-transduced PBMC-derived CD8+ T cells were activated against neoantigen-pulsed T2 cells in a dose-dependent manner. TCR-transduced cells were also co-cultured with control-peptide-pulsed T2 cells at the highest dose concentration (1 μM). PBMC-derived CD8+ T cells were stained with CD107a and CD137 antibodies, and surface expression of the TCR coactivation markers was analysed by flow cytometry. The percentages of activated (CD107a and CD137 antibody-stained) CD8+ T cells detected in flow analysis are indicated by the numbers within the box. f, IFNγ ELISA (n = 3) of NeoAGNAS-reactive (top) and NeoARPL22-reactive (bottom) TCR-transduced CD8+ T cells co-cultured with dose-dependent neoantigen (neo)-pulsed (left) and control-peptide-pulsed T2 cells (right). g, NeoAGNAS-specific (top) and NeoARPL22-specific (bottom) TCR-transduced triple-reporter Jurkat76 cells were co-cultured with non-pulsed T2 cells (left), 0.1 μM neoantigen-pulsed T2 cells (centre) or 0.1 μM neoantigen-pulsed T2 cells treated with pan-HLA class I blocking antibody (right). Cells were stained with CD3 antibody, and TCR activation was evaluated by NFAT–GFP activity. The percentages of CD3+ and NFAT-GFP+ TR Jurkat76 cells detected in flow analysis are indicated by the numbers within the box. h, NeoAGNAS-dextramer staining of bulk CD8+ T cells derived from an HLA-A*02:01 healthy donor (left) and patients with glioma (right) following two cycles of NeoAGNAS IVS. Further statistical details are provided in Supplementary Table 3. a, Created in BioRender (credit: D.W.K., https://BioRender.com/z79j394; 2024).
Fig. 5
Fig. 5. NEJ-derived neoantigens elicit TCR-mediated tumour-specific killing through HLA presentation.
a, Pipeline overview for validating endogenous proteolytic cleavage and subsequent HLA presentation. HLA-null APCs (COS-7) were electroporated with mRNAs encoding full-length (FL) mutant protein or neoantigen n-base polypeptides alongside HLA-A*02:01. TCR activation was quantified using neoantigen-specific TCR-transduced triple-reporter Jurkat76 or CD8 cells through flow cytometry. HLA-I-bound peptides were validated by immunoprecipitation with tandem MS. b,c, NFAT–GFP flow cytometry results showing TCR activation of NEJGNAS-specific (b) and NEJRPL22-specific (c) triple-reporter Jurkat76 cells co-cultured with COS-7 cells expressing the mutant n-base-polypeptide sequence and HLA-A*02:01 (centre), full-length mutant gene and HLA-A*02:01 (right), or neither (left). The percentages of CD3+ and NFAT-GFP+ TR Jurkat76 cells detected in flow analysis are indicated by the numbers on the plot. d,e, MS spectra confirming HLA-A02:01-bound NEJGNAS-derived (d (top),e) and NEJRPL22-derived (d, bottom) neoantigens in transfected COS-7 cells (d) and non-transfected GBM115 tumour cells (e). f, Cytotoxic killing of GBM115 cells by NEJGNAS-derived (left; coloured), NEJRPL22-derived (right; coloured) neoantigen-specific TCR-transduced, non-transduced (grey) CD8+ T cells, or no CD8+ T cells (black) (n = 3) using an xCELLigence assay. Tumour cell death is shown as a reduction in cell index, with T cells killing both untreated and peptide-pulsed tumour cells. TCR-transduced CD8+ T cells were co-cultured with GBM115 tumour cells that were untreated (red) or pulsed with 0.1 μM of the corresponding neoantigen peptide (blue). g, xCELLigence live-cytotoxicity assay of CD8+ T cells co-cultured with GBM115 tumour cells incubated with anti-HLA-I antibody (yellow, n = 3), isotype control antibody (purple, n = 3) or 1 nM of the neoantigen peptide (blue, n = 3). NEJGNAS-specific (left) and NEJRPL22-specific (right) CD8+ T cells were cultured against GBM115. h, xCELLigence live-cytotoxicity assay of HLA-A*02:01, parental GBM39 cells (left) or HLA-A*02:01-transduced GBM39 cells (right) co-cultured with non-transduced or NEJGNAS-TCR-transduced CD8+ T cells (n = 3). i, ELISA readout of secreted granzyme B by NEJGNAS-specific (purple) or non-transduced (grey) CD8+ T cells when cultured with tumour cell lines (n = 3). Further statistical details are provided in Supplementary Table 3. a, Created in BioRender (credit: D.W.K., https://BioRender.com/x48d520; 2024).
Extended Data Fig. 1
Extended Data Fig. 1. Pan-cancer public NJs are characterized from TCGA.
A. TCGA RNA-seq data across multiple cancers (n = 12) were analyzed for non-annotated, protein-coding, and cancer-specific splicing junctions (GTEx positive sample rate <1%; NJs). Interpatiently conserved (TCGA positive sample rate ≥ 10%; public NJs) were retained for downstream analysis of ITH. Tumors with sequencing data extracted from multiple intratumoral regions were used to evaluate each public NJ’s ITH. Independent prediction algorithms were used to assess proteasomal processing and MHC-I binding of peptide sequences translated from public, intratumorally conserved NJs. The expression of these NJs and their peptide derivatives were validated by RNA-seq and MS analysis of patient-derived tumor samples and cell lines. T-cell receptors (TCRs) were cloned and characterized for top predicted candidates through in vitro sensitization of PBMC-derived CD8+ T-cells against the corresponding neoantigen-pulsed antigen-presenting cells and subsequent 10x V(D)J single-cell sequencing. Transduction of these neoantigen-reactive TCR sequences in TCR-null Jurkat76/CD8 cells and PBMC-derived CD8+ T-cells allowed the demonstration of neoantigen-specific reactivity and tumor-specific killing. B. Total number of non-annotated, protein-coding junctions detected pan-cancer. C. Total number of public (PSRTCGA ≥ 10%), non-annotated, protein-coding junctions detected pan-cancer. D. Dot plots representing the positive sample rate percentage of non-annotated, protein-coding junctions in all studied cancer types (COAD, GBM, KICH, KIRP, LGG, LIHC, LUAD, LUSC, MESO, PRAD, SKCM, STAD). NJs (PSRTCGA ≥ 10% and PSRGTEx < 1%) are denoted by colored dots. E-F. Bar plots illustrating the proportion of SNIPP-characterized NJs found in the IRIS (E) and MAJIQlopedia (F) databases. a, Created in BioRender (credit: D.W.K., https://BioRender.com/p64h129; 2024).
Extended Data Fig. 2
Extended Data Fig. 2. Intratumoral heterogeneity and interpatient characteristics of NJs across various cancer types.
A. Multi-region RNA-seq data of multiple cancer types were collected across various studies. Multi-region sampling is defined in studies in which multiple biopsies were isolated from the same tumor for downstream sequencing analyses. B. Counts per million (CPM) of non-annotated, protein-coding NJs across multi-region samples in LIHC, PRAD, MESO, GBM, and LGG cases. C. Heatmap illustrating the number of metastases within an SKCM patient (columns) that have a detectable expression of NJs (rows). The intensity of each cell indicates the proportion of regions within the same tumor that have putative expression of each NJ, with the intensity of 1 representing an NJ expressed in all metastases within a corresponding patient. D. Histogram of the number of multi-region sampled glioma cases with the corresponding number of tumor-wide NJs. E. Distribution of glioma-specific NJs (n = 789, columns) based on their ITH across patients. F. Total number of NJs found in n cores per patient (n = 52). G. Slope charts demonstrating patient-matched pairs (n = 52) of the number of NJs found in n cores compared to 10 cores. Paired t-test analysis was performed on all matched values, and the corresponding p-value is displayed above each slope chart iteration. H. Dot-plot with best-fitting curve mapping the p-values of all iterations of paired n core and 10 core comparisons. I-K. Percentage of NJs identified in primary tumors that were conserved in paired metastases (COAD, n = 1; PRAD, n = 1; SKCM, n = 2) (I), recurrence (COAD, n = 1; GBM, n = 3; LGG, n = 12; LIHC, n = 2; LUAD, n = 2) (J), and recurrence following temozolomide treatment with or without hypermutation (HM) (hypermutated, n = 16, non-hypermutated, n = 6) (K). Further statistical details are found in Supplementary Table 3.
Extended Data Fig. 3
Extended Data Fig. 3. Co-occurrence of somatic mutations in splicing-related genes.
A-C. Heatmaps showing the pairwise Pearson correlation matrix between gene expression of TCGA GBM and LGG samples computed for each gene pair. Splicing-related gene lists were defined by A. Nostrand et al., B. Sveen et al., and C. Seiler et al. D-F. Pie charts illustrating the proportions of IDHmut samples that also contain mutations in FUBP1 (D), SF3B1 (E), and NIPBL (F) in IDHwt GBM samples (bottom), IDHmut-A samples (top-left), and IDHmut-O samples (top-right). G-I. Binary heatmap demonstrating the putative expression of NJs in relation to glioma subtypes and mutation status of FUBP1 (G), SF3B1 (H), and NIPBL (I).
Extended Data Fig. 4
Extended Data Fig. 4. Glioma subtype-specific aberrations in splicing factor expression lead to differential levels of NJ expression.
A. Ranked log2 fold change of genes within the top enriched pathways within GOBP when comparing IDHmut-A samples against IDHwt samples. B. Ranked log2 fold change of genes within the top enriched pathways within GOBP when comparing IDHmut-O samples against IDHwt samples. C-E. Heatmap demonstrating hierarchal clustering of splicing-related genes (rows) in GOBP mRNA Processing (C), GOBP RNA Splicing (D), and GOBP RNA Splicing via Transesterification Reactions (E) in TCGA samples (columns) ordered by the total number of expressed putative NJs. Further statistical details are found in Supplementary Table 3.
Extended Data Fig. 5
Extended Data Fig. 5. Dysregulated expression of canonical splicing-related genes is associated with disease subtype-specific expression of NJs.
A. qPCR validation of target gene knockdown by CRISPRi was performed on glioma cell lines (n = 3). B-C. RNA-seq-derived (B) and qPCR (C) TPM expression of CELF2, SNRPD2, and SF3A3 following siRNA knockdown (n = 3). D. (Left) Expression of NJACAP2 in LGG (SF10417 and SF10602) cell line treated with control siRNA or siCELF2 (n = 3). (Right) Expression of NJACAP2 or NJPEA15 in GBM (GBM115) cell line treated with control siRNA or siSNRPD2 or siSF3A3, respectively (n = 3). E. Detection of glioma-derived IDHmut NJs in IDHmut TCGA LIHC (n = 4) and PRAD (n = 3) samples. F. Slope plots demonstrating a decrease in the frequency of IDHmut-specific NJs in CELF2 siRNA-treated SF10417 (left) and SF10602 cells (right). G. Correlation of IDHmut-specific splicing-related genes (right, n = 26) and chromosome 1p and 19q splicing-related genes (left, n = 25) with NJGNAS and NJRPL22. H. RNA-seq-derived read frequency of NJPEA15 and NJACAP2 in GBM115 cells (n = 3) treated with control siRNA and siSF3A3 (left) or control siRNA and siSNRPD2 (right), respectively. I. Slope plots demonstrating an increase in the frequency of IDHmut-O-specific NJs in SF3A3 siRNA- (left) and SNRPD2 siRNA-treated (right) GBM115 cells. J-M. Bar plot (left) showing the total NJs expressed per case across all disease subtypes and heatmap (right) displaying the Wilcoxon rank-sum test of NJ expression between each subtype within TCGA SKCM (BRAF, n = 150; RAS, n = 91; NF1, n = 26; Triple WT, n = 46) (J), KIRP (C1, n = 89; C2a, n = 34, C2b, n = 17; C2cCIMP, n = 9) (K), PRAD (ERG, n = 145; ETV1, n = 24; ETV4, n = 14; FLI1, n = 4; SPOP, n = 33; FOXA1, n = 8; IDH1, n = 2; other, n = 80) (L), KICH (Eosinophilic, n = 19; Classic, n = 43) (M). Further statistical details are found in Supplementary Table 3.
Extended Data Fig. 6
Extended Data Fig. 6. NJ-derived neoepitopes are predicted to be processed and presented by HLA.
A-B. Density plots depicting log2(CPM) of junction reads from RNA-seq in patient-derived GBM (A) and LGG (B) cell lines. Detectable NJ expression (colored) is validated against canonical splicing (gray). C. Read frequency spanning NJs in RPL22 and GNAS compared to the canonical junction spanning reads in glioma cell lines (n = 1). D. Density plot depicting MS analysis of publicly available LGG and GBM data sets (n = 447) reveals comparable log2(peak intensity) for NJ-derived peptides (purple) and endogenous peptides (gray). E-F. Mass spectra of peptide sequences spanning the aberrantly spliced regions in (E) RPL22 and (F) GNAS detected in publicly available glioma MS data. G. Proportion of MS-detected NJs that encode for frame-shift or in-frame mutations. H. Schematic of the selection of 192 high-confidence NJs based on RNA-seq and MS detection. I. Diagram illustrating a mechanism of neoantigen production and peptide bank generation for prediction analysis. J. Schematic depicting biological steps leading to the generation of HLA class I-presented antigens. SSNIP considers the pre-presentation steps of proteasomal processing and HLA-binding. K. Dot plot showing the overlay of the top scoring 1-percentile of HLAthena and MHCflurry 2.0 algorithms against neopeptide candidates presented by all demographically predominant HLA-A haplotypes. Top-scoring final candidates are indicated in blue as the candidates that scored in the top 1 percentile in both algorithms. L. Pie chart illustrating the distribution of neopeptide candidates found in the overlapping top 1 percentile based on composite HLA-A haplotype score. M-N. Histogram of peptide presentation likelihood scores for all top 1-percentile n-base polypeptides categorized by HLA-allele (M) or n-base polypeptides length (N), and varying n-base polypeptides lengths in HLAthena (O) and MHCflurry 2.0 (P). Q. Dot plot overlaying top 1-percentile candidates from two algorithms, highlighting final candidates (blue) scoring highly in both. j, Created in BioRender (credit: D.W.K., https://BioRender.com/r01o115; 2024).
Extended Data Fig. 7
Extended Data Fig. 7. NEJs generate a diverse portfolio of splicing aberrations capable of generating presentable neoepitopes.
A. Jitter plot corresponding to the average presentation scores of peptides derived from NEJs generating frameshifts or in-frame mutations. B. Jitter plot corresponding to the average presentation scores of peptides derived from NEJs derived from various splice types. C-D. Box-and-whisker plots illustrating composite presentation scores of candidates by HLA-allele (HLA-A*01:01, n = 117; HLA-A*02:01, n = 276; HLA-A*03:01, n = 294; HLA-A*11:01, n = 440; HLA-A*24:02, n = 230) based on frame-shift status (frame-shift, n = 893; in-frame, n = 464) (C) or alternative splicing category (alternative 3’ splice site gain, n = 267; alternative 3’ splice site loss, n = 518; alternative 5’ splice site gain, n = 275; alternative 5’ splice site loss, n = 119; exon skip, n = 37; junction within exon, n = 43; junction within intron, n = 38; others, n = 60) (D). E-F. Density plots depicting the average presentation scores of neoantigens derived from NJs generating (E) frame shifts (FS) or (F) various splice types presented by HLA-A*01:01, HLA-A*02:01, HLA-A*03:01, HLA-A*11:01, and HLA-A*24:02. G. Composite presentation scores for validated n-base polypeptides detected in RNA-seq and MS data. H. Schematic of final NEJ derivation, focusing on top HLA-A*02:01-presented candidates. I. Heatmap illustrating intratumoral heterogeneity of final candidate HLA-A*02:01-presented NJs across all spatially-mapped glioma samples. Glioma subtypes analyzed in this study include IDHwt (blue), IDHmut-A (yellow), IDHmut-O (red). J. AlphaFold2 protein structure prediction of wildtype RPL22 (top) and NEJ variant of RPL22 (bottom).
Extended Data Fig. 8
Extended Data Fig. 8. Neoantigen-reactive T-cell clones are isolated from PBMC and elicit an immune response upon neoantigen recognition.
A. Pipeline for validating the specificity of neoantigen-reactive TCR clonotypes found in 10x V(D)J single-cell RNA-seq (scRNA-seq) against NJ-derived neoantigen candidates utilizing a TCR-transduced triple-reporter Jurkat76/CD8 system followed by flow cytometry analysis. B-D. NEJGNAS-derived and NEJRPL22-derived neoantigen-specific TCR-transduced triple-reporter Jurkat76 cells activated against dose-dependent neoantigen-pulsed T2 cells. TCR activation of triple-reporter TCR-transduced triple-reporter Jurkat76 is measured by flow cytometry analysis of (B) NFAT-GFP, (C) AP-1-mCherry, and (D) NFκB-CFP. a, Created in BioRender (credit: D.W.K., https://BioRender.com/z56q380; 2024).
Extended Data Fig. 9
Extended Data Fig. 9. High-affinity neoantigen-reactive T-cell receptors recognize cancer-specific neoantigen sequences.
A. TNFα expression of PBMC-derived CD8+ T-cells (n = 3) transduced with TCRG4.1 (top) and TCRR3.9 (bottom) against T2 cells pulsed with varying concentrations of corresponding neoantigen or decoy antigen. B. Alanine scanning mutagenesis of NeoAGNAS (top) and NeoARPL22-reactive (bottom) TCR-transduced triple-reporter Jurkat76/CD8 cells co-cultured with alanine-substituted neoantigen-pulsed T2 cells (n = 3), neoantigen-pulsed T2 cells (n = 3), or non-pulsed T2 cells (n = 3). Flow analysis was performed to evaluate TCR activity through NFAT-GFP (left), AP-1-mCherry (center), and NFκB-CFP (right) activity.
Extended Data Fig. 10
Extended Data Fig. 10. NeoAGNAS-specific cytotoxicity by NEJGNAS-specific TCR-transduced CD8+ T-cells.
A. NeoAGNAS-specific TCR-transduced (colored), or non-transduced (gray) CD8+ T-cells cultured against GBM102 (left), RPMI-7951 (center), and WM-266-4 (right) on the xCELLigence plate platform. The assay was performed at an E:T ratio of 2:1. Cytotoxic killing was determined as the reduction of cell index compared to the control co-cultures with non-transduced CD8 + T-cells (gray) or no CD8+ T-cell introduction (black) at a given time point. (n = 3) B. Representative flow gating of surface CD137 expression in non-transduced (top) and TCR-transduced (bottom) CD8 + T-cells co-cultured against cancer cell lines. C. Gating strategy for flow cytometry experiments. Further statistical details are found in Supplementary Table 3. D. Bar plot of the surface expression of CD137 on NeoAGNAS-TCR-transduced (red) or non-transduced (gray) CD8+ T-cells when cultured with tumor cell lines (n = 3). E-F. ELISA readout of secreted IFNγ (E), IL-2 (F), and TNFα (G) by NeoAGNAS-TCR-transduced (colored) or non-transduced (gray) CD8+ T-cells when cultured with tumor cell lines (n = 3). Further statistical details are found in Supplementary Table 3.

Update of

References

    1. Weber, E. W., Maus, M. V. & Mackall, C. L. The emerging landscape of immune cell therapies. Cell181, 46–62 (2020). - PMC - PubMed
    1. Touat, M. et al. Mechanisms and therapeutic implications of hypermutation in gliomas. Nature580, 517–523 (2020). - PMC - PubMed
    1. Russo, M. et al. Adaptive mutability of colorectal cancers in response to targeted therapies. Science366, 1473–1480 (2019). - PubMed
    1. Kim, C. et al. Chemoresistance evolution in triple-negative breast cancer delineated by single-cell sequencing. Cell173, 879–893 (2018). - PMC - PubMed
    1. Scholler, J. et al. Decade-long safety and function of retroviral-modified chimeric antigen receptor T cells. Sci. Transl. Med.4, 132ra53 (2012). - PMC - PubMed

Substances