. 2025 Apr;5(4):588-606.
doi: 10.1038/s43587-024-00801-1. Epub 2025 Feb 19.

Paracrine FGF21 dynamically modulates mTOR signaling to regulate thymus function across the lifespan

Affiliations

Paracrine FGF21 dynamically modulates mTOR signaling to regulate thymus function across the lifespan

Sarah A Wedemeyer et al. Nat Aging. 2025 Apr.

Abstract

Consequences of age-associated thymic atrophy include declining T-cell responsiveness to pathogens and vaccines and diminished T-cell self-tolerance. Cortical thymic epithelial cells (cTECs) are primary targets of thymic aging, and recent studies suggested that their maintenance requires mTOR signaling downstream of medullary TEC (mTEC)-derived growth factors. Here, to test this hypothesis, we generated a knock-in mouse model in which FGF21 and mCherry are expressed by most mTECs. We find that mTEC-derived FGF21 promotes temporally distinct patterns of mTORC1 and mTORC2 signaling in cTECs, promotes thymus and individual cTEC growth and maintenance, increases T-cell responsiveness to viral infection, and diminishes indicators of peripheral autoimmunity in older mice. The effects of FGF21 overexpression on thymus size and mTOR signaling were abrogated by treatment with the mTOR inhibitor rapamycin. These results reveal a mechanism by which paracrine FGF21 signaling regulates thymus size and function throughout the lifespan, as well as potential therapeutic targets for improving T-cell function and tolerance in aging.


Conflict of interest statement

Competing interests: The authors declare no competing interests.

Figures

Extended Data Fig. 1:
Extended Data Fig. 1:. Differential Lpo expression among TEC subsets during first year of life.
Lpo relative expression levels and frequencies among 9 distinct TEC populations (proliferating TEC (MHC-II+, Ly6d), tuft-like mTEC (Avilhi, Trpm5hi), post-Aire mTEC (Krt80hi, Spink5hi), mature mTEC (Airehi, Cd52hi), intertypical TEC (Ccl21ahi, Krt5hi), perinatal cTEC (Syngr1hi, Gper1hi), mature cTEC (Prss16hi, Cxcl12hi), neural TEC/nTEC (Sod3hi, Dpthi), structural TEC/sTEC (Cd177hi, Car8hi) were obtained from the thymi of mice aged 1, 4, 16, 32, and 52 weeks using a previously published scRNA-seq dataset.
Extended Data Fig. 2:
Extended Data Fig. 2:. Prioritization of Lpo, Lpo-Fgf21-mCh mutation sequence, strain creation information, and genotyping validation.
a, Lpo-Fgf21-P2A-mCh donor DNA sequence. b, To identify proper locus integration of the donor foreign DNA in newborn mice, PCR was performed using primers flanking outside of the 5’ and 3’ homology arms of the donor DNA (5’ primer sequence: CTCCCAGACTTAACCAGCTGCTG; 3’ primer sequence: GCTTGAAGGGTTCCAAGAACTGTCC). c, PCR verification of knock-in mutation insertion in Sanger sequence-verified founders. Samples #1–4 show positive PCR using primers that flank Fgf21-P2A-mCherry (predicted size 1620 bp). Samples #1–3 also show amplification of the WT band (predicted size 174 bp), indicating that these mice are heterozygous. Image shown is a representative example from three independent experiments.
Extended Data Fig. 3:
Extended Data Fig. 3:. Changes in mCherry expression among mTEC subsets with aging in LPOFGF21 knock-in mice.
a, Representative mCherry fluorescence in freshly isolated total mTEC (CD45.2, EpCAM+, Ly51), UEA1+ mTEC (CD45.2, EpCAM+, Ly51, UEA1+), mTEClo (CD45.2, EpCAM+, Ly51, MHCIIlo, CD80lo), mTEChi (CD45.2, EpCAM+, Ly51, MHCIIhi, CD80hi) from LPOWT (left) and LPOFGF21 (right) mouse thymus after enzymatic digestion and mechanical lymphocyte depletion. b, The frequency of mCherry+ cells among indicated mTEC subsets was quantified in 1-month-old (n=5) and 6–8-month-old (n=3) LPOFGF21 KI mice. c, mCherry MFI in mTEC subsets from 1-month-old (n=5) and 6–8-month-old (n=3) LPOFGF21 mice were normalized to MFI from age-matched LPOWT control (n=4) samples. For (b,c) data were analyzed by two-sided Student’s t-test. ns= p≥0.05, *=p < 0.05. Mean and SEM indicated by horizontal lines. Each symbol represents an individual mouse. Data are representative of two independent experiments.
Extended Data Fig. 4:
Extended Data Fig. 4:. Lactoperoxidase drives broad and specific expression of the LPOFGF21 KI allele in mTEC and salivary gland.
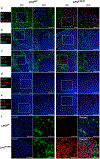
a-e, Representative confocal microscopy images of thymic mCherry expression (red) at 10x and 20x magnification from LPOWT (left) (n=3) and LPOFGF21 (right) (n=3) sex-matched 1-month-old mice. Thymic sections were co-stained with DAPI (blue), (a) anti-cytokeratin 8 and 5, (b) anti-DEC-205, (c) anti-Ly51, (d) UEA1, and (e) anti-Aire (green). Whole thymi were fixed in 2% paraformaldehyde overnight, followed by a 10–20% sucrose gradient overnight. 10 micron sections were blocked in 5% FBS in PBS for 5 minutes, prior to costaining. A-E represent separately stained sections. Identical laser settings were used to detect endogenous mCherry signal. Scale bar= 100 μm (10x), 50 μm (20x). f, Whole salivary glands were obtained from 1-month-old LPOWT (top) and LPOFGF21 (bottom) mice (n=4 per group) and fixed with 4% paraformaldehyde prior to immunostaining with anti-LPO/Goat anti-Rabbit Alexa 488 (green). Colocalization of LPO with mCherry (endogenous) from representative images is shown. Images taken at 20x magnification. Scale bar= 50 μm.
Extended Data Fig. 5:
Extended Data Fig. 5:. Fgf21 expression is increased over four-fold in LPOFGF21 KI mTEC and salivary gland, but Lpo transcription and peripheral FGF21 production are unaffected.
a-c, Expression of (a) Lpo, (b) Fgf21, and (c) mCherry mRNA was determined in sorted mTEC, or whole salivary gland, liver, and lung tissues from 1-month-old LPOWT and LPOFGF21 KI littermates (n=5 per group) via qPCR. Approximately 5,000–10,000 mTECs (CD45.2, EpCAM+, Ly51) per mouse were sorted from single cell suspensions enriched for thymic stromal cells via collagenase digestion. Relative expression of each gene to Hprt (2-ΔCq) is plotted. Expression of each gene was compared between LPOWT and LPOFGF21 KI samples in each tissue using two-tailed Student’s t-tests. **= p<0.01, ***= p<0.001. Mean and SEM are indicated by horizontal lines. Each symbol represents an individual mouse. d-f, Expression of (d) Klb, (e) Fgfr1, and (f) Fgfr3 mRNA was determined in sorted thymic macrophages (CD19, CD11b+, F4/80+) (n=3 biological replicates), fibroblasts (CD45, EpCAM, CD31, gp38+) (n=3), and mTECs (CD45.2, EpCAM+, Ly51) (n=6), CD4 CD8 DN (n=3), CD4+ SP (n=3), CD8+ SP (n=3), and CD4+ CD8+ DP (n=3) thymocytes, as well as whole white adipose tissue (WAT) (n=3), liver (n=3), and pancreas (n=3) from 6-month-old C57BL/6 mice. Relative expression of each gene to Hprt (2-ΔCq) is plotted. nd= not detected. Mean and SEM are indicated by horizontal lines. Each symbol represents an individual mouse. g,h, FGF21 circulating levels in serum (g) (n=10 per group) and in whole thymus tissue (h) (n=3 per group) were measured via ELISA in 1-month-old and 13-month-old LPOWT and LPOFGF21 KI mice. For (g,h) data were analyzed via Student’s two-tailed t-test. ns= p≥0.05. Mean and SEM indicated by horizontal lines. Each symbol represents an individual mouse. i, Body weight was not found to vary significantly between LPOWT and LPOFGF21 mice at 3 weeks (n=7 LPOWT, n=8 LPOFGF21), 5 weeks (n=8 per group), 2–3 months (n=11 LPOWT, n=8 LPOFGF21), 7–8 months (n=12 LPOWT, n=6 LPOFGF21), 10–12 months (n=10 per group), 15–16 months (n=5 LPOWT, n=6 LPOFGF21), and 18–21 months (n=4 LPOWT, n=5 LPOFGF21) of age (n=4–12 mice per group). Data are aggregated from males and females. Mean and SEM are indicated by horizontal lines. Each symbol represents an individual mouse. Data were analyzed by two-sided Student’s t-test. p≥0.05= ns.
Extended Data Fig. 6:
Extended Data Fig. 6:. mTEC-driven FGF21 overexpression in LPOFGF21 KI mice promotes increased thymus size and thymocyte/TEC output in male mice during aging.
a, Total thymus cellularity was compared LPOWT and LPOFGF21 male KI mice at 1 month (n=8 LPOWT, n=5 LPOFGF21), 3 months (n=7 per group), and 12 months (n=8 LPOWT, n=7 LPOFGF21) of age. b,c, Thymocyte CD4CD8 DN, CD4+CD8+ DP, CD4+ SP, and CD8+ SP subset frequency (b) and total cell number (c), as well as the frequency and total number of cTEC (CD45.2, EpCAM+, Ly51+) and mTEC (CD45.2, EpCAM+, Ly51), were quantified in 1-month-old (n=5 LPOWT, n=6 LPOFGF21) (top) and 12–14-month-old (n=5 LPOWT, n=4 LPOFGF21) (bottom) male LPOWT and LPOFGF21 KI mice. For (a-c) data were analyzed via two-sided Student’s t-tests. ns= p≥0.05, *= p<0.05, **= p<0.005, ***= p<0.001, ****= p<0.0001. Mean and SEM are indicated by horizontal lines. Each symbol represents an individual mouse. Data are representative of three or more experiments.
Extended Data Fig. 7:
Extended Data Fig. 7:. TEC proliferation and apoptosis are similar between LPOWT and LPOFGF21 mice.
a, Representative gating strategy showing identification of proliferating (Ki67+) cTECs (CD45.2, EpCAM+, Ly51+) and mTECs (CD45.2, EpCAM+, Ly51) among 3-month-old LPOWT and LPOFGF21 mice (n=5 per group) via flow cytometry. b, The frequency of Ki67+ cTECs and mTECs was compared between 3-month-old LPOWT and LPOFGF21 mice (n=5 per group). c, Representative gating strategy showing identification of apoptotic (LIVE DEAD Blue, Annexin V+) cTECs and mTECs among 3-month-old LPOWT and LPOFGF21 mice (n=5 per group). d, The frequency of Annexin V+ cTECs and mTECs was compared between 3-month-old LPOWT and LPOFGF21 mice (n=5 per group). Data in (b) and (d) were analyzed by two-sided Student’s t-test. ns= p≥0.05. Mean and SEM indicated by horizontal lines. Each symbol represents an individual mouse. Data are representative of two independent experiments.
Extended Data Fig. 8:
Extended Data Fig. 8:. Both mTORC1/2 activity in cTECs are temporally regulated by FGF21 overexpression in male LPOFGF21 KI mice, but only mTORC1 activity is dynamically regulated in mTECs.
a,b, p4EBP1 (a) and pAktS473 (b) MFI were measured in cTECs (CD45.2, EpCAM+, Ly51+) from LPOWT and LPOFGF21 male mice at 2.5 weeks (n=3 LPOWT, n=5 LPOFGF21), 3 months (n=4 per group), and 12 months (n=6 LPOWT, n=4 LPOFGF21) of age. c-f, p4EBP1 (c,e) and pAktS473 (d,f) MFI were measured in mTECs (CD45.2, EpCAM+, Ly51) and lymphocytes (CD45.2+, EpCAM) from LPOWT and LPOFGF21 mice at 2.5 weeks (n=5 LPOWT, n=6 LPOFGF21), 3 months (n=5 per group), and 12 months (n=8 per group) of age. Data in a-f were analyzed via student’s two-tailed t-test. ns= p≥0.05, *= p<0.05, **= p<0.01. Mean and SEM indicated by horizontal lines. Each symbol represents an individual mouse. Data are representative of three or more experiments.
Extended Data Fig. 9:
Extended Data Fig. 9:. LPOFGF21 KI mice are protected from IAV PR8-induced body weight loss.
18-month-old LPOWT and LPOFGF21 KI mice (n=5 per group) were infected with 1000 PFU IAV PR8 via intranasal infection. Overall % body weight lost throughout the course of infection was determined by comparing body weight at 0–11 dpi from baseline body weight. % Baseline body weights were compared at each day via student’s two-tailed t-test. *= p=0.0137 (Day 11). **=p=0.0060 (Day 7), p=0.0025 (Day 9). Mean and SEM indicated by horizontal lines. Data are representative of two independent experiments.
Extended Data Fig. 10:
Extended Data Fig. 10:. Age-associated changes in peripheral CD8 TCR repertoire diversity are similar between LPOWT and LPOFGF21 mice.
a, Representative gating strategy showing identification of Vβ2+, Vβ7+, Vβ8+, and Vβ11+ CD8+ T cells from peripheral blood lymphocytes isolated from 1-month-old and 11-month-old LPOWT and LPOFGF21 mice. b-e, The frequency of (b) Vβ2+, (c) Vβ7+, (d) Vβ8+, and (e) Vβ11+ CD8+ T cells was compared between 2-month-old and 12-month-old LPOWT and LPOFGF21 mice (n=3 per group). Data were analyzed by one-way ANOVA followed by Tukey’s multiple comparisons test. ns= p≥0.05. Mean and SEM indicated by horizontal lines. Each symbol represents an individual mouse. Data are representative of two independent experiments.
Fig. 1 |
Fig. 1 |. Characterization of Fgf21 expression in TECs and identification of Lpo as an appropriate candidate for driving broad, constitutive Fgf21 expression in mTECs throughout the lifespan.
a, Fgf21 relative expression levels (log-normalized within population, indicated by color) and frequencies of cells with non-zero expression values within each subset (indicated by symbol size) among nine distinct TEC populations (proliferating TEC (MHC-II+, Ly6d), tuft-like mTEC (Avilhi, Trpm5hi), post-Aire mTEC (Krt80hi, Spink5hi), mature mTEC (Airehi, Cd52hi), intertypical TEC (Ccl21ahi, Krt5hi), perinatal cTEC (Syngr1hi, Gper1hi), mature cTEC (Prss16hi, Cxcl12hi), neural TEC/nTEC (Sod3hi, Dpthi), and structural TEC/sTEC (Cd177hi, Car8hi) were obtained from the thymi of mice aged 1, 4, 16, 32, and 52 weeks using a previously published scRNA-seq dataset. b, Changes in relative abundance of TEC populations described in a present in the mouse thymus from the early postnatal period (1–4 weeks) to 1 year of age. c, Schematic diagram outlining the selection criteria for prioritizing candidate pan-mTEC genes. Top candidates were selected using a published transcriptional database consisting of global transcriptional profiles generated from cortical and medullary lymphocytes and microdissected whole cortical and medullary tissue (GEO: GSE132136). Aire-dependent genes were excluded based on previous published Aire-regulated gene lists,. The candidate genes were ranked using gene expression levels (gcrma values) and intensity skew (based on BioGPS expression values), followed by immunofluorescence microscopy validation to identify expression patterns in thymus). IF, immunofluorescence. d, Frozen 5 μm sections from 3-month-old and 12-month-old C57BL/6 mouse thymi (n = 3 per group) were co-stained with DAPI, anti-LPO/Goat anti-Rabbit Cy5 (red), and anti-EpCAM (CD326) A488 (green). Representative images are shown at ×20 magnification. Scale bars, 50 μm. e, Schematic diagram of the Lpo–Fgf21–mCherry KI allele. A bicistronic vector was designed allowing for the insertion of Fgf21 and mCherry cDNA at the end of exon 13 of the Lpo gene through incorporation of P2A and T2A peptide sequences. Ex, exon; UTR, untranslated region; HA, homology arm.
Fig. 2 |
Fig. 2 |. Flow cytometric evaluation of mCherry expression in the LPOFGF21 KI thymus confirms broad and specific expression of the KI allele in mTEC subsets.
a, Flow cytometry gating strategy (pre-gated on viable singlets) used for the identification of cTEC (CD45.2, EpCAM+, Ly51+, UEA1), total mTEC (CD45.2, EpCAM+, Ly51, UEA1+), mTEClo (CD45.2, EpCAM+, Ly51, MHCIIlo, CD80lo), mTEChi (CD45.2, EpCAM+, Ly51, MHCIIhi, CD80hi), cDC (CD45.2+, CD11c+, B220), pDC (CD45.2+, CD11c+, B220+), endothelial cell (EC) (CD45.2, EpCAM, CD31+), pericyte (PC) (CD45.2, EpCAM, CD31, PDGFRαβ+, CD146+, gp38), and fibroblast (Fb) (CD45.2, EpCAM, CD31, PDGFRαβ+, CD146, gp38+) subsets from thymi of the indicated mice after enzymatic digestion and stromal cell enrichment. FSC-A, forward scatter area; I-A/I-E, MHCII. b, Representative histograms of mCherry expression among mTEC, DC, endothelial, and mesenchymal subsets of 1-month-old LPOWT (n = 4) and LPOFGF21 mice (n = 5). c, The frequency of mCherry+ cells among cTEC, mTEC, DC, endothelial, and mesenchymal subsets was quantified in LPOFGF21 KI mice (n = 5). Data among mTEC subsets were analyzed by one-way ANOVA followed by Tukey’s multiple comparisons test. Horizontal lines indicate significant comparisons among mTEC subsets. NS, P ≥ 0.05. Mean and s.e.m. indicated by horizontal lines. Each symbol represents an individual mouse. Data are representative of three independent experiments. d, Representative confocal microscopy images of thymic mCherry expression (red) at ×10 (left) and ×20 (right, magnified view of the indicated ×10 region) magnification from LPOFGF21 (n = 5) 1-month-old mice. Thymic sections were stained with anti-cytokeratin 5 A647. Scale bars, 100 μm (×10 magnification) and 50 μm (×20 magnification).
Fig. 3 |
Fig. 3 |. Overexpression of FGF21 in LPOFGF21 KI mTECs results in increased thymus size and diminishes age-associated thymic atrophy.
a, Thymus weight to body weight ratios (somatic index) of LPOWT and LPOFGF21 KI female mice at 1 month (n = 7 per group), 3 months (n = 5 per group), and 12 months of age (n = 6 per group). b, Total thymus cellularity was determined in LPOWT and LPOFGF21 KI female mice at 1 month (n = 8 LPOWT, n = 7 LPOFGF21), 3 months (n = 9 LPOWT, n = 8 LPOFGF21), and 12 months of age (n = 9 LPOWT, n = 7 LPOFGF21). c,d, Thymocyte CD4CD8 DN, CD4+CD8+ DP, CD4+ SP, and CD8+ SP subset frequency (c) and total cell number (d), as well as the frequency and total number of cTEC (CD45.2, EpCAM+, Ly51+) and mTEC (CD45.2, EpCAM+, Ly51), were quantified in 1-month-old (n = 6 LPOWT, n = 10 LPOFGF21) (top) and 13-month-old (bottom) (n = 5 LPOWT, n = 6 LPOFGF21) LPOWT and LPOFGF21 KI female mice. Data were analyzed via two-sided Student’s t-tests in ad. NS, P ≥ 0.05; *P < 0.05; **P < 0.005; ***P < 0.001; ****P < 0.0001. Mean and s.e.m. are indicated by horizontal lines. Each symbol represents an individual mouse. Data are representative of three or more experiments.
Fig. 4 |
Fig. 4 |. mTORC1 and mTORC2 activity in cTECs are distinctly and dynamically regulated by paracrine FGF21 signaling during thymus growth and atrophy.
a,b, Representative histograms (top) and MFI (bottom, arbitrary units) of p4EBP1T36,T45 (a) and pAktS473 (b) in cTECs (CD45.2, EpCAM+, Ly51+), mTECs (CD45.2, EpCAM+, Ly51), and CD45.2+ lymphocytes from thymi of 3-week-old (n = 4) and 6-month-old (n = 6) C57BL/6 mice. Single-cell suspensions of enriched thymic stromal cells were stained with fluorescent antibodies targeting p4EBP1T36,T45 and pAktS473 following fixation and permeabilization. wk, weeks; mo, months. c,d, Representative histograms (top) and MFI (bottom, arbitrary units) showing p4EBP1T36,T45 (c) and pAktS473 (d) activation in cTEC of 2.5-week-old (n = 5 LPOWT, n = 6 LPOFGF21), 3-month-old (n = 4 LPOWT, n = 4 LPOFGF21), and 12-month-old (n = 4 LPOWT, n = 6 LPOFGF21) LPOWT and LPOFGF21 KI female mice. e, Representative histograms (left) and MFI (right) of TSC1 expression in cTECs from LPOWT mice at 2.5 weeks, 6 weeks, and 4 months of age (n = 4 per group). Data were analyzed via two-sided Student’s t-test in ad or one-way ANOVA with Tukey’s multiple comparisons test in e. NS, P ≥ 0.05; *P < 0.05; **P < 0.01; ***P < 0.001; ****P < 0.0001. Mean and s.e.m. indicated by horizontal lines. Each symbol represents an individual mouse. Data are representative of three or more experiments. f, Expression of manually curated mTORC1-(red/green) and mTORC2-(blue) regulated genes throughout course of post-castration regeneration is normalized to 12-month-old untreated thymus, which also represents day 0 of the regeneration sequence.
Fig. 5 |
Fig. 5 |. Pharmacological mTOR inhibition mitigates the impact of FGF21 overexpression on DP thymocyte number and mTORC1 signaling in cTECs.
a, Schematic of experimental approach. LPOWT and LPOFGF21 KI mice were treated with 4 mg kg−1 rapamycin or vehicle via intraperitoneal injection every other day for 2 weeks, beginning at the time of weaning (3 weeks of age). At the time of euthanasia, the thymus was collected, and subsequently thymus weight to body weight ratios, total thymus cellularity, thymocyte subset frequencies, and mTORC1/mTORC2 activation in cTECs, mTECs, and lymphocytes were determined. b, Thymus weight to body weight ratio was determined in LPOWT vehicle-treated (n = 4), LPOWT rapamycin-treated (n = 4), LPOFGF21 KI vehicle-treated (n = 4), and LPOFGF21 KI rapamycin-treated (n = 4) mice. c, Total thymus cellularity was estimated in LPOWT vehicle-treated (n = 4), LPOWT rapamycin-treated (n = 4), LPOFGF21 KI vehicle-treated (n = 4), and LPOFGF21 KI rapamycin-treated (n = 4) mice. d, Thymocyte CD4CD8 DN, CD4+CD8+ DP, CD4+ SP, and CD8+ SP subset frequency (top) and total cell number (bottom) were estimated in LPOWT vehicle-treated (n = 4), LPOWT rapamycin-treated (n = 4), LPOFGF21 KI vehicle-treated (n = 4), and LPOFGF21 KI rapamycin-treated (n = 4) mice. e,f, MFI (arbitrary units) of pS6S235–236 (e) and pAktS473 (f) in cTEC, mTEC, and CD45.2+ lymphocytes were measured in LPOWT vehicle-treated (n = 4), LPOWT rapamycin-treated (n = 4), LPOFGF21 KI vehicle-treated (n = 4), and LPOFGF21 KI rapamycin-treated (n = 4) mice. Data were analyzed via two-way ANOVA followed by Tukey’s multiple comparisons test in bf. NS, P ≥ 0.05; *P < 0.05; **P < 0.01; ***P < 0.001; ****P < 0.0001. Mean and s.e.m. are indicated by horizontal lines. Each symbol represents an individual mouse. Data are the result of two independent experiments. Schematic in a created in https://BioRender.com.
Fig. 6 |
Fig. 6 |. FGF21 overexpression in mTECs mitigates waning naive T-cell frequency and T-cell responsiveness to influenza infection in older mice.
a,b, Representative gating strategy showing isolation of CD62L+, CD44lo naive T cells and CD62L+, CD44hi memory T cells from CD3+, CD8+ (a) and CD3+, CD4+ (b) splenocytes in 2-month-old and 12-month-old LPOWT and LPOFGF21 mice. c,d, CD8+ (c) and CD4+ (d) naive to memory ratios were quantified in splenocytes of 2-month-old and 12-month-old LPOWT and LPOFGF21 mice (n = 6 per group). Data were analyzed via Student’s t-tests. NS, P ≥ 0.05; **P < 0.01. e, Schematic diagram showing influenza infection timeline; 12-month-old LPOWT (n = 6) and LPOFGF21 (n = 6) mice were infected with 1,000 p.f.u. influenza A X31 virus via intranasal challenge. Body weights were recorded from 0 to 10 d.p.i. Upon euthanasia, the thymus, spleen, MLN, and BAL were collected for staining with NP366–374-specific tetramers. Spleen and thymus total size were estimated via cell counting. Lung tissue was also collected for influenza mRNA quantification. f, Overall percentage of body weight lost throughout the course of infection was determined by comparing body weight at 0–10 d.p.i. from baseline body weight in influenza-infected LPOWT and LPOFGF21 mice (n = 6 per group, 3 independent experiments). g, Thymus size was determined 10 d.p.i. in LPOWT and LPOFGF21 mice (n = 6 per group) via counting with hemocytometer. h, Influenza viral mRNA was quantified in lung tissue collected 10 d.p.i. in LPOWT and LPOFGF21 mice (n = 6 per group). i,j, The relative frequency (i) and total number (j) of NP366–374-specific CD90.2+, CD8+ T cells in BAL, MLN, and spleen in influenza-infected LPOWT and LPOFGF21 mice (n = 6 per group) were quantified 10 d.p.i. via flow cytometry. Data were analyzed via two-sided Student’s t-tests in cj. NS, P ≥ 0.05; *P < 0.05; **P < 0.01; ***P < 0.001; ****P < 0.0001. Mean and s.e.m. are indicated by horizontal lines. Each symbol represents an individual mouse. Data are the result of two independent experiments. Schematic in a created in https://BioRender.com.
Fig. 7 |
Fig. 7 |. Persistent medullary TEC-driven overexpression of FGF21 protects against age-associated impairments in clonal deletion and development of peripheral autoimmunity.
a, Gating strategy used to detect clonal deletion among early (CCR7) and late (CCR7+) lineage (CD19, CD25, TCRγδ, NK1.1) signaled (CD5+, TCRβ+) T cells. b,c, The frequency of cleaved caspase 3+ cells was quantified among early (b) and late (c) signaled T cells in 2-month-old LPOWT and LPOFGF21/FGF21 homozygous mice (n = 5 per group) and in 12-month-old LPOWT and LPOFGF21/FGF21 homozygous mice (n = 5 per group). Data were analyzed by two-way ANOVA followed by Tukey’s multiple comparisons test. Mean and s.e.m. are indicated by horizontal lines. Significant comparisons are indicated (*P < 0.05; **P < 0.01; ***P < 0.001; ****P < 0.0001). d, The presence of ANAs was assessed in serum from 12-month-old LPOWT and LPOFGF21 mice (n = 8 per group). Serum was incubated on HEp-2-coated slides, followed by immunostaining with anti-mouse IgG FITC. The number of animals that tested positive for ANAs is indicated in the IgG channel image. Images are at ×20 magnification. Scale bars, 50 μm. e, Liver, lung, and salivary tissue were collected from 12-month-old LPOWT and LPOFGF21 (n = 7 per group) and evaluated for the presence of lymphocytic infiltrates via H&E staining (indicated via arrows). The number of mice testing positive for infiltrates are indicated in each tissue. Scale bars, 50 μm (×20 magnification). f, Representative plots showing the gating strategy determining the frequency of CD4+ Treg cells (CD4+ CD8 CD25+ Foxp3+) (top) and Helios+/Helios CD4+ Treg cells (bottom) among splenocytes in 2-month-old and 12-month-old LPOWT and LPOFGF21 mice (n = 3 per group). gi, The frequency of CD4+ Treg cells (g), Helios+ CD4+ Treg cells (h), and Helios CD4+ Treg cells (i) were compared between 2-month-old (n = 3 per group) and 12-month-old (n = 3 per group) LPOWT and LPOFGF21 mice by one-way ANOVA followed by Tukey’s multiple comparisons test. Mean and s.e.m. are indicated by horizontal lines. Significant comparisons are indicated (*P < 0.05; **P < 0.01; ***P < 0.001; ****P < 0.0001).
Fig. 8 |
Fig. 8 |. Paracrine thymic FGF21 signaling increases cTEC size during aging.
ad, Representative maximum intensity Z-Stack 3D projections taken from 60 μm optical stacks (×20 magnification) from 1-month-old FoxN1Cre R26Confetti LPOWT (n = 4 biological replicates), 1-month-old FoxN1Cre R26Confetti LPOFGF21 (n = 4), 6-month-old FoxN1Cre R26Confetti LPOWT (n = 3), and 6-month-old FoxN1Cre R26Confetti LPOFGF21 (n = 5) thymic sections. 3D animations can be found in Supplementary Movies 1–4. e, cTEC area (μm2) was quantified from Z-Stack projections from thymic sections from 1-month-old FoxN1Cre R26Confetti LPOWT (n = 4), 1-month-old FoxN1Cre R26Confetti LPOFGF21 (n = 4), 6-month-old FoxN1Cre R26Confetti LPOWT (n = 3), and 6-month-old FoxN1Cre R26Confetti LPOFGF21 (n = 5) mice via blinded analysis with ImageJ software. Each symbol represents a single cTEC. Red horizontal lines represent mean ± s.e.m. Data were analyzed by one-way ANOVA with Tukey’s multiple comparisons. NS, P ≥ 0.05; ****P < 0.0001.

References

    1. Goldschneider I, Komschlies KL & Greiner DL Studies of thymocytopoiesis in rats and mice. I. Kinetics of appearance of thymocytes using a direct intrathymic adoptive transfer assay for thymocyte precursors. J. Exp. Med 163, 1–17 (1986). - PMC - PubMed
    1. Foss DL, Donskoy E & Goldschneider I The importation of hematogenous precursors by the thymus is a gated phenomenon in normal adult mice. J. Exp. Med 193, 365–374 (2001). - PMC - PubMed
    1. Petrie HT & Zuniga-Pflucker JC Zoned out: functional mapping of stromal signaling microenvironments in the thymus. Annu. Rev. Immunol 25, 649–679 (2007). - PubMed
    1. Klug DB et al. Interdependence of cortical thymic epithelial cell differentiation and T-lineage commitment. Proc. Natl Acad. Sci. USA 95, 11822–11827 (1998). - PMC - PubMed
    1. Klein L, Kyewski B, Allen PM & Hogquist KA Positive and negative selection of the T cell repertoire: what thymocytes see (and don’t see). Nat. Rev. Immunol 14, 377–391 (2014). - PMC - PubMed

MeSH terms

Substances

LinkOut - more resources