

Epigenomics and transcriptomics association study of blood pressure and incident diagnosis of hypertension in twins
- PMID: 39972178
- PMCID: PMC11972964
- DOI: 10.1038/s41440-025-02164-5
Epigenomics and transcriptomics association study of blood pressure and incident diagnosis of hypertension in twins
Abstract
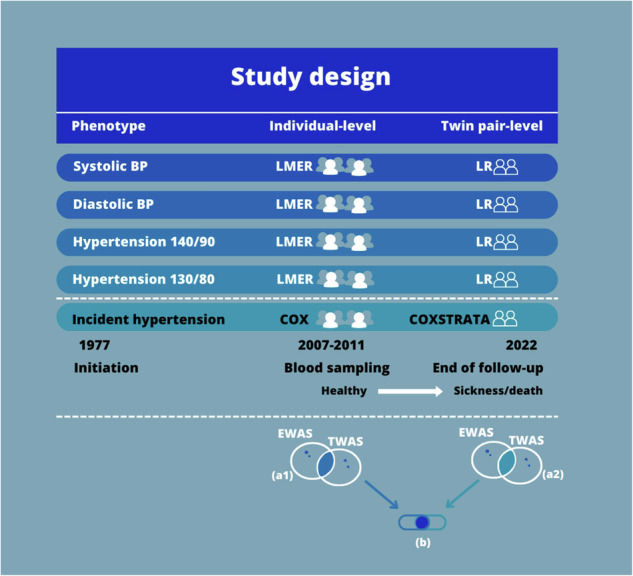
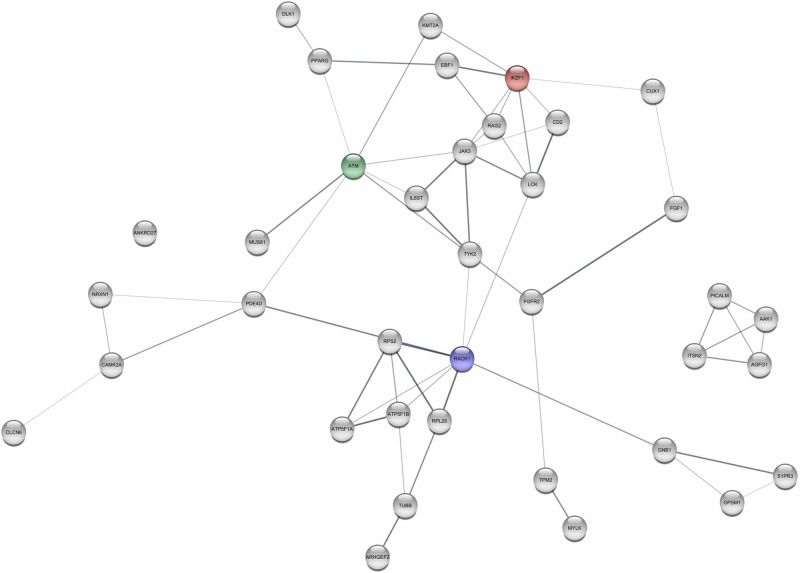
Hypertension is the most frequent health-related condition worldwide and is a primary risk factor for renal and cardiovascular diseases. However, the underlying molecular mechanisms are still poorly understood. To uncover these mechanisms, multi-omics studies have significant potential, but such studies are challenged by genetic and environmental confounding - an issue that can be effectively reduced by studying intra-pair differences in twins. Here, we coupled data on hypertension diagnoses from the nationwide Danish Patient Registry to a study population of 740 twins for whom genome-wide DNA methylation and gene expression data were available together with measurements of systolic and diastolic blood pressure. We investigated five phenotypes: incident hypertension cases, systolic blood pressure, diastolic blood pressure, hypertension (140/90 mmHg), and hypertension (130/80 mmHg). Statistical analyses were performed using Cox (incident cases) or linear (remaining) regression analyses at both the individual-level and twin pair-level. Significant genes (p < 0.05) at both levels and in both types of biological data were investigated by bioinformatic analyses, including gene set enrichment analysis and interaction network analysis. Overall, most of the identified pathways related to the immune system, particularly inflammation, and biology of vascular smooth muscle cell. Of specific genes, lysine methyltransferase 2 A (KMT2A) was found to be central for incident hypertension, ataxia-telangiectasia mutated (ATM) for systolic blood pressure, and beta-actin (ACTB) for diastolic blood pressure. Noteworthy, lysine methyltransferase 2A (KMT2A) was also identified in the systolic and diastolic blood pressure analyses. Here, we present novel biomarkers for hypertension. This study design is surprisingly rare in the field of hypertension. We identified biological pathways related to vascular smooth muscle cells and the immune system, particular inflammation, to be associated with hypertension and blood pressure. Of specific genes, we identified KMT2A (lysine methyltransferase 2A) to be central for blood pressure and hypertension development. ACTB beta-actin, ATM ataxiatelangiectasia mutated, BP blood pressure, EWAS epigenome-wide association studies, KMT2A lysine methyltransferase 2A, LMER linear mixed effect regression, LR linear regression, TWAS transcriptome-wide association studies.
Keywords: Hypertension; Immune system; KMT2A gene; Multi-Omics Association Study; Twins.
© 2025. The Author(s).
Conflict of interest statement
Compliance with ethical standards. Conflict of interest: The authors declare no competing interests. Ethics approval and consent to participate: Informed consent to take part in the cohorts was obtained from all participants, and the survey was approved by the Regional Scientific Ethical Committees for Southern Denmark (S-VF-19980072, S-VF-20040241 and S-20090033) and conducted in accordance with the Helsinki II declaration.
Figures


Comment in
-
Nature or nurture? That is the question.Hypertens Res. 2025 Jun;48(6):1999-2001. doi: 10.1038/s41440-025-02210-2. Epub 2025 Apr 14. Hypertens Res. 2025. PMID: 40229438 No abstract available.
Similar articles
-
Multi-omics association study of DNA methylation and gene expression levels and diagnoses of cardiovascular diseases in Danish Twins.Clin Epigenetics. 2024 Aug 26;16(1):117. doi: 10.1186/s13148-024-01727-6. Clin Epigenetics. 2024. PMID: 39187864 Free PMC article.
-
Epigenome-wide association study in Chinese monozygotic twins identifies DNA methylation loci associated with blood pressure.Clin Epigenetics. 2023 Mar 3;15(1):38. doi: 10.1186/s13148-023-01457-1. Clin Epigenetics. 2023. PMID: 36869404 Free PMC article.
-
Genetic and Environmental Effects on Gene Expression Signatures of Blood Pressure: A Transcriptome-Wide Twin Study.Hypertension. 2018 Mar;71(3):457-464. doi: 10.1161/HYPERTENSIONAHA.117.10527. Epub 2018 Jan 8. Hypertension. 2018. PMID: 29311254 Free PMC article.
-
The role of DNA methylation and histone modifications in blood pressure: a systematic review.J Hum Hypertens. 2019 Oct;33(10):703-715. doi: 10.1038/s41371-019-0218-7. Epub 2019 Jul 25. J Hum Hypertens. 2019. PMID: 31346255
-
Omics of Blood Pressure and Hypertension.Circ Res. 2018 May 11;122(10):1409-1419. doi: 10.1161/CIRCRESAHA.118.311342. Circ Res. 2018. PMID: 29748366 Review.
References
-
- Benjamin EJ, Muntner P, Alonso A, Bittencourt MS, Callaway CW, Carson AP, et al. Heart Disease and Stroke Statistics-2019 Update: A Report From the American Heart Association. Circulation. 2019;139:e56–e528. - PubMed
-
- Whelton PK, Carey RM, Aronow WS, Casey DE Jr., Collins KJ, Dennison Himmelfarb C, et al. 2017 ACC/AHA/AAPA/ABC/ACPM/AGS/APhA/ASH/ASPC/NMA/PCNA Guideline for the Prevention, Detection, Evaluation, and Management of High Blood Pressure in Adults: Executive Summary: A Report of the American College of Cardiology/American Heart Association Task Force on Clinical Practice Guidelines. Hypertension. 2018;71:1269–324. - PubMed
-
- Olczak KJ, Taylor-Bateman V, Nicholls HL, Traylor M, Cabrera CP, Munroe PB. Hypertension genetics past, present and future applications. J Intern Med. 2021;290:1130–52. - PubMed
Publication types
MeSH terms
LinkOut - more resources
Full Text Sources
Medical
Research Materials
Miscellaneous
