. 2025 Mar;57(3):635-646.
doi: 10.1038/s41588-025-02089-2. Epub 2025 Feb 19.

Plasma proteome variation and its genetic determinants in children and adolescents

Affiliations

Plasma proteome variation and its genetic determinants in children and adolescents

Lili Niu et al. Nat Genet. 2025 Mar.

Abstract

Our current understanding of the determinants of plasma proteome variation during pediatric development remains incomplete. Here, we show that genetic variants, age, sex and body mass index significantly influence this variation. Using a streamlined and highly quantitative mass spectrometry-based proteomics workflow, we analyzed plasma from 2,147 children and adolescents, identifying 1,216 proteins after quality control. Notably, the levels of 70% of these were associated with at least one of the aforementioned factors, with protein levels also being predictive. Quantitative trait loci (QTLs) regulated at least one-third of the proteins; between a few percent and up to 30-fold. Together with excellent replication in an additional 1,000 children and 558 adults, this reveals substantial genetic effects on plasma protein levels, persisting from childhood into adulthood. Through Mendelian randomization and colocalization analyses, we identified 41 causal genes for 33 cardiometabolic traits, emphasizing the value of protein QTLs in drug target identification and disease understanding.


Conflict of interest statement

Competing interests: M.M. is an indirect investor in Evosep. L.N. and J.F. are employees of Novo Nordisk; however, this work was conducted while L.N. was a full-time employee at the University of Copenhagen. M.T. is a co-founder and board member of Evido. She is also a board member of the non-governmental organization Alcohol & Society. She receives speaker fees from Siemens Healthcare, Echosens, Norgine, Madrigal, Takeda and Tillotts Pharma as well as advisory fees from Boehringer Ingelheim, Astra Zeneca, Novo Nordisk and GSK. A.K. is a co-founder and board member of Evido. He has served as a speaker for Novo Nordisk, Norgine and Siemens, and has participated in advisory boards for Siemens, Boehringer Ingelheim and Novo Nordisk. Additionally, he receives research support from Astra Zeneca, Siemens, Nordic Bioscience and Echosense, all outside the submitted work. The other authors declare no competing interests.

Figures

Fig. 1
Fig. 1. Study overview and proteomics workflow.
a, Discovery and replication cohorts used in this study. b, MS-based plasma proteome profiling and SNP-based genotyping were performed on the discovery and replication cohorts. c, Proteome profiling workflow and the computational tools used for processing of proteomics data, including (1) sample organization, (2) sample preparation, (3) data acquisition and (4) informatics. d, Schematic representation of (1 and 2) the association analysis with (3) a quality control step to eliminate artefactual pQTLs as described in the main text and (4) prediction of age, BMI and genotype based on plasma protein levels. ALD, alcohol-related liver disease; m/z, mass to charge ratio; QA, quality assessment; QC, quality control.
Fig. 2
Fig. 2. Age-associated, sex-associated and BMI-SDS-associated plasma proteins.
a, Biological processes represented by all identified proteins after quality control. b, Schematic representation of linear modeling of protein levels using various factors. c, Number of proteins associated with age, sex, BMI-SDS and the interaction term between obesity status and BMI-SDS; n = 1,601 biologically independent samples. df, Volcano plots showing proteins associated with age (d), sex (e) and BMI-SDS (f), highlighting strongly associated proteins. For cf, multiple linear regression was used to test for association, with beta coefficients estimated using ordinary least squares regression. Two-sided P values were approximated using a t-distribution with significance set at Benjamini–Hochberg-corrected P < 0.05. g, Schematic representation of linear modeling of age and BMI using plasma proteome. h,i, Prediction of age (h) and BMI (i) in the test set. Pearson’s correlation coefficients between predicted and real values are indicated; n = 639 biologically independent samples. Source data
Fig. 3
Fig. 3. Characterization of pQTLs.
a, Primary pQTLs across the genome (two-sided Wald test in a linear mixed model with genome-wide significance P < 5 × 10−8). b, Primary pQTLs against the locations of the transcription start site of the gene coding the protein target. c, Variant annotation. d, Classification of pQTLs based on peptide-level evidence. e, Number of cis-pQTLs and trans-pQTLs. f, Number of proteins that are associated with cis only, trans only and both cis and trans-pQTLs. g, Distribution of the number of associated proteins per SNP. h, Distribution of the number of associated SNPs per protein. ik, Proportion of proteins with genetic associations when stratifying proteins into buckets based on technical variation (i), median abundance (j) and number of identified peptides after quality control per protein (k). TF, transcription factor; UTR, untranslated region; CV, coefficient of variation. Source data
Fig. 4
Fig. 4. Variance in plasma protein levels explained by various factors.
a, Proportion of variance explained by conditionally independent pQTLs, age, sex, obesity and BMI-SDS (summed variance from BMI-SDS and its interaction with obesity status). Proteins are ordered by decreasing variance attributable to independent pQTLs. bd, Pairwise comparisons of variance explained by independent pQTLs across three age groups: 10-14 years vs. 5-9 years (b), 15-20 years vs. 5-9 years (c) and 15-20 years vs. 10-14 years (d); Pearson correlation coefficients are also shown. Source data
Fig. 5
Fig. 5. Effect sizes and integration of pQTLs with known variant–trait associations.
af, Distribution of log2 intensity values of the top six proteins with the highest absolute beta value in genome-wide association analysis. The gray line in the middle of the box is the median, the top and bottom of the box represent the upper and lower quartile values of the data and the whiskers represent the upper and lower limits for consideration of outliers (Q3 + 1.5 × IQR, Q1 – 1.5 × IQR); IQR, interquartile range (Q3 – Q1); MAF, minor allele frequency. For genotype 0/0:0/1:1/1, the numbers of biological replicates are n = 1278:328:6, 1708:191:0, 1490:399:23, 1225:410:35, 1637:260:15 and 1227:606:79, respectively. Only non-imputed values are shown. g, Venn diagram showing the number of protein–outcome pairs that are significant in colocalization analysis (HyPrColoc method) and two-sample Mendelian randomization (MR), using a two-sided Wald ratio test implemented in the twoSampleMR package with significance defined as P < 2.5 × 10−6 (correcting for the number of protein-coding genes). h, Protein–trait pairs that are colocalized and with supporting evidence for causation from MR. CAD, coronary artery disease; ALT, alanine aminotransferase; AST, aspartate aminotransferase; CRP, C-reactive protein; ALP, alkaline phosphatase; GGT, gamma-glutamyl transferase; HbA1c, hemoglobin A1c; LDL, low-density lipoprotein; eGFR, estimated glomerular filtration rate; SBP, systolic blood pressure; DBP, diastolic blood pressure; WHRadjBMI, waist-to-hip ratio adjusted for BMI; ASCVD, atherosclerotic cardiovascular disease; MASH, metabolic dysfunction-associated steatohepatitis; CKD, chronic kidney disease. Source data
Fig. 6
Fig. 6. Replication of pQTLs in children and adults.
a, Correlation of beta coefficient for replicated pQTLs in the children replication cohort. b, Correlation of beta coefficient for replicated pQTLs in the adult cohort. c, Distribution of absolute beta coefficient of replicated and non-replicated pQTLs. d, Manhattan plot of association between SNPs and plasma levels of TGFBI in the discovery cohort (upper panel) and adult replication cohort (lower panel) with the lead variant annotated. e, Manhattan plot of association between SNPs and plasma levels of LBP in the discovery cohort (upper panel) and adult replication cohort (lower panel) with the lead variant annotated. f, Distribution of plasma levels of TGFBI stratified by the genotype of its lead-associated variant and fibrosis stage in the adult replication cohort. For genotype 0/0:0/1:1/1, n = 96:181:90 and 55:93:43 for fibrosis stage F0–F1 and F2–F4, respectively. g, Distribution of plasma levels of LBP stratified by the genotype of its lead-associated variant and steatosis stage in the adult replication cohort. For genotype 0/0:0/1:1/1, n = 318:52:3 and 157:25:3 for steatosis <5% and ≥ 5%, respectively. GALA–ALD, gut and liver axis–alcohol-related liver disease. Source data
Extended Data Fig. 1
Extended Data Fig. 1. Sex- and obesity-dependent temporal plasma proteome profiles.
a, Hierarchical clustering dendrogram of proteins that are significantly associated with age. The heat maps display z-scored median intensities across age for girls (n = 1,170) and boys (n = 958). b-q, Temporal trajectories of representative proteins stratified by sex and obesity status in Panel (a). Mean values along the age axis and 95% confidence intervals are shown. Obesity status is classified based on BMI-SDS, with ‘yes’ indicating a BMI-SDS ≥ 1.28 (above the 90th percentile) according to Danish reference values, and ‘no’ otherwise. The number of participants in each trajectory group is as follows: males with obesity (n = 538), females with obesity (n = 641), males without obesity (n = 420), and females without obesity (n = 529). MS: mass spectrometry; BMI-SDS: body mass index standard deviation score. Source data
Extended Data Fig. 2
Extended Data Fig. 2. Classification of pQTLs based on peptide-level data.
a, Classification scheme and criteria. b, Example of a Tier 1 pQTL. The number of biological replicates per genotype in the order of A/A, A/G, G/G for each peptide from left to right is: 1,162/281/8, 572/274/8, 1,030/285/8, 1,242/284/8, 1,305/287/8, 1,240/283/8, 1,236/286/8. c, Example of a Tier 2 pQTL. The number of biological replicates per genotype in the order of C/C, C/T, and T/T is 1,455/255/9. d, Example of a Tier 4 pQTL. The number of biological replicates per genotype in the order of T/T, T/C and C/C is 1,371/391/23. For Panels (b), (c), and (d), the gray line in the middle of the box is the median, the top and bottom of the box represent the upper and lower quartile values of the data and the whiskers represent the upper and lower limits for consideration of outliers (Q3 + 1.5 × IQR, Q1 – 1.5 × IQR). IQR represents the interquartile range (Q3 – Q1). pQTL: protein quantitative trait locus; SNP: single nucleotide polymorphism; MS: mass spectrometry. Source data
Extended Data Fig. 3
Extended Data Fig. 3. Quantification consistency between old and new instrumentation and the effect of delayed measurements.
a-b, Distribution of sample-wise proteome Pearson correlation coefficients (n = 94 samples) between old and new instruments with a 2-month (a) and 2-year (b) measurement gaps. c-d, Distribution of protein-wise Pearson correlation coefficients between old and new instruments with (c) 2-month gap (408 overlapping proteins) and (d) 2-year gap (465 overlapping proteins). e-f, Density distribution of pair-wise proteomes for samples at 80th, 60th, 40th, and 20th percentile correlation coefficients from Panel (a) and (b), respectively. g-h, Density distribution of protein values at 80th, 60th, 40th, and 20th percentile correlation coefficients from Panel (c) and (d), respectively. MS: mass spectrometry; P: percentile. Source data
Extended Data Fig. 4
Extended Data Fig. 4. Examples of Genetic Variants and Peptide Quantity.
a-c, Peptide quantities by genotype illustrating common regulation of peptide quantities for examples of variants located in the (a) intron region, (b) intergenic region and (c) regulatory region. Up to ten peptides per protein are displayed. The number of biological replicates per genotype in the order of A/A, A/G, and G/G for peptides from left to right in Panel (a) is as follow: 1,162/281/8, 572/274/8, 1,030/285/8, 1,242/284/8, 1,305/287/8, 1,240/283/8, 1,236/286/8, 1,156/286/8, 906/277/8, 1,088/286/8. The number of biological replicates per genotype in the order of G/G, G/T, T/T for peptides from left to right in Panel (b) is as follow: 1,191/161/6, 1,358/174/7, 1,596/199/8, 1,015/149/5, 1,610/203/8, 1,557/200/6, 1,565/191/8, 1,701/204/8, 1,705/204/8, 1,397/189/8. The number of biological replicates per genotype in the order of A/A, A/G, G/G for peptides from left to right in Panel (c) is as follow: 119/718/1,084, 119/718/1,084, 83/593/994, 101/672/1,043, 119/718/1,083, 112/696/1,072, 119/718/1,084, 119/718/1,084, 119/718/1,084, 119/718/1,084. For Panels (a), (b) and (c), the gray line in the middle of the box is the median, the top and bottom of the box represent the upper and lower quartile values of the data and the whiskers represent the upper and lower limits for consideration of outliers (Q3 + 1.5 × IQR, Q1 – 1.5 × IQR). IQR represents the interquartile range (Q3 – Q1). MS: mass spectrometry. Source data
Extended Data Fig. 5
Extended Data Fig. 5. Peptide level evidence for the association between rs9898 and circulating HRG levels.
a-b, Increasing protein levels with the number of T alleles at rs9898 in the discovery (a) and children replication (b) cohorts. The number of biological replicates per genotype in the order of C/C, C/T and T/T in Panels (a) and (b) is 868/828/213 and 454/421/115, respectively. c, Sequence coverage of the HRG protein. d, Increasing peptide levels with the number of T alleles at rs9898. Up to ten HRG-derived peptides are displayed. The number of biological replicates per genotype in the order of C/C, C/T, and T/T for the peptides from left to right is as follows: 871/836/214, 871/836/214, 871/836/214, 871/836/214, 855/826/209, 871/836/214, 871/836/214, 871/836/214, 752/723/190, 869/835/214. For Panels (a), (b) and (d), the gray line in the middle of the box is the median, the top and bottom of the box represent the upper and lower quartile values of the data, and the whiskers represent the upper and lower limits for consideration of outliers (Q3 + 1.5 × IQR, Q1 – 1.5 × IQR). IQR represents the interquartile range (Q3 – Q1). MS: mass spectrometry. Source data
Extended Data Fig. 6
Extended Data Fig. 6. Comparison of pQTLs to previous plasma or serum studies.
a, Comparison of the number of proteins analyzed and the number of samples analyzed by 35 previous studies. b, The number of protein quantitative trait loci (pQTLs) replicated in previous studies. c, Number of published studies in which the cis- (n = 1,206) and trans-pQTLs (n = 741) are replicated. The gray line in the middle of the box is the median, the top and bottom of the box represent the upper and lower quartile values of the data, and the whiskers represent the upper and lower limits for consideration of outliers (Q3 + 1.5 × IQR, Q1 – 1.5 × IQR). IQR represents the interquartile range (Q3 – Q1). MS: mass spectrometry. Source data
Extended Data Fig. 7
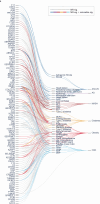
Extended Data Fig. 7. Mendelian randomization identifies potential causal genes for cardiometabolic traits and diseases.
a, Gene-trait causal relationships for six diseases (two-sided Wald-ratio test implemented in the twoSampleMR package with significance defined as p < 2.5e−6 (correcting for the number of protein coding genes). MR: Mendelian randomization; CAD: coronary artery disease; ALT: alanine aminotransferase; AST: aspartate aminotransferase; CRP: C-reactive protein; ALP: Alkaline phosphatase; GGT: gamma glutamyl transferase; HbA1c: hemoglobin A1c; LDL: low-density lipoprotein; eGFR: estimated glomerular filtration rate; SBP: systolic blood pressure; DBP: diastolic blood pressure; BMI: body mass index; WHRadjBMI: waist-to-hip ratio adjusted for body mass index. ASCVD: atherosclerotic cardiovascular disease; MASH: metabolic dysfunction-associated steatohepatitis; AD: Alzheimer’s disease; CKD: chronic kidney disease. Source data
Extended Data Fig. 8
Extended Data Fig. 8. Incorporating pQTLs affect biomarker performance.
a, Classification performance metrics of TGFBI and TGFBI+rs13159365 for identifying significant fibrosis in the adult replication cohort. Significance levels from two-sided two-sample independent t-test are indicated (*p < 0.05, **p < 0.01, ***p < 0.001). The exact P-value for each parameter from left to right is as follows: 2.4e−6, 0.06, 4.1e−4, 4.4e−7, 2.8e−4, 0.43, 2.7e−6, and 5.4e−6. b, Classification performance metrics of LBP and LBP+rs2232613 at identifying any steatosis. The exact P-value for each parameter from left to right is as follows: 0.32, 5.4e−20, 1.1e−21, 0.006, 3e−6, 0.002, 0.15, 1.7e−17. The number of iterations and hence technical replicates is 100 in both Panel (a) and (b). Data are presented as mean values with 95% confidence interval. MCC: Matthews’s correlation coefficient; AUC-ROC: area under the receiver operating characteristic curve. Source data

References

    1. NCD Risk Factor Collaboration (NCD-RisC). Worldwide trends in body-mass index, underweight, overweight, and obesity from 1975 to 2016: a pooled analysis of 2416 population-based measurement studies in 128·9 million children, adolescents, and adults. Lancet390, 2627–2642 (2017). - PMC - PubMed
    1. Lister, N. B. et al. Child and adolescent obesity. Nat. Rev. Dis. Primers9, 24 (2023). - PubMed
    1. Benyi, E. & Sävendahl, L. The physiology of childhood growth: hormonal regulation. Horm. Res. Paediatr.88, 6–14 (2017). - PubMed
    1. Geyer, P. E., Holdt, L. M., Teupser, D. & Mann, M. Revisiting biomarker discovery by plasma proteomics. Mol. Syst. Biol.13, 942 (2017). - PMC - PubMed
    1. Niu, L. et al. Noninvasive proteomic biomarkers for alcohol-related liver disease. Nat. Med.28, 1277–1287 (2022). - PMC - PubMed

LinkOut - more resources