. 2025 Mar;7(3):493-507.
doi: 10.1038/s42255-025-01224-x. Epub 2025 Feb 19.

Pro-inflammatory macrophages produce mitochondria-derived superoxide by reverse electron transport at complex I that regulates IL-1β release during NLRP3 inflammasome activation

Affiliations

Pro-inflammatory macrophages produce mitochondria-derived superoxide by reverse electron transport at complex I that regulates IL-1β release during NLRP3 inflammasome activation

Alva M Casey et al. Nat Metab. 2025 Mar.

Abstract

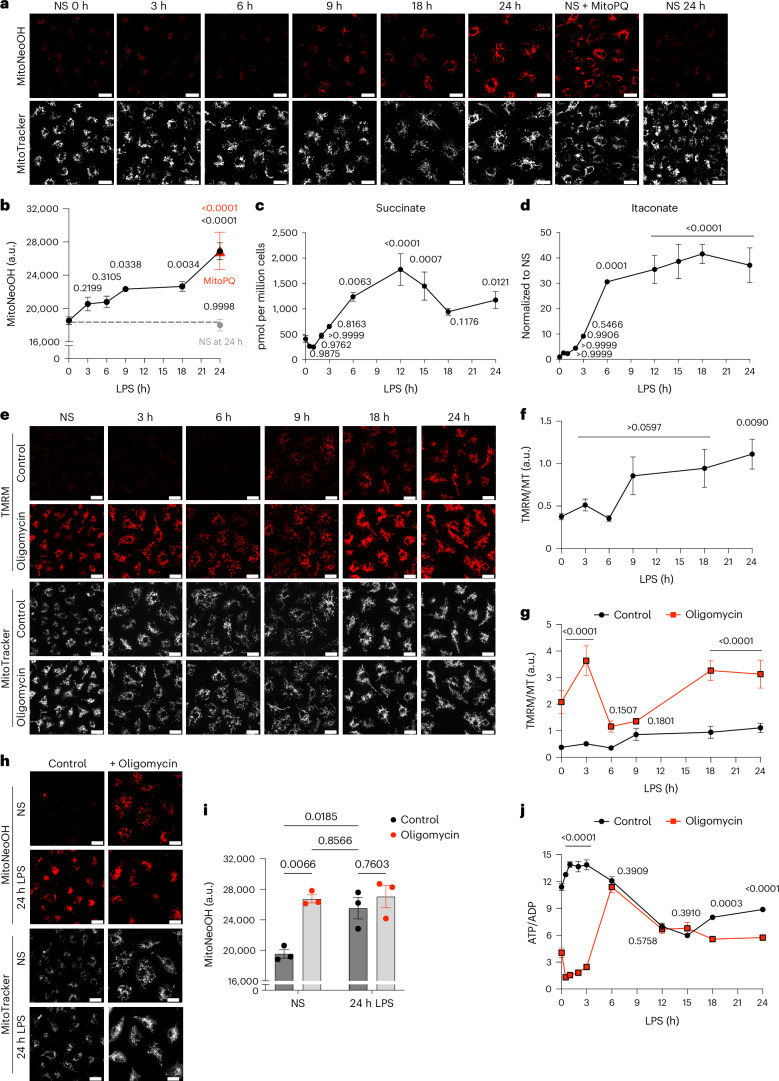
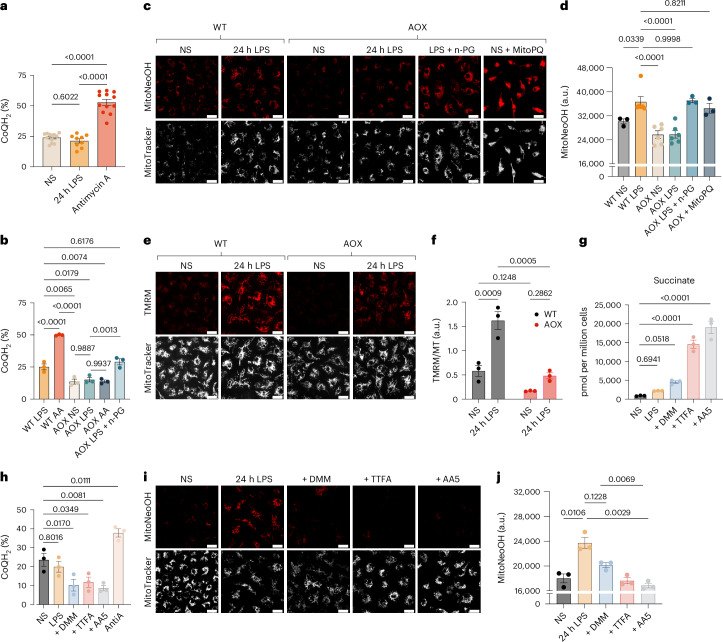
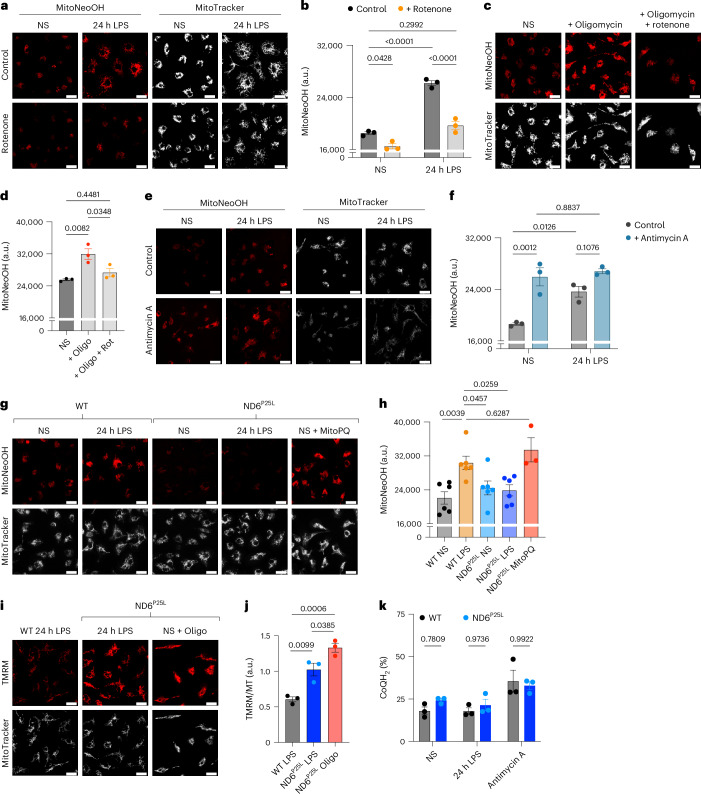
Macrophages stimulated by lipopolysaccharide (LPS) generate mitochondria-derived reactive oxygen species (mtROS) that act as antimicrobial agents and redox signals; however, the mechanism of LPS-induced mitochondrial superoxide generation is unknown. Here we show that LPS-stimulated bone-marrow-derived macrophages produce superoxide by reverse electron transport (RET) at complex I of the electron transport chain. Using chemical biology and genetic approaches, we demonstrate that superoxide production is driven by LPS-induced metabolic reprogramming, which increases the proton motive force (∆p), primarily as elevated mitochondrial membrane potential (Δψm) and maintains a reduced CoQ pool. The key metabolic changes are repurposing of ATP production from oxidative phosphorylation to glycolysis, which reduces reliance on F1FO-ATP synthase activity resulting in a higher ∆p, while oxidation of succinate sustains a reduced CoQ pool. Furthermore, the production of mtROS by RET regulates IL-1β release during NLRP3 inflammasome activation. Thus, we demonstrate that ROS generated by RET is an important mitochondria-derived signal that regulates macrophage cytokine production.


Conflict of interest statement

Competing interests: The authors declare no competing interests.

Figures

Fig. 1
Fig. 1. LPS-induced increase in mitochondrial membrane potential drives mitochondrial superoxide production.
a,b, Mitochondrial superoxide measured with MitoNeoD in BMDMs stimulated with LPS for 3–24 h, treated with 10 μM MitoParaquat for 30 min or nonstimulated (NS). NS BMDMs were either left for 24 h before MitoNeoD treatment (NS at 24 h) or immediately treated with MitoNeoD (NS 0 h). Representative images from confocal live-cell imaging show MitoNeoOH, the oxidized product of MitoNeoD and MitoTracker Deep Red FM. Fluorescence intensity of MitoNeoOH, measured as absolute intensity (arbitrary units (a.u.)) (n = 3 (NS, 6 h, 9 h, MitoPQ, NS at 24 h), n = 6 (3 h, 18 h, 24 h)). c,d, Succinate and itaconate measured by mass spectrometry in BMDMs treated with LPS for 3–24 h or NS (n = 6). eg, ∆ψm measured with TMRM normalized to MitoTracker Deep Red FM in BMDMs stimulated with LPS for 3–24 h or NS and/or treated with 5 μM oligomycin in the last 30 min of LPS treatment or for 30 min in NS cells from confocal live-cell imaging (n = 6 (3 h, 6 h, 18 h, 24 h), n = 9 (NS, 9 h)) (NS, P = 0.00006; 3 h P = 9 × 10−9; 18 h, P = 1 × 10−5; 24 h, P = 8 × 10−5). h,i, Mitochondrial superoxide production measured with MitoNeoD from confocal live-cell imaging in BMDMs stimulated with LPS for 24 h and/or treated with 5 μM oligomycin in the last 30 min of LPS treatment or for 30 min in NS cells. Fluorescence intensity of MitoNeoOH is measured as absolute intensity (a.u.) (n = 6). Scale bars on all representative images, 20 μm. j, The ATP/ADP ratio measured per million BMDMs stimulated with LPS for 3–24 h or NS and/or treated with 5 μM oligomycin in the last 30 min of LPS treatment or for 30 min in NS cells (n = 3) (NS, 0.5 h, 1 h, 2 h and 3 h, P < 1 × 1015). All data are mean ± s.e.m. of biological replicates. P values displayed above graphs were calculated using two-tailed Student’s t-test for paired comparisons or one-way or two-way analysis of variance (ANOVA) for multiple comparisons. Source data
Fig. 2
Fig. 2. Reduction of the CoQ pool maintained by succinate oxidation is required for mitochondrial superoxide production.
a,b, The redox state of the CoQ pool was measured by mass spectrometry in WT and AOX-expressing BMDMs that were NS, stimulated with LPS for 24 h, treated with 5 μM antimycin A for 15 min or stimulated with LPS and 100 μM n-PG for 24 h (n = 9 (24 h LPS), n = 12 (NS, antimycin A)) (NS versus antimycin A, P = 8 × 10−12; LPS versus antimycin A, P = 6 × 10-12; WT LPS versus WT AA, P = 5 × 10-6; WT AA versus AOX NS, P = 7 × 10-8). c,d, Mitochondrial superoxide production measured in NS WT BMDMs, WT BMDMs stimulated with LPS for 24 h and in AOX-expressing BMDMs that were NS, stimulated with LPS for 24 h with or without 100 μM n-PG or treated with 10 μM MitoPQ for 30 min from confocal live-cell imaging. MitoNeoOH fluorescence is measured as absolute intensity with arbitrary units (a.u.) (n = 3 (WT NS, AOX LPS + n-PG, AOX + MitoPQ) n = 6 (WT LPS, AOX NS, AOX LPS)) (WT LPS versus AOX NS P = 3 × 10−5; WT LPS versus AOX LPS P = 3 × 10−5). e,f, ∆ψm measured using TMRM normalized to MitoTracker Deep Red FM in WT and AOX-expressing BMDMs that were NS or stimulated with LPS for 24 h from confocal live-cell imaging (n = 3). gj, NS BMDMs or BMDMs stimulated with LPS for 24 h and BMDMs stimulated with LPS for 12 h and then for a further 12 h with the addition of 10 mM DMM, 200 μM TTFA or 0.5 μM AA5. Succinate measured by mass spectrometry (n = 3) (NS versus TTFA, P = 3 × 10−6; NS versus AA5, P = 2 × 10−7) (g). The redox state of the CoQ pool measured by mass spectrometry (n = 3) (h). i,j, Mitochondrial superoxide production measured with MitoNeoD from confocal live-cell imaging. MitoNeoOH fluorescence is measured as absolute intensity (a.u.) (n = 3). Scale bars on all representative images, 20 μm. All data are mean ± s.e.m. of biological replicates. P values displayed above graphs calculated using one-way or two-way ANOVA. Source data
Fig. 3
Fig. 3. LPS-induced mitochondrial superoxide is produced by reverse electron transport at complex I.
ah, Mitochondrial superoxide production measured with MitoNeoD from confocal live-cell imaging. Fluorescence intensity of MitoNeoOH is measured as absolute intensity with arbitrary units (a.u.). BMDMs stimulated with LPS for 24 h were treated with 0.5 μM rotenone in the last 30 min of LPS treatment or for 30 min with 0.5 μM rotenone or 5 μM oligomycin in NS cells (n = 3) (NS versus LPS, P = 7 × 10−6; LPS versus LPS + rotenone, P = 2 × 10−5) (ad). BMDMs stimulated with LPS for 24 h were treated with 5 μM antimycin A in the last 30 min of LPS treatment or for 30 min in NS cells (n = 3) (e,f). BMDMs from WT and ND6 P25L mice stimulated with LPS for 24 h, NS or treated with 5 μM MitoPQ for 30 min (n = 3 (ND6P25L MitoPQ), n = 6 (WT NS, WT LPS, ND6P25L NS, ND6P25L LPS)) (g,h). i,j, ∆ψm measured using TMRM normalized to MitoTracker Deep Red FM in BMDMs from WT and ND6P25L mice that were treated with 5 μM oligomycin for 30 min or stimulated with LPS for 24 h from confocal live-cell imaging (n = 3). Scale bars on all representative images, 20 μm. k, The redox state of the CoQ pool measured by mass spectrometry in BMDMs from WT and ND6P25L mice that were NS, stimulated with LPS for 24 h or treated with 5 μM antimycin A for 15 min (n = 3). All data are mean ± s.e.m. of biological replicates. P values displayed above graphs calculated using two-tailed Student’s t-test for paired comparisons or one-way or two-way ANOVA for multiple comparisons. Source data
Fig. 4
Fig. 4. MtROS production regulates IL-1β release during NLRP3 inflammasome activation.
a, Il1β expression in BMDMs from WT and ND6P25L mice stimulated with LPS for 3 h, 6 h or 24 h or NS (n = 3). b,c, Western blot and quantification of pro-IL-1β and tubulin in BMDMs from WT and ND6P25L mice stimulated with LPS for 3 h or 6 h or NS (n = 3). Blot shows three biological replicates for each condition and data are mean normalized to NS and tubulin loading control ± s.e.m. of biological replicates. dg, BMDMs from WT and ND6P25L mice that were NS, stimulated with LPS for 4 h or primed with LPS for 4 h followed by treatment with 5 mM ATP or 15 μM nigericin for 1 h. Mitochondrial superoxide production measured with MitoNeoD (d,e). BMDMs were incubated with MitoNeoD in the last 30 min of LPS priming and imaged within 5 min of ATP or nigericin addition. MitoNeoOH fluorescence is measured as absolute intensity with arbitrary units (a.u.) (n = 3) (LPS versus ATP, P = 6 × 10−7; LPS versus nigericin, P = 1 × 10−8; nigericin versus ND6P25L + nigericin, P = 1 × 10−4). Scale bars on all representative images, 20 μm. IL-1β release (n = 3 (ATP, nigericin), n = 6 (LPS + nigericin), n = 9 (NS, 4 h LPS), n = 12 (LPS + ATP)) (f). LDH release (n = 9) (WT LPS versus ATP, P = 7 × 10−12; WT LPS + ATP versus ND6P25L LPS + ATP, 1 × 10−7) (g). h,i, WT and ND6P25L mice were injected intraperitoneally with PBS (n = 4) or MSU crystals (30 mg kg−1, n = 6) for 6 h (WT PBS versus MSU, P = 8 × 10−11; ND6P25L PBS versus MSU, 2 × 10−9). Neutrophils were identified as CD45+CD11b+Ly6G+ cells. Data are displayed as representative dot plots and neutrophils as a percentage of CD45+ live cells in each condition. a,c,eh, All data are mean ± s.e.m. of biological replicates. P values displayed above graphs calculated using two-tailed Student’s t-test for paired comparisons or one-way ANOVA or two-way ANOVA for multiple comparisons. j, The role of mtROS in the regulation of NLRP3 inflammasome activation and IL-1β release. CL, cardiolipin; ox-mtDNA, oxidized mtDNA. Source data
Extended Data Fig. 1
Extended Data Fig. 1. Measurement of mitochondrial superoxide production in BMDMs using MitoNeoD and MitoSOX.
a-c, Mitochondrial superoxide measured with MitoNeoD in nonstimulated (NS) BMDMs untreated or treated with 10 μM MitoParaquat (MitoPQ) for 30 min or stimulated with LPS for 24 h. a, Representative images from confocal live cell imaging show MitoNeoOH, the oxidized product of MitoNeoD and Mitotracker Deep Red FM. b, Graph shows fluorescence intensity of MitoNeoOH measured as absolute intensity with Arbitrary Units (A.U.) (n = 3 (NS + MitoPQ), n = 6 (NS, 24 h LPS)). c, Quantification of MitoNeoOH fluorescence overlay with MitoTracker Deep Red in BMDMs stimulated with LPS for 24 h and NS BMDMs treated with MitoPQ (n = 3). d-f, Mitochondrial superoxide measured with MitoSOX in BMDMs stimulated with LPS for 24 h, NS or treated with 10 μM MitoParaquat for 30 min from confocal live cell imaging. e, Fluorescence intensity is measured as absolute intensity (A.U.) (n = 3). f, Quantification of MitoSOX fluorescence overlay with MitoTracker Deep Red FM in BMDMs stimulated with LPS for 24 h or NS BMDMs treated with MitoPQ (n = 3). Data are mean +/- S.E.M. of biological replicates. Scale bars on all representative live cell confocal images are 20 μm. P values displayed above graphs were calculated using two-tailed Student’s t-test for paired comparisons or one-way ANOVA for multiple comparisons. Source data
Extended Data Fig. 2
Extended Data Fig. 2. LPS-induced change in mitochondrial morphology.
a, BMDMs stimulated with LPS for 24 h or nonstimulated (NS). Representative images left to right: Live cell confocal images showing Mitotracker Deep Red FM, fixed cell super-resolution structured illuminated microscopy images showing TOMM20 signal and live cell super-resolution structured illuminated microscopy images showing Mitotracker green. Scale bars are 20 μm for all confocal images and 5 μm for super-resolution images. Scale bars for inset images are 2 μm. b, BMDMs were stimulated with LPS for 3–24 h LPS or NS and then treated with 5 nM Mitotracker Deep Red FM for 20 min and imaged by confocal live cell microscopy. Mitochondrial object number, length, area and junctions per network were measured in 20 regions of interest (ROIs) (15 μm2) per biological replicates (n = 5 (6 h), n = 6 (3 h, 9 h, 18 h, 24 h), n = 7 (NS)). c, Western blot and quantification of VDAC and TOMM20 normalized to tubulin loading control in BMDMs treated with LPS for 3–24 h or NS (n = 3). Blots show three biological replicates for each condition and data are mean normalized to NS and vinculin loading control. d, Representative images of BMDMs that were NS or stimulated with LPS for 24 h imaged by structured illumination microscopy (Elyra7) showing ATP synthase (magenta), TOMM20 (green) and nucleus (blue). Scale bars are 2 μm for whole cell images and 1 μm for inset image. Quantifications of mitochondrial morphology and ATP synthase density are mean +/- S.E.M. of whole cells from 3 biological replicates (n = 31 (NS), n = 34 (24 h LPS)). All data are mean +/- S.E.M. of biological replicates. P values displayed above graphs calculated using two-tailed Student’s t-test for paired comparisons or one-way ANOVA for multiple comparisons. Source data
Extended Data Fig. 3
Extended Data Fig. 3. Metabolic reprogramming in LPS-stimulated BMDMs.
a,b, Oxygen consumption rate (OCR) measured by Seahorse XF mito stress test in nonstimulated (NS) BMDMs and BMDMs stimulated with LPS for 3 h, 6 h or 24 h (n = 3). Data are mean +/- S.E.M. of biological replicates. c, Extracellular acidification rate (ECAR) in BMDMs stimulated with LPS for 3 h, 6 h or 24 h or NS measured by Seahorse (n = 3). Data are mean +/- S.E.M. of biological replicates. d, Extracellular lactate measured by mass spectrometry in BMDMs stimulated with LPS for 3–24 h or NS (n = 6) (12 h LPS, P = 3×10⁻⁵). Data are mean +/- S.E.M. of biological replicates. e, Western blot of hexokinase I, GAPDH, PDH, PKM2, PKM1/2 and tubulin in BMDMs treated with LPS for 3–24 h or NS (n = 3). Tubulin is a representative blot. Blots show three biological replicates for each condition. f-h, Quantification of protein determined by western blotting, normalized to NS and tubulin loading control +/- S.E.M. of biological replicates (n = 3). PKM2 was also normalized to PKM1/2. i,j, Metabolites measured by mass spectrometry in BMDMs stimulated with LPS for 6 h or 24 h or nonstimulated (NS) (n = 3). Data depicts z-score of biological replicates. k,l, Western blot and quantification of IRG1 normalized to vinculin loading control in BMDMs treated with LPS for 3–24 h or NS (n = 3). Blots show three biological replicates for each condition and data are mean normalized to NS and vinculin loading control. m,n, Succinate and itaconate measured by mass spectrometry in BMDMs stimulated with LPS for 6 h or NS, non-treated or treated with 10 μM BPTES for 6 h (n = 3) (6 h LPS Control vs BPTES, P = 1×10⁻⁶). Data are mean +/- S.E.M. of biological replicates. P values displayed above graphs calculated using two-tailed Student’s t-test for paired comparisons or one-way ANOVA for multiple comparisons. Source data
Extended Data Fig. 4
Extended Data Fig. 4. The electron transport chain and F1FO-ATP synthase in LPS-stimulated BMDMs.
a-c, Western blot and quantification of complexes I-IV, F1FO-ATP synthase and vinculin loading control in BMDMs treated with LPS for 3–24 h or nonstimulated (NS) (n = 3) (Complex I 18 h, P = 3×10⁻⁶; 24 h, P = 1×10⁻⁵; Complex III 18 h, P = 6×10⁻⁶; 24 h, P = 9×10⁻⁵). Blots show three biological replicates for each condition and data are mean normalized to NS and vinculin loading control +/- S.E.M. of biological replicates. d,e, Western blot and quantification of ATPIF1 and tubulin in BMDMs treated with LPS for 3–24 h or NS (n = 3). Blot shows three biological replicates for each condition and data are mean normalized to NS and tubulin loading control. f, Nitrite levels in BMDMs stimulated with LPS for 3-6 h or NS (n = 3). Data are mean +/- S.E.M. of biological replicates. g, Mitochondrial DNA copy number measured by ddPCR (n = 3). Data are mean +/- S.E.M. of biological replicates. P values displayed above graphs calculated using one-way ANOVA for multiple comparisons. Source data
Extended Data Fig. 5
Extended Data Fig. 5. Measurement of mitochondrial membrane potential using TMRM in non-quenching mode.
a,b, ∆ψm measured with TMRM normalized to Mitotracker Deep Red FM (Arbitrary Units (A.U.)) in nonstimulated (NS) BMDMs treated with 2 μM FCCP, 5 μM oligomycin or 10 μM BAM15 for 30 min from confocal live cell imaging (n = 6) (Oligomycin, P = 2×10⁻⁷). c, ∆ψp measured with plasma membrane potential indicator (PMPI) in NS BMDMs and in BMDMs stimulated with LPS for 6 h or 24 h and in NS BMDMs treated with 150 mM KCl from confocal live cell imaging (n = 3). Scale bars on all representative images are 20 μm. Data are mean +/- S.E.M. of biological replicates. P values displayed above graphs calculated using two-tailed Student’s t-test for paired comparisons or one-way ANOVA for multiple comparisons. Source data
Extended Data Fig. 6
Extended Data Fig. 6. Ectopic expression of alternative oxidase in BMDMs.
a, Transgenic expression of Ciona intestinalis alternative oxidase (AOX) in the mitochondrial inner membrane where it uses electrons from the CoQ pool to reduce oxygen to water without pumping protons or generating ROS. N-propyl gallate (n-PG) inhibits AOX. b,c, Succinate, itaconate and extracellular lactate measured by mass spectrometry in wild-type (WT) BMDMs and BMDMs expressing AOX that were nonstimulated (NS) or stimulated with LPS for 3 h, 6 h or 24 h (n = 3). d, Nitrite levels in WT BMDMs and BMDMs expressing AOX that were NS or stimulated with LPS for 3 h, 6 h or 24 h (n = 3). e,f, Malonate and succinate in BMDMs that were NS or stimulated with LPS for 12 h and then for a further 12 h with the addition of 10 mM dimethyl malonate (DMM), 200 μM thenoyltrifluoroacetone (TTFA) or 0.5 μM atpenin A5 (AA5) (n = 3). P values for malonate (NS DMM vs Control, P = 3×10⁻⁶; vs TTFA, P = 4×10⁻⁶; vs AA5, P = 1×10⁻⁵; LPS DMM vs Control, P = 1x-11; vs TTFA, P = 8×10-12; vs AA5, P = 8×10-12). P values for succinate (NS Control vs TTFA, P = 5×10⁻⁷; vs AA5, 4×10⁻¹⁰). g, ∆ψm measured by TMRM normalized to MitoTracker Deep Red FM with Arbitrary Units (A.U.) from confocal live cell imaging in BMDMs stimulated with LPS for 12 h and then for a further 12 h with the addition of 10 mM DMM, 200 μM TTFA or 0.5 μM AA5 (n = 3). Scale bars are 20 μm for all confocal images. h, THP-1 cells were differentiated to macrophage-like cells and treated with either 0.1 μM rotenone or 0.1 μM AA5 in the last 15 min of LPS treatment (n = 3 (NS, LPS + Rotenone, LPS + AA5), n = 6 (24 h LPS)). Mitochondrial superoxide production measured with MitoNeoD from confocal live cell imaging. Fluorescence intensity of MitoNeoOH is measured as absolute intensity (A.U.). Scale bars on all representative images are 20 μm. Data are mean +/- S.E.M. of biological replicates. P values displayed above graphs were calculated using two-tailed Student’s t-test for paired comparisons or one-way or two-way ANOVA for multiple comparisons. Source data
Extended Data Fig. 7
Extended Data Fig. 7. LPS-induced mitochondrial superoxide production and metabolic reprogramming in BMDMs from ND6P25L mice.
a, Mitochondrial superoxide production measured with MitoSOX from confocal live cell imaging in nonstimulated (NS) BMDMs, BMDMs stimulated with LPS for 24 h, NS BMDMs treated with 5 μM oligomycin and BMDMs stimulated with LPS for 24 h and treated with 0.5 μM rotenone in the last 30 min of the LPS treatment (n = 3). Fluorescence intensity is measured as absolute intensity with Arbitrary Units (A.U.) (n = 3). Scale bars on all representative images are 20 μm. P values displayed above graphs calculated using one-way ANOVA. b, Succinate, itaconate and extracellular lactate measured by mass spectrometry in BMDMs from wild-type (WT) and ND6P25L mice that were NS or stimulated with LPS for 3 h, 6 h or 24 h (n = 3). c, Nitrite levels in BMDMs from WT and ND6P25L mice that were NS or stimulated with LPS for 3 h, 6 h or 24 h (n = 3). All data are mean +/- S.E.M. of biological replicates. P values displayed above graphs calculated using two-tailed Student’s t-test for paired comparisons or one-way ANOVA for multiple comparisons. d, LPS stimulation induces metabolic reprogramming consisting of a switch from ATP production by oxidative phosphorylation to glycolysis. The abundance of tricarboxylic acid cycle metabolites is also altered, including an accumulation of succinate and itaconate. These changes result in an elevated ∆p and a reduced CoQ pool which drives superoxide production by RET at complex I. LPS, lipopolysaccharide; TLR4, Toll-like receptor-4; SDH, succinate dehydrogenase; ∆p, proton motive force; ∆Eh, difference in reduction potential between NAD/NADH and UQ/UQH2 couples. Source data
Extended Data Fig. 8
Extended Data Fig. 8. Regulation of LPS-induced cytokine production by mtROS in BMDMs.
a, Mitochondrial superoxide production measured with MitoNeoD, ∆ψm measured with TMRM, and succinate and itaconate measured by mass spectrometry in nonstimulated (NS) BMDMs or BMDMs stimulated with LPS for 3–24 h (n = 6-9). Data are scaled to the relative minima and maxima of each measurement (MitoNeoD (n = 3 (NS, 6 h, 9 h), n = 6 (3 h, 18 h, 24 h)); ∆ψm (n = 6 (3 h, 6 h, 18 h, 24 h), n = 9 (NS, 9 h)); succinate (n = 3); itaconate (n = 3)). b, IL-10, TNFα and IL-6 release measured by ELISA from NS BMDMs or BMDMs stimulated with LPS for 3–24 h (n = 3). Data are mean +/- S.E.M. of biological replicates. b,c, Western blot and quantification of pro-IL-1β and tubulin (n = 3). Blot shows three biological replicates for each condition and data are mean normalized to NS and tubulin loading control +/- S.E.M. of biological replicates. d-h, BMDMs from wild-type (WT) and ND6P25L mice that were NS or stimulated with LPS for 3 h, 6 h or 24 h LPS (n = 3). d, e, Il10 and TNFα expression assessed by RT–qPCR (n = 3). f-h, IL-10, TNFα and IL-6 release measured by ELISA (n = 3). Data are mean +/- S.E.M. of biological replicates. P values displayed above graphs calculated using two-tailed Student’s t-test for paired comparisons. Source data
Extended Data Fig. 9
Extended Data Fig. 9. Serum cytokine levels in an in vivo model of sepsis from wild-type and ND6P25L mice.
a–d, Serum cytokines measured in female (F) and male (M) wild-type (WT) and ND6P25L mice 2 h post intraperitoneal injection of PBS or 2.5 mg/kg LPS (n = 3 (PBS female and PBS male) and (n = 6 (LPS female and LPS male)). Data are mean +/- S.E.M. of biological replicates. P values displayed above graphs calculated using two-tailed Student’s t-test for paired comparisons. Source data
Extended Data Fig. 10
Extended Data Fig. 10. The role of mtROS production by RET in NLRP3 inflammasome activation.
BMDMs from wild-type (WT) and ND6P25L mice stimulated with LPS for 4 h or primed with LPS for 4 h followed by treatment with 5 mM ATP or 15 μM nigericin for 1 h. a,b, Western blot and quantification of NLRP3 and tubulin (n = 3). Blots show three biological replicates for each condition and data are mean normalized to NS and tubulin loading control +/- S.E.M. of biological replicates. c-f, Western blot and quantification of pro- and mature IL-1β and tubulin in cell lysates and protein released into cell supernatant (n = 3). Blots show three biological replicates for each condition and data are mean normalized to NS and tubulin loading control +/- S.E.M. of biological replicates. g-i, Western blot and quantification of caspase-1 p45 and vinculin in cell lysates and caspase-1 p20 released into cell supernatant (n = 3). Blots show three biological replicates for each condition and data are mean normalized to NS and vinculin loading control +/- S.E.M. of biological replicates. j, Western blot of ASC protein with or without treatment with cross-linking agent BS3 (n = 3). Blot shows three biological replicates for each condition. k-m, Western blot and quantification of intact and cleaved gasdermin D (GSDMD) (n = 3). Blots show three biological replicates for each condition and data are mean normalized to NS and vinculin loading control +/- S.E.M. of biological replicates. n, The ATP/ADP ratio measured per million cells in nonstimulated (NS) BMDMs and BMDMs stimulated with LPS for 4 h from WT and ND6P25L mice (n = 3). Data are mean +/- S.E.M. of biological replicates. P values displayed above graphs calculated using two-tailed Student’s t-test for paired comparisons or one-way or two-way ANOVA for multiple comparisons. o, Gating strategy for neutrophils as analysed by flow cytometry. Source data

References

    1. Mosser, D. M. & Edwards, J. P. Exploring the full spectrum of macrophage activation. Nat. Rev. Immunol.8, 958–969 (2008). - PMC - PubMed
    1. West, A. P. et al. TLR signalling augments macrophage bactericidal activity through mitochondrial ROS. Nature472, 476–480 (2011). - PMC - PubMed
    1. Carneiro, F. R. G., Lepelley, A., Seeley, J. J., Hayden, M. S. & Ghosh, S. An essential role for ECSIT in mitochondrial complex I assembly and mitophagy in macrophages. Cell Rep. 22, 2654–2666 (2018). - PMC - PubMed
    1. Mills, E. L. et al. Succinate dehydrogenase supports metabolic repurposing of mitochondria to drive inflammatory macrophages. Cell167, 457–470.e13 (2016). - PMC - PubMed
    1. Kravchuk, V. et al. A universal coupling mechanism of respiratory complex I. Nature10.1038/s41586-022-05199-7 (2022). - PubMed

MeSH terms

LinkOut - more resources