. 2025 Feb 19;25(1):55.
doi: 10.1186/s12935-025-03691-4.

EGFR-to-Src family tyrosine kinase switching in proliferating-DTP TNBC cells creates a hyperphosphorylation-dependent vulnerability to EGFR TKI

Affiliations

EGFR-to-Src family tyrosine kinase switching in proliferating-DTP TNBC cells creates a hyperphosphorylation-dependent vulnerability to EGFR TKI

Nazia Chaudhary et al. Cancer Cell Int. .

Abstract

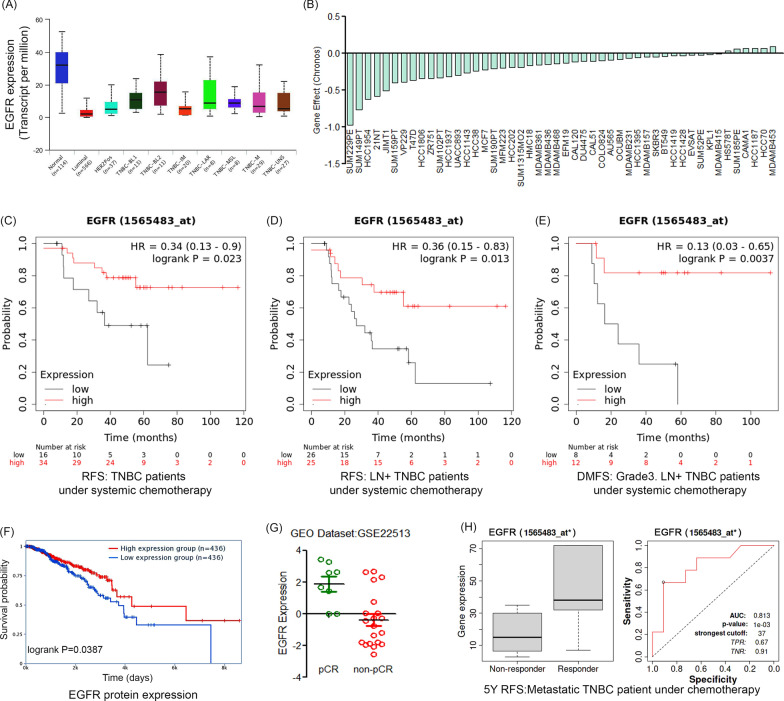
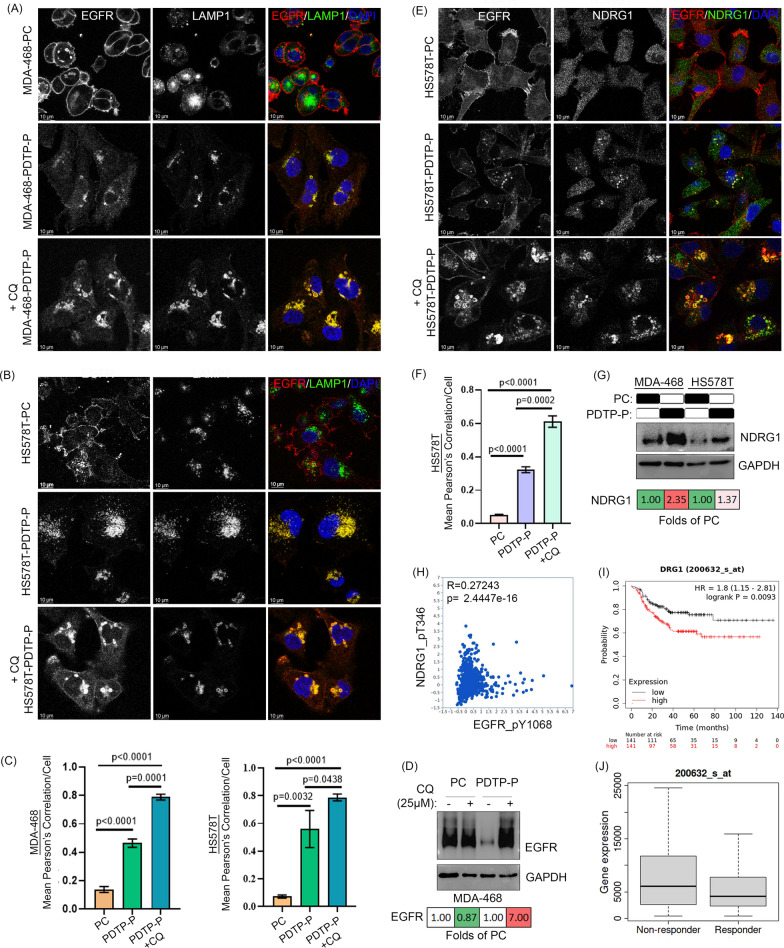
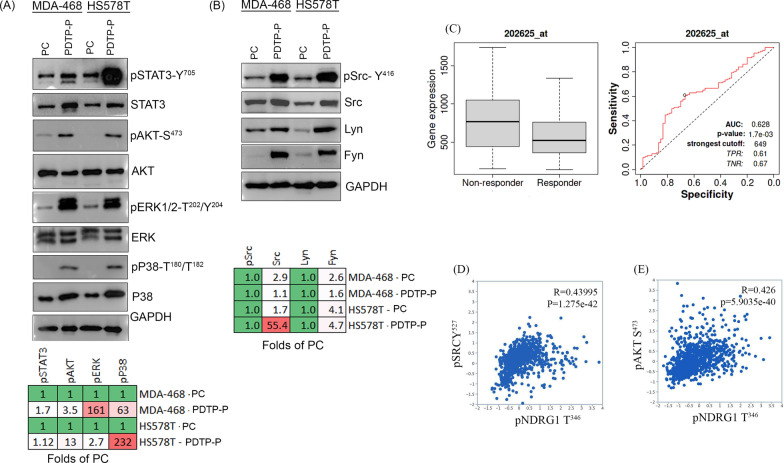
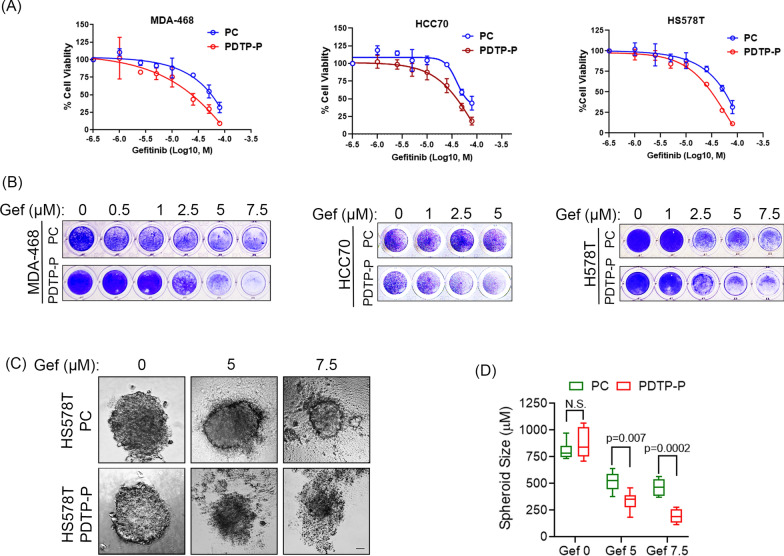
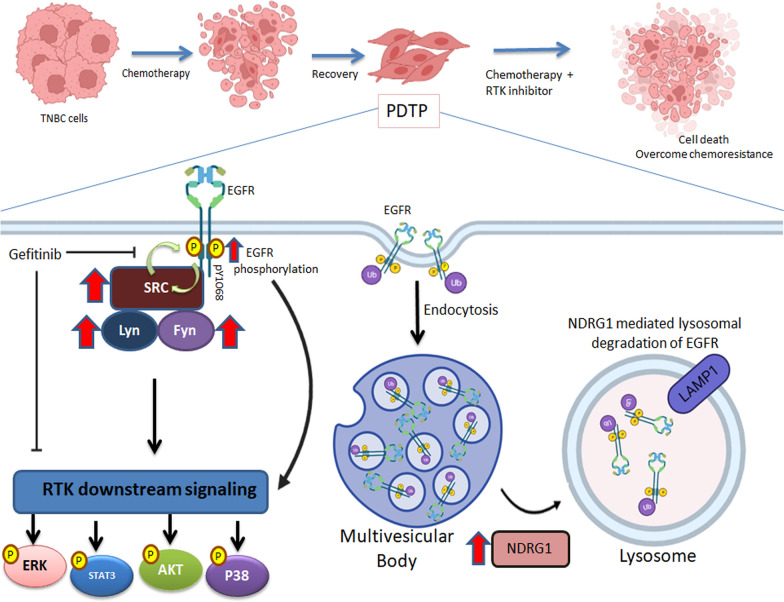
Triple-Negative Breast Cancer (TNBC) is the most aggressive type of breast malignancy, with chemotherapy as the only mainstay treatment. TNBC patients have the worst prognoses as a large fraction of them do not achieve complete pathological response post-treatment and develop drug-resistant residual disease. Molecular mechanisms that trigger proliferation in drug-resistant chemo-residual TNBC cells are poorly understood due to the lack of investigations using clinically relevant cellular models. In this study, we have established TNBC subtype-specific cellular models of proliferating drug-tolerant persister (PDTP) cells using different classes of chemotherapeutic agents that recapitulate clinical residual disease with molecular heterogeneity. Analysis of total phospho-tyrosine signals in TNBC PDTPs showed an enhanced phospho-tyrosine content compared to the parental cells (PC). Interestingly, using mass-spectrometry analysis, we identified a dramatic decrease in epidermal growth factor receptor (EGFR) expression in the PDTPs, while the presence of hyper-activated tyrosine phosphorylation of EGFR compared to PC. Further, we show that EGFR has enhanced lysosomal trafficking in PDTPs with a concomitant increase in N-Myc Downstream Regulated-1 (NDRG1) expression that co-localizes with EGFR to mediate receptor degradation. More surprisingly, we found that reduced protein levels of EGFR are coupled with a robust increase in Src family kinases, including Lyn and Fyn kinases, that creates a hyper-phosphorylation state of EGFR-Src tyrosine kinases axis in PDTPs and mediates downstream over-activation of STAT3, AKT and MAP kinases. Moreover, paclitaxel-derived PDTPs show increased sensitivity to EGFR TKI Gefitinib and its combination with paclitaxel selectively induced cell death in Paclitaxel-derived PDTP (PDTP-P) TNBC cells and 3D spheroids by strongly downregulating phosphorylation of EGFR-Src with concomitant downregulation of Lyn and Fyn tyrosine kinases. Collectively, this study identifies a unique hyper-phosphorylation cellular state of TNBC PDTPs established by switching of EGFR-Src family tyrosine kinases, creating a vulnerability to EGFR TKI.

Keywords: Combination therapy; EGFR; Proliferating drug-tolerant persister (PDTPs); Src family kinases; TNBC.


Conflict of interest statement

Declarations. Ethics approval and consent to participate: Not applicable. Consent for publication: Not applicable. Competing interests: The authors declare no competing interests.

Figures

Fig. 1
Fig. 1
EGFR downregulation and increased tyrosine phosphorylation are associated with PDTP state in all TNBC subtypes. A Schematic of Proliferating drug-tolerant persister (PDTP) model. Different subtypes of Triple-negative Breast cancer (TNBC) parental cell (PC) lines MDAMB4-68, HCC70, HS578T, and MDA-MB-453 were treated short-term with chemotherapy cytotoxic doses (IC80–95) in vitro. After a few days, quiescent drug-tolerant cancer cells were observed. Over time, these quiescent cancer cells resumed growth, establishing “recurrent” colonies. The PDTPs were resistant to the last doses of drugs given for selection. B The volcano plot below depicts the protein expression levels of 207 proteins as observed by mass spectrometry. The p-values are FDR-adjusted prior to further analysis and the level of significance is set at 0.05. Following these, 15 most significantly upregulated proteins have been plotted in red, and 52 significantly downregulated proteins have been plotted in blue. EGFR is found to be the most down-regulated. C Levels of EGFR and p-EGFR (Y1068) were determined in different subtypes of parental PC of TNBC and their PDTP-P cells. GAPDH served as their loading control. The expression levels of the indicated proteins were assessed by WB. Band intensities were quantified by ImageJ software and presented as folds change to PC (folds of PC) in the heat map at the right-side panel (red indicates increase and green indicate lower than PC). D Representative confocal images of the indicated TNBC PC and their Paclitaxel (PDTP-P) and Doxorubicin (PDTP-D) PDTP stained with EGFR and DAPI as described in Materials and Methods. Scale bar, 10 μm. E The mean fluorescence intensity of total cellular EGFR and cell-membrane localized EGFR were quantitated using Image J software in PC, PDTP-P, and PDTP-D of MDA-MB468. Similarly, membrane and cytoplasmic EGFR were quantitated in PC of MDA-MB468 and HS578T. F Effects of short-term treatment of Paclitaxel (10 nM) on the levels of EGFR and p-EGFR protein in the indicated cell lines as estimated by WB analysis at different time points of treatment. Heatmaps presented in the right panel show the fold change in the protein expression quantified by densitometric analysis using ImageJ and expressed as folds of untreated (UT) control cells. G The indicated TNBC cell lines were treated with different concentrations of paclitaxel (see Materials and Methods) for 24 h and levels EGFR and pEGFR proteins were assessed by WB. Beta-tubulin served as their loading control. Heatmaps at the right panel show the fold change in the protein expression quantified by densitometric analysis using ImageJ and expressed as folds of untreated (UT) control of respective cells
Fig. 2
Fig. 2
Low EGFR expression is a strong indicator of poor outcomes in chemotherapy-treated TNBC patients. A EGFR mRNA expression (transcript per million) in human normal breast tissues and in TNBC patient tissues belonging to different TNBC subtypes are shown as a box plot derived from TCGA data. B Waterfall plot showing the effect of EGFR gene CRISPR gene knockout in breast cancer cell lines in the order of intensity represented as Chronos scores. C Kaplan–Meier plot showing RFS in TNBC patients under chemotherapy. Similarly, D RFS is shown using mRNA expressions of EGFR in lymph node-positive (LN +) TNBC patient samples treated with chemotherapy and stratified into a high or low expression using the auto expression value as the cut-off point. E DMFS in high-grade LN + TNBC patients under chemotherapy is shown in Kaplan–Meier plot. Expression of EGFR in TNBC tissues was stratified into a high or low expression using auto-cut values. Gene expression of all the breast cancer patients having low (Black) or high (Red) EGFR expression is defined by their median values. The HR score and corresponding p-value for the Log-rank test is indicated. F Kaplan–Meier plot showing breast cancer patients’ survival as a function of EGFR protein levels using the proteomic TCPA data. G Dot plot showing differential expression of EGFR gene in tumors of breast cancer patients achieving pCR and non-pCR as analysed from gene expression dataset (GSE22513) using GEOR on GEO in 28 patient samples treated with Taxane. H Box plot showing gene expression of EGFR in responders vs. non-responders and ROC curve comparing sensitivity and specificity of EGFR gene for classifying responders vs non-responders LN + TNBC patients with chemotherapy
Fig. 3
Fig. 3
EGFR is trafficked to the lysosomal pathway for degradation through increased NDRG1 in TNBC PDTPs. A and B Representative confocal images of the indicated PC and their PDTP-P TNBC cells stained with EGFR, LAMP1 and DAPI ± treatment with CQ (25 μM for 12 h) as described in Materials and Methods. Scale bar, 10 μm. C Bar graph showing mean pearson’s correlation of EGFR and LAMP1 per cell depicting colocalization of these proteins were quantitated using LAS X software in PC, PDTP-P and PDTP-P + CQ of MDA-MB-468 and HS578T cells. D Levels of EGFR determined in MDA-MB-468 PC and their PDTP-P with and without CQ (25 μM for 12 h) treatment as determined by WB analysis and quantified using densitometric analysis by ImageJ, presented as folds of PC. E Representative confocal images of the HS578T PC and their PDTP-P stained with EGFR, NDRG1 and DAPI ± treatment with CQ (25 μM for 12 h) as described in Materials and Methods. Scale bar, 10 μm. F Bar graph showing mean pearson’s correlation of EGFR and NDRG1 per cell depicting colocalization of these proteins were quantitated using LAS X software in PC, PDTP-P and PDTP-P + CQ of HS578T cells. G Levels of NDRG1 were determined in PC MDA-MB-468 and HS578T and their PDTP-Ps. GAPDH served as their loading control. The expression levels of the indicated proteins were assessed by WB, and band intensities were quantified by ImageJ software and presented as fold of control in the heatmaps (red indicates increase, and green indicates lower than PC). H Correlation plot showing the spearman’s correlation between pEGFR pY1068 and pNDRG1 pT346 protein expression in breast cancer using the BRCA cohort on TCPA. I mRNA expression of NDRG1 in TNBC chemotherapy-treated patient tissue samples was stratified into a high or low expression using the median expression value as the cut-off point. The corresponding p-value for the Log-rank test in chemotherapy-treated TNBC patient tissue samples was shown. Higher mRNA expressions of NDRG1 were significantly associated with poorer Recurrence-free survival (RFS) in TNBC chemotherapy-treated TNBC patients. Gene expression of all the TNBC chemo patient’s samples having low (Black) or high (Red) NDRG1 expression defined by their median value is shown. J Box plot of gene expression of NDRG1 in responders vs non-responders in chemotherapy- treatment TNBC patients cohort
Fig. 4
Fig. 4
TNBC PDTPs have elevated activation of RTK signaling due to increased expression of Src family tyrosine kinases which indicate non-response in TNBC patients with chemotherapy and positive association with NDRG1. A Levels of STAT3, AKT, ERK, and p38MAPK and their phosphorylated forms were determined in MDA-MB-468 and HS578T PC and PDTP-P cells. GAPDH served as their loading control. The expression levels of the indicated proteins were assessed by WB, and band intensities were quantified by ImageJ software and presented as fold of PC in the heatmaps (red indicates increase, and green indicates lower than PC). B Levels of Src, p-Src, Lyn, and Fyn were determined in PC MDA-MB-468 and HS578T TNBC cell lines and PDTP-P cells. GAPDH served as the loading control. The expression levels of the indicated proteins were assessed by WB, and band intensities were quantified by ImageJ software and presented as fold of control in the heatmap. C Box plot of gene expression of Lyn in responders vs non-responders to chemotherapy treatment in TNBC patient samples. ROC curve comparing sensitivity and specificity of Lyn gene for classifying responders vs non-responders to the chemo-treatment in TNBC patient samples. D Spearman’s Correlation plots between p- SRC and p-NDRG1 and E between p-Akt and p-NDRG1 in breast cancer samples obtained from BRCA TCPA datasets
Fig. 5
Fig. 5
TNBC PDTPs are more sensitive to EGFR inhibitor Gefitinib. A Dose–response curves of varying concentrations of Gefitinib in the indicated cell lines (PDTP and PDTP-P) treated for 72 h. Dose–response curves are presented as means of three replicates. B Effects of Gefitinib on cell viability. The indicated PC, TNBC cell lines and their PDTP-P were treated with the indicated doses of the drugs for 72 h and stained with crystal violet. Representative pictures of reproducible effects from two to three independent experiments are shown. C Effects of drug combinations on HS578T-PC and PDTP-P spheroid growth with and without Gefitinib (0, 5 and 7.5 µM) treatment. Representative micrographs (10 × magnification) images of day 15 old spheroids (n = 6 spheroids) are shown. Control untreated and Gefitinib-treated spheroids with a single agent with the indicated drug levels are shown. Scale bar, 100 μm. D The spheroid size was calculated and represented in the graph with a statistical t-test to compare the groups to the untreated control
Fig. 6
Fig. 6
Combination of Gefitinib and paclitaxel selectively induce cell death in PDTP-P cells by suppressing EGFR-Src hyper-phosphorylation and downregulation of Lyn and Fyn kinases. A Effects of Gefitinib and Paclitaxel on cell viability. The indicated PC TNBC cell lines and their PDTP-P were treated with the indicated doses of the Gefitinib and Paclitaxel drugs for 72 h and stained with crystal violet. Representative pictures of reproducible effects from two to three independent experiments are shown. B The indicated cell lines were treated with Gefitinib and Paclitaxel at the indicated dose (see Materials and Methods). Cell viability (MTT assay) is presented as the percentage viability of untreated cells. The mean values of three experiments are shown. C Effects of drug combinations on PC- and PDTP-P-HS578T-spheroid growth. Representative micrographs (10 × magnification) images of day 15 day-old spheroids are shown. Control, untreated, and Gefitinib treated spheroids with a single agent and with the Paclitaxel drug levels are shown. Scale bar, 100 μm. D Spheroid volume was calculated and represented in the graph with a statistical t-test to compare the groups to the untreated control. E Heatmap showing the percent cell viability of spheroid cells estimated by cell titer blue viability assays. The difference between the two groups was tested for statistical significance using Two-way ANOVA. F The expression levels of the indicated proteins were assessed in MDA-MB-468 cell line treated with Gefitinib and Paclitaxel as indicated by WB. G Heatmaps showing fold changes in MDA-MB-468-PDTP-P and HS56T-PDTP-P as compared to corresponding parental cells are shown. The expression of Lyn and Fyn kinases Quantitative band intensities were quantified by ImageJ software and presented as fold of control in the heatmaps
Fig. 7
Fig. 7
Schematic model summarizing the main findings of the study. TNBC cells treated with chemotherapeutic drugs will develop PDTP cells which have enhanced lysosomal trafficking of EGFR which is mediated by increased levels of NDRG1 to degrade EGFR. Despite having lower levels of total EGFR, PDTP cells have higher levels of Src family Kinase including Lyn and Fyn which maintains the activation of EGFR and leads to robust EGFR-Src tyrosine kinase axis. This EGFR-Src signalling axis is required for the downstream over-activation of STAT3, AKT and MAP kinases. Inhibiting EGFR-Src signaling axis with gefitinib and its combination with paclitaxel increases cell death in PDTP and thus depicting the unique switching of EGFR–Src family tyrosine kinases creating a vulnerability to EGFR TKI

References

    1. Garrido-Castro AC, Lin NU, Polyak K. Insights into molecular classifications of triple-negative breast cancer: improving patient selection for treatment. Cancer Discov. 2019;9(2):176–98. - PMC - PubMed
    1. Penault-Llorca F, Viale G. Pathological and molecular diagnosis of triple-negative breast cancer: a clinical perspective. Ann Oncol. 2012;23:vi19–22. - PubMed
    1. Hubalek M, Czech T, Müller H. Biological subtypes of triple-negative breast cancer. Breast Care. 2017;12(1):8–14. - PMC - PubMed
    1. Yin L, et al. Triple-negative breast cancer molecular subtyping and treatment progress. Breast Cancer Res. 2020;22:1–13. - PMC - PubMed
    1. Lehmann BD, et al. Identification of human triple-negative breast cancer subtypes and preclinical models for selection of targeted therapies. J Clin Investig. 2011;121(7):2750–67. - PMC - PubMed

LinkOut - more resources