. 2025 Feb 19;23(1):99.
doi: 10.1186/s12964-025-02069-3.

Intrinsic STING of CD8 + T cells regulates self-metabolic reprogramming and memory to exert anti-tumor effects

Affiliations

Intrinsic STING of CD8 + T cells regulates self-metabolic reprogramming and memory to exert anti-tumor effects

Qiuli Xu et al. Cell Commun Signal. .

Abstract

Background: Our team has previously found that the stimulator of interferon genes (STING) plays a more significant anti-tumor role in host immune cells than in tumor cells. Although STING is necessary for CD8 + T cells to exert immunological activity, its effect on CD8 + T cells remains debatable. In this study, we used both in vitro and in vivo models to explore the metabolic effects of STING on CD8 + T cells.

Methods: Peripheral blood lymphocytes were procured from non-small cell lung cancer (NSCLC) patients receiving anti-PD-1 therapy to investigate the correlation between STING expression levels, CD8 + T-cell subsets, and immunotherapy efficacy. STING knockout (STING-KO) mice were used for in vivo studies. RNA-seq, seahorse, flow cytometry, electron microscopy, qPCR, immunofluorescence, western blotting, and immunoprecipitation were performed to explore the underlying mechanisms of STING in regulating CD8 + T cell function.

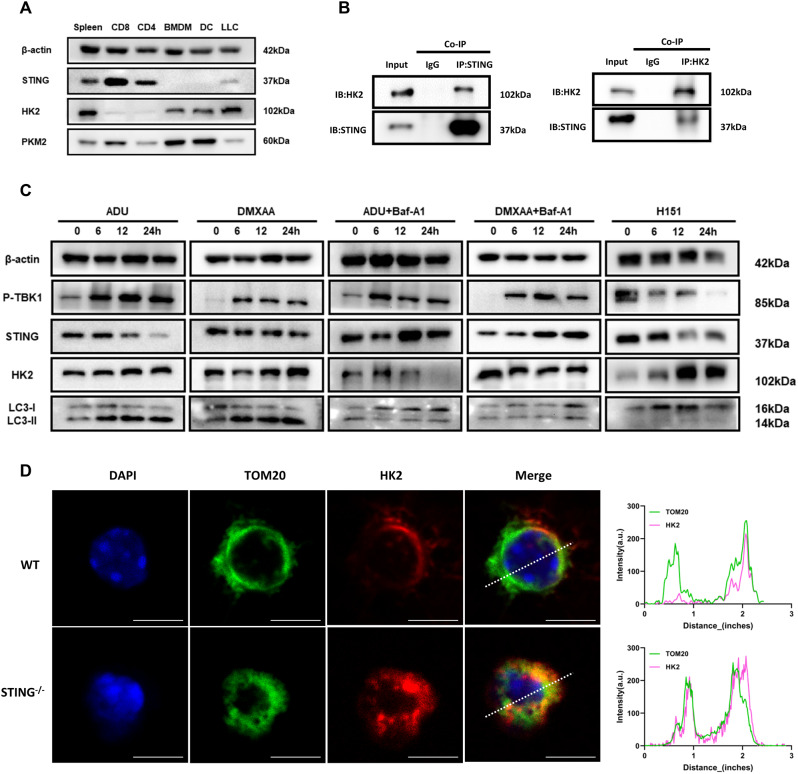
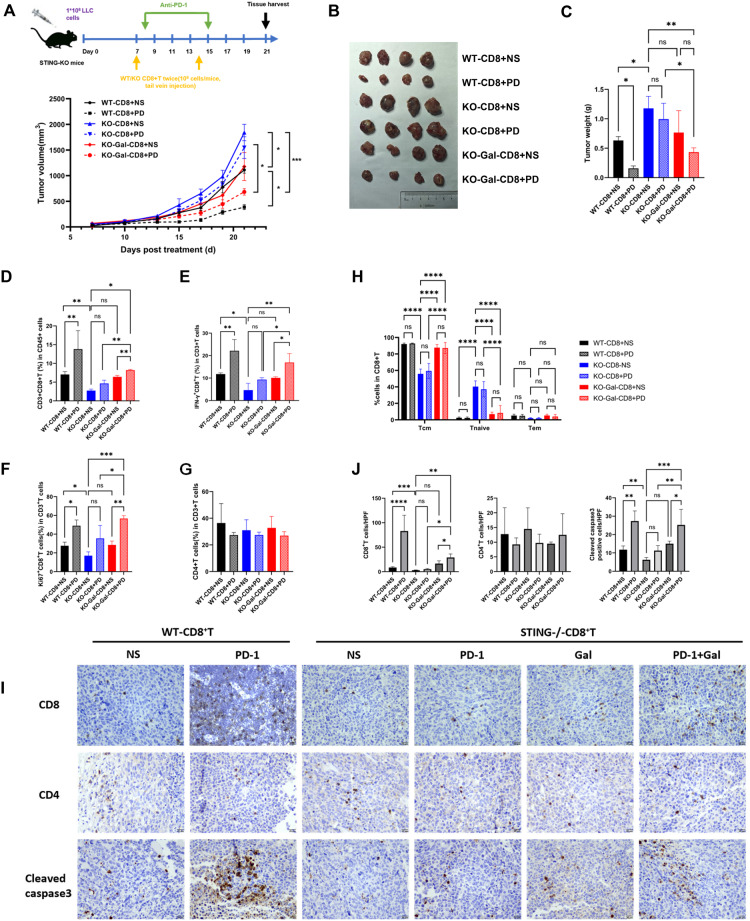
Results: We discovered that the expression level of STING in immune cells exhibited a significant correlation with immunotherapy efficacy, as well as with the proportion of central memory CD8 + T cells. Moreover, we found that the loss of the STING gene results in a reduction in the number of mitochondria and a change in the metabolic pathway selection, thereby inducing excessive glycolysis in CD8 + T cells. This excessive glycolysis generates high levels of lactate, which further inhibits IFN-γ secretion and impacts memory T cell differentiation. Correcting the glycolysis disorder partially restored function and IFN-γ secretion, rescued the central memory CD8 + T subset, and improved immunotherapy in STING-KO mice. This provides a new treatment strategy for patients with low STING expression and a poor response to immunotherapy.

Conclusion: Intrinsic STING of CD8 + T cells affects their function through the HK2/Lactate/IFN-γ axis and affects memory differentiation by regulating glycolysis.

Keywords: CD8 + T cells; Glycolysis; Immunotherapy; Metabolic reprogramming; Non-small cell lung cancer; STING.


Conflict of interest statement

Declarations. Data statement: The datasets used and/or analyzed during the current study are available from the corresponding author on reasonable request. Ethical approval and consent to participate: This study was approved by the Ethics committee of Jinling Hospital. All participants provided written informed consent. All animal experiments were performed following the guidelines of the Institutional Animal Care and Use Committee of the Southeast University Medical College. Competing interests: The authors declare no competing interests.

Figures

Fig. 1
Fig. 1
Intrinsic STING in immune cells affects immune efficacy and memory T subsets in CD8 + T cells. (A-B) Schematic of the tumor transplantation, dose regimen (up), and representative tumor growth curves (bottom) (n = 4/group). The weight (B) of tumors was quantified. (C-D) Representative statistic plots of the proportion of CD3 + CD8 + T cells in TILs or spleens from different treatment groups. (E) Schematic representation of the co-culture model in vitro. (F-G) Killing Rates and proportion of CD3 + CD8 + T Cells in different groups (n > = 3/group). (H) The expression level of STING mRNA in different immune cells. (I) Dot plots showing the level of STING mRNA in peripheral blood lymphocytes between DCB and NDB groups at baseline (n = 15/group). (J) Dot plots showing the proportion of memory T in CD8 + T cells between DCB and NDB groups at baseline (n = 15/group). (K) Dot plots showing the proportion of Tcm in CD8 + T cells at various time points in DCB (left) or NDB (right) group (n = 15/group). (L) Pearson correlation coefficient analysis of Tcm percentage and STING mRNA expression (n = 30). (M) Representative flow images (left) and statistic plots (right) displaying the proportion of CD44 + CD62L+ (Tcm), CD44-CD62L+ (T naive), CD44 + CD6L- (Tem) cells in WT/STING−/− CD8 + T cells (n > = 3/group). WT: wild-type; KO: STING knock-out; NS: no stimulate and treated with IgG isotype; PD: anti-PD-1 treatment; ns, not significant; *p < 0.05, **p < 0.01, ***p < 0.001 and ****p < 0.0001
Fig. 2
Fig. 2
Intrinsic STING in CD8 + T cells affects the number and function of mitochondria. (A) MitoTracker Green staining in CD8 + T cells to assess mitochondrial mass. Representative immunofluorescence images (left) and statistic plots (right) of the relative mean fluorescence intensity (MFI) in WT /STING−/− CD8 + T cells (400x). (B) Representative images of TEM (left) and quantification of mitochondria (right) in WT/STING−/− CD8 + T cells (n = 3/group). Scale bar = 1 μm. (C) Representative flow images (left) and statistic plots (right) of the proportion of JC-1 monomers in WT/STING−/− CD8 + T cells (n = 3/group). (D) Representative histograms of MitoSOX expression (up) and statistic plots (bottom) in CD8 + T cells from different mice (n = 3/group). (E) Representative histograms comparing the purity of CD8 + T cells between sorted and unsorted. (F) The pattern of preparation for CD8 + T collection before RNA sequencing. (G) Numbers of gene expression changes in different signaling pathways in STING−/− CD8 + T cells. Blue (down-regulated genes) and red (up-regulated genes). ns, not significant; *p < 0.05, **p < 0.01, ***p < 0.001 and ****p < 0.0001
Fig. 3
Fig. 3
STING-KO CD8 + T cells exhibit glycolytic and OXPHOS imbalances. (A) Measurement of the ECAR (left) in WT/STING−/− CD8 + T cells. Glycolysis, glycolytic capacity, and glycolytic reserve were calculated (right) by the corresponding formulas (n = 5/group). (B) Measurement of the OCR (left) in WT/STING−/− CD8 + T cells. Basal respiration, spare respiratory capacity, and maximum respiration were calculated (right) by the corresponding formulas (n = 5/group). (C) The image depicts the color change observed in the cell culture medium following 48 h (left). Statistic plots (right) of the lactate content in supernatant from WT/STING−/− CD8 + T cells (n = 4). (D-G) Expression levels of several representative genes in metabolic pathways (glycolysis, TCA cycle, one-carbon metabolism, and OXPHOS) (n > = 3/group). ns, not significant; *p < 0.05, **p < 0.01, ***p < 0.001 and ****p < 0.0001
Fig. 4
Fig. 4
STING negatively regulates the expression and localization of HK2. (A) Western blot analysis of STING, HK2, and PKM2 protein expression in immune cells and LLCs. (B) Co-immunoprecipitation and immunoblotting of endogenous STING and HK2 in CD8 + T cells. Anti-STING and anti-HK2 antibodies were used for immunoprecipitation. (C) Western blot analysis of STING, HK2, P-TBK1, LC3-I/II protein expression in CD8 + T cells stimulated with ADU-S100 (5 μm), DMXAA (25ug/mL) with or without Baf-A1(400 μm) and H151 (1 μm) for the indicated amount of time. (D) Representative immunofluorescent images (left) of the HK2 protein (red) localization on mitochondria (green) in WT/STING−/− CD8 + T cells. Scale bar = 5 μm. The fluorescence intensity profiles along the white dotted lines were shown on the right
Fig. 5
Fig. 5
Inhibiting glycolysis redeems the function of STING-KO CD8 + T in vitro co-culture model. (A) Graphical representation of glycolytic imbalance in STING-KO CD8 + T cells. The upregulated steps were highlighted using yellow boxes. (B) Western blot analysis of HK2 protein expression change in WT/STING−/− CD8 + T cells after direct (2DG) or indirect inhibition (Galactose) of glycolysis for 48 h. (C) Statistic plots of the lactate content in supernatant from WT/STING−/− CD8 + T cells after glycolysis inhibition for 48 h (n = 4/group). (D-G) Comparison of effector function between WT and STING−/− CD8 + T cells after direct/indirect inhibition of glycolysis (n > = 3/group). (D) Representative flow images (left) and statistic plots (right) displaying the proportion of killed tumor cells in CD45-cells co-cultured with different CD8 + T cells for 48 h. Representative flow images (left) and statistic plots (right) of IFN-γ+ (E), GZMB+ (F), and Ki67+ (G) in CD8 + T cells. (H) After 48 h of conditioning, CD8 + T cells continued to be cultured for 21 days to observe changes in the memory subsets. Representative flow images (left) and statistic plots (right) showing the proportion of memory T in CD8 + T cells (n = 3/group). (I) Tumor inhibition rates were measured by the Lactate dehydrogenase (LDH) cytotoxicity assay (n = 3/group). (J) ELISA analysis of IFN-γ secreted from different co-culture medium (n = 3/group). ns, not significant; *p < 0.05, **p < 0.01, ***p < 0.001 and ****p < 0.0001
Fig. 6
Fig. 6
Inhibiting LDH rescues the function of STING-KO CD8 + T in vitro co-culture model. (A) Western blot analysis of LDHB protein expression change after the low (15 µM) or high (30 µM) dose of galloflavin for 48 h in WT/STING−/− CD8 + T cells. (B) Statistic plots of the lactate content in supernatant from WT/STING−/− CD8 + T cells after galloflavin for 48 h (n = 3/group). (C) ELISA analysis of IFN-γ secreted from different co-culture medium (n = 3/group). (D-G) Comparison of effector function between WT and STING−/− CD8 + T cells after inhibition of lactate production for 48 h (n = 3/group). (D) Representative flow images (left) and statistic plots (right) displaying the proportion of killed tumor cells in CD45-cells co-cultured with different CD8 + T cells for 48 h. Representative flow images (left) and statistic plots (right) of IFN-γ+ (E), GZMB+ (F), and Ki67+ (G) in CD8 + T cells. (H) After 48 h of conditioning, CD8 + T cells continued to be cultured for 21 days to observe changes in the memory subsets. Representative flow images (left) and statistic plots (right) showing the proportion of memory T in CD8 + T cells (n = 3/group). Gal: Galloflavin; ns, not significant; *p < 0.05, **p < 0.01, ***p < 0.001 and ****p < 0.0001
Fig. 7
Fig. 7
STING mainly affects IFN-γ not other interferons in regulating CD8 + T cell glycolysis. (A-C) STING−/− CD8 + T cells were treated with 2DG or galloflavin for 48 h, then co-culture with LLCs with or without anti-IFN-γ (10ug/mL) for 48 h. Comparison of effector function between CD8 + T cells under different conditions (n = 3/group). Representative flow images (A) and statistic plots (E) displaying the proportion of killed tumor cells in CD45-cells co-cultured with CD8 + T cells under different conditions for 48 h. Representative flow images (B) and statistic plots (F) of IFN-γ + in CD8 + T cells. After 48 h of conditioning, CD8 + T cells continued to be cultured for 21 days to observe changes in the memory subsets. Representative flow images (C) and statistic plots (G) showing the proportion of memory T in CD8 + T cells (n = 3/group). (D) ELISA analysis of IFN-γ inhibition efficiency (n = 3/group). (H) ELISA analysis of IFN-α inhibition efficiency (n = 3/group). (I-K) Statistic plots of the proportion of killed tumor cells in CD45-cells, IFN-γ+, and memory T in CD8 + T cells (n = 3/group). Gal: Galloflavin; IFN-γ in: IFN-γ inhibitor; ns, not significant; *p < 0.05, **p < 0.01, ***p < 0.001 and ****p < 0.0001
Fig. 8
Fig. 8
The combination of Gal-CD8 + T cells and anti-PD-1 showed a remarkable anti-tumor effect. (A) Schematic of the tumor transplantation, dose regimen, CD8 + T cell infusion (up), and representative tumor growth curves (bottom) (n = 4/group). STING-KO CD8 + T cells were treated with galloflavin (30 µM) or PBS for 48 h before tail vein injection. The tumor size (B) and weight (C) were measured at the endpoint. (D-G) Statistic plots of the proportion of CD3 + CD8 + T, IFN-γ + CD8 + T, Ki67 + CD8 + T, and CD4 + T cells in TILs from different treatment groups (n > = 3/group). (H) Statistic plots of the proportion of memory T in CD8 + T cells in TILs (n = 3/group). Representative IHC images (I) and statistic plots (J) of CD8, CD4, cleaved caspase3 staining in tumor tissue (n > = 3/group). Scale bars = 20 μm. WT: wild-type; KO: STING knock-out; NS: no stimulate and treated with IgG isotype; PD: anti-PD-1 treatment; Gal: Galloflavin; ns, not significant; *p < 0.05, **p < 0.01, ***p < 0.001 and ****p < 0.0001
Fig. 9
Fig. 9
The glucose metabolism and oxidative phosphorylation imbalance occur in STING-KO CD8 + T cells. The key glycolytic protein HK2 loses the inhibitory effect of STING, resulting in a large accumulation of HK2 on the mitochondrial membrane. This leads to excessive activation of glycolysis and overproduction of lactic acid, which disrupts normal metabolic processes. Consequently, this inhibits the production of IFN-γ, impairs the differentiation of central memory T cells, and ultimately affects the anti-tumor effect. (created by MedPeer: www.medpeer.cn)

References

    1. Martínez-Reyes I, Chandel NS. Cancer metabolism: looking forward, Nature reviews. Cancer. 2021;21:669–80. - PubMed
    1. Gaude E, Frezza C. Tissue-specific and convergent metabolic transformation of cancer correlates with metastatic potential and patient survival. Nat Commun. 2016;7:13041. - PMC - PubMed
    1. Hu J, Locasale JW, Bielas JH, O’Sullivan J, Sheahan K, Cantley LC, Vander Heiden MG, Vitkup D. Heterogeneity of tumor-induced gene expression changes in the human metabolic network. Nat Biotechnol. 2013;31:522–9. - PMC - PubMed
    1. Lyssiotis CA, Kimmelman AC. Metabolic interactions in the Tumor Microenvironment. Trends Cell Biol. 2017;27:863–75. - PMC - PubMed
    1. Reina-Campos M, Moscat J, Diaz-Meco M. Metabolism shapes the tumor microenvironment. Curr Opin Cell Biol. 2017;48:47–53. - PMC - PubMed

MeSH terms