

Distinct metabolic profiles of circulating plasmacytoid dendritic cells in systemic sclerosis patients stratified by clinical phenotypes
- PMID: 39972361
- PMCID: PMC11837673
- DOI: 10.1186/s13075-025-03500-3
Distinct metabolic profiles of circulating plasmacytoid dendritic cells in systemic sclerosis patients stratified by clinical phenotypes
Abstract
Background: Plasmacytoid dendritic cells (pDCs) play a key role in systemic sclerosis (SSc) pathophysiology. However, despite the recognised importance of metabolic reprogramming for pDC function, their metabolic profile in SSc remains to be elucidated. Thus, our study aimed to explore the metabolic profile of pDCs in SSc and their potential contribution to the disease.
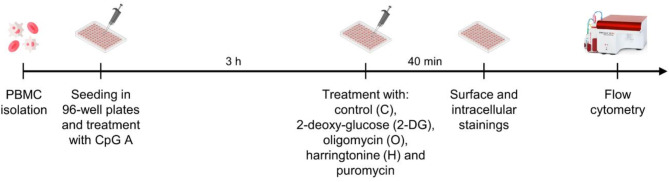
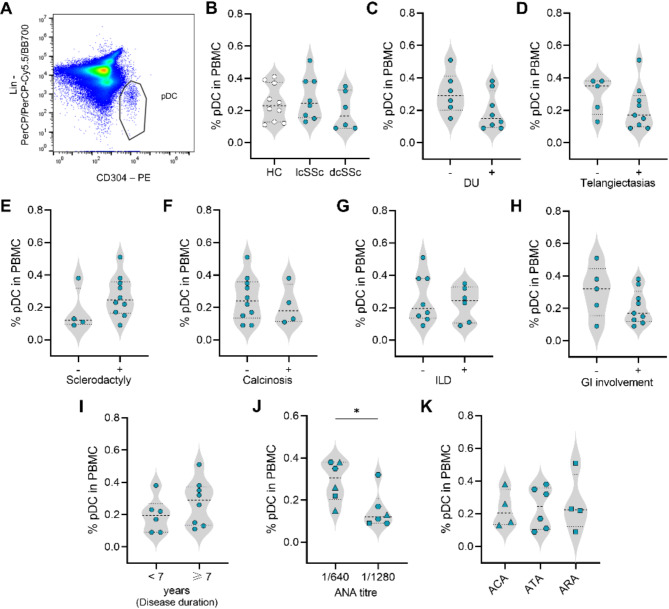
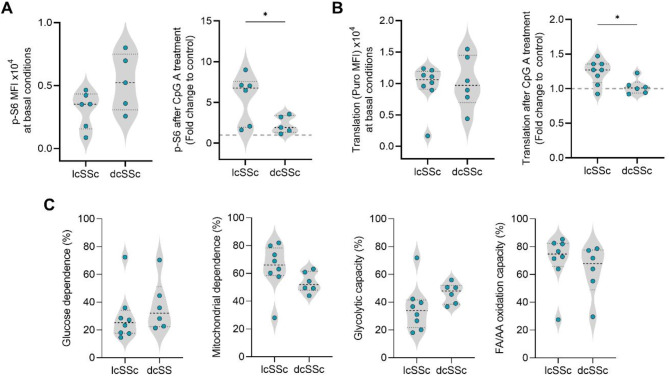
Methods: Peripheral blood mononuclear cells (PBMCs) were isolated from the blood of healthy donors and SSc patients. SCENITH™, a single-cell flow cytometry-based method, was applied to infer the metabolic profile of circulating pDCs from patients with SSc. pDCs (CD304+ Lin-) at steady-state or stimulated with CpG A were analysed. Toll-like receptor (TLR)9 activation was confirmed by ribosomal protein S6 phosphorylation.
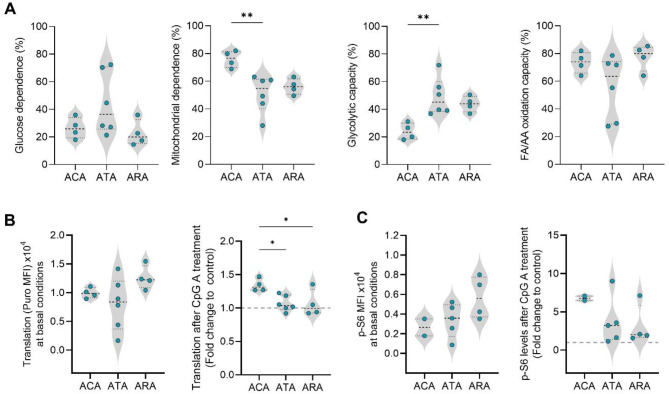
Results: Circulating pDCs from ten healthy donors and fourteen SSc patients were analysed. pDCs from anti-centromere antibody-positive (ACA+) patients displayed higher mitochondrial dependence and lower glycolytic capacity than those from anti-topoisomerase I antibody-positive (ATA+) patients. Furthermore, cells from both ACA+ patients and limited cutaneous SSc (lcSSc) patients showed a stronger response towards TLR9 activation than cells from ATA+, anti-RNA polymerase III antibody-positive (ARA+) or diffuse cutaneous SSc (dcSSc) patients.
Conclusions: An innovative single cell flow cytometry-based methodology was applied to analyse the metabolic profile of pDCs from SSc patients. Our results suggest that pDCs from ACA+ patients rely more on oxidative phosphorylation (OXPHOS) and are more responsive to external stimuli, whereas pDCs from ATA+ patients may exhibit a more activated or exhausted profile.
Keywords: Dendritic cells; Immunometabolism; Plasmacytoid dendritic cells; Scleroderma; Systemic sclerosis.
© 2025. The Author(s).
Conflict of interest statement
Declarations. Ethics approval and consent to participate: All participants signed an informed consent form before inclusion and clinical data collected were anonymised. This study was approved by the Ethics Committee of Centro Hospitalar do Baixo Vouga (now ULS-RA) (Reference 44-069-2021). Consent for publication: Not applicable. Competing interests: Rafael J. Argüello is scientist and co-founder of GammaOmics, a startup that holds the exclusive license to commercialize and provide services for SCENITH™, a technology utilized in this study. No other conflicts of interest are declared.
Figures

References
-
- Denton CP, Khanna D. Systemic sclerosis. Lancet. 2017;390:1685–99. - PubMed
-
- Van Den Hoogen F, Khanna D, Fransen J, Johnson SR, Baron M, Tyndall A, et al. 2013 classification criteria for systemic sclerosis: an American college of rheumatology/European league against rheumatism collaborative initiative. Ann Rheum Dis. 2013;72(11):1747–55. - PubMed
MeSH terms
Substances
Grants and funding
- EBF and WSF Research Grant Programme 2022-2023/World Scleroderma Foundation and Edith Busch Stiftung
- UIDB/04501/2020, DOI 10.54499/UIDB/04501/2020, UIDP/04501/2020, DOI 10.54499/UIDP/04501/2020/Fundação para a Ciência e a Tecnologia (FCT)
- UIDB/50011/2020 (DOI 10.54499/UIDB/50011/2020), UIDP/50011/2020 (DOI 10.54499/UIDP/50011/2020) & LA/P/0006/2020 (DOI 10.54499/LA/P/0006/2020)/Fundação para a Ciência e a Tecnologia (FCT)
- (LA/P/0008/202, DOI 10.54499/LA/P/0008/2020; UIDP/50006/2020, DOI 10.54499/UIDP/50006/2020; UIDB/50006/2020, DOI10.54499/UIDB/50006/2020)/Fundação para a Ciência e a Tecnologia
LinkOut - more resources
Full Text Sources
Medical
Research Materials
