

Polycystic ovary syndrome and epithelial-mesenchymal transition: Mendelian randomization and single-cell analysis insights
- PMID: 39972362
- PMCID: PMC11841333
- DOI: 10.1186/s13048-025-01617-2
Polycystic ovary syndrome and epithelial-mesenchymal transition: Mendelian randomization and single-cell analysis insights
Abstract
Background: The process of epithelial-mesenchymal transition (EMT) may promote fibrosis in ovarian tissue related to polycystic ovary syndrome (PCOS), thus affecting ovarian function and hormonal balance.
Objective: This study aimed to explore key genes associated with EMT in PCOS and their potential molecular regulatory mechanisms, exclusively from the perspective of transcriptomics and single-cell RNA sequencing (scRNA-seq), combined with Mendelian Randomization (MR) analysis.
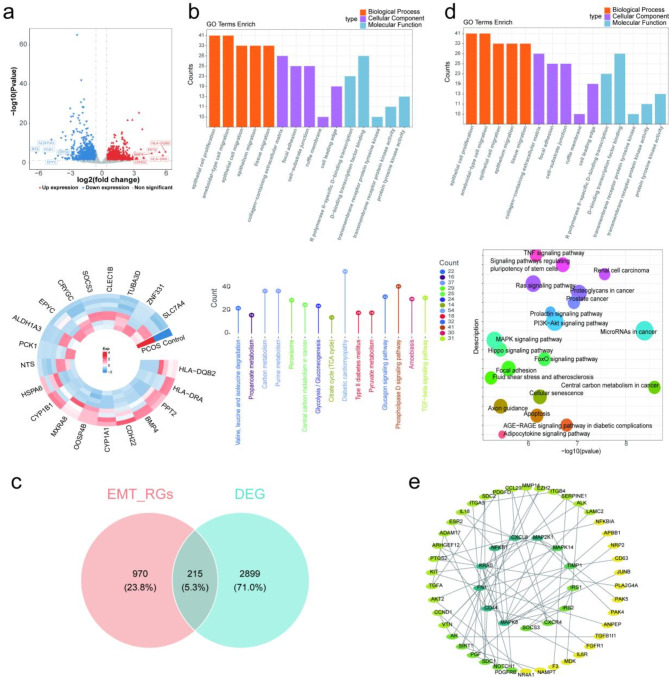
Methods: The dataset for PCOS and EMT-related genes (EMT-RGs) were sourced from public databases. The key genes in this study were identified via differential expression analysis, MR, and evaluation of expression levels. Enrichment analysis and a series of functional analyses were conducted on these genes to further elucidate their potential mechanisms. Subsequently, using scRNA-seq data and validation of the expression of key genes, key cell group in PCOS were identified, followed by pseudo-time and cell communication analyses to provide deeper insights.
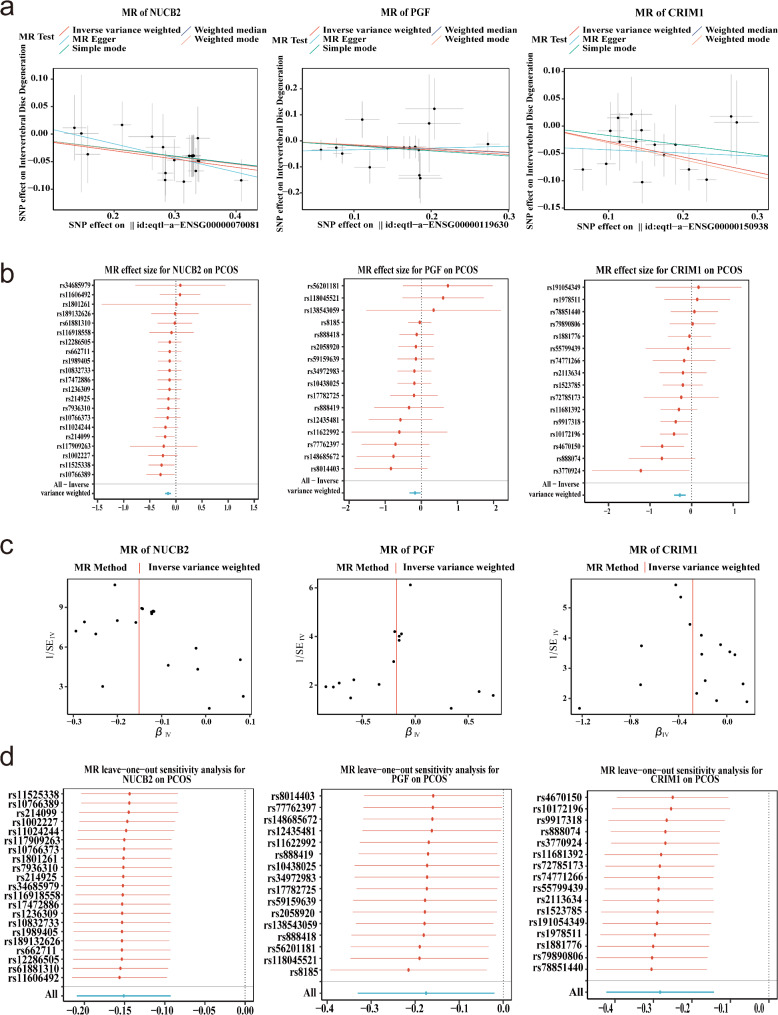
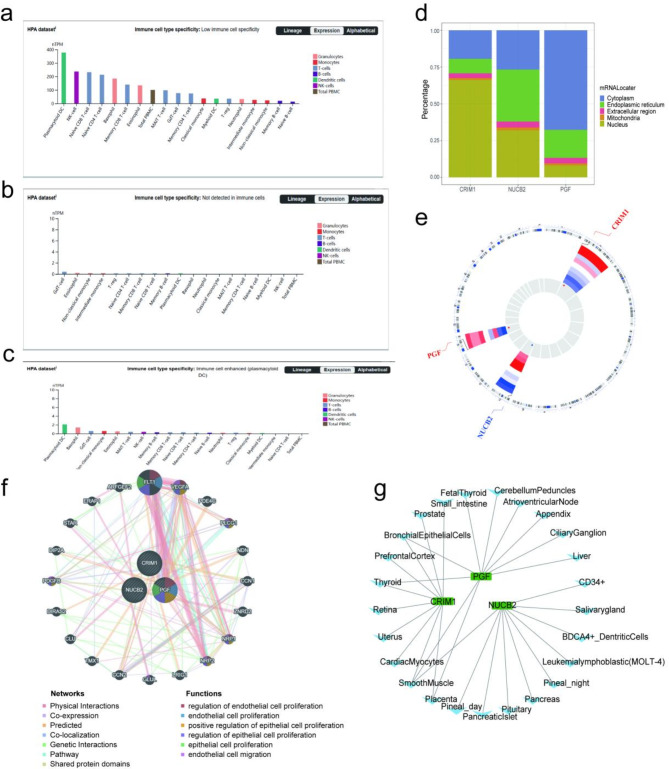
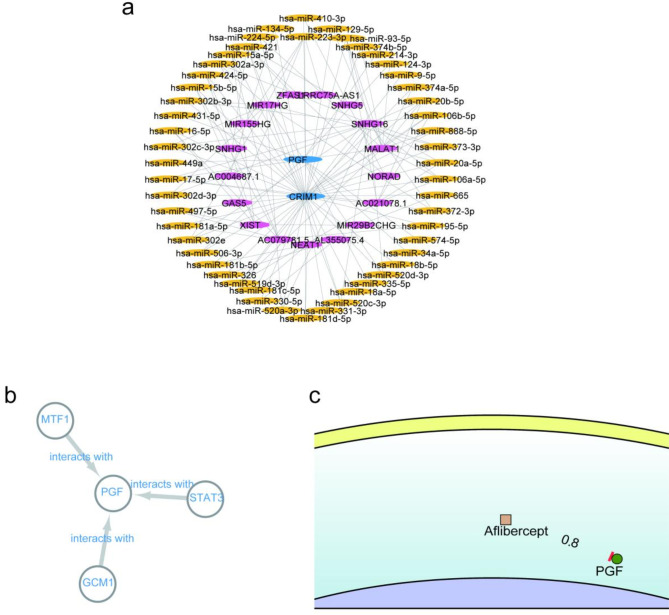
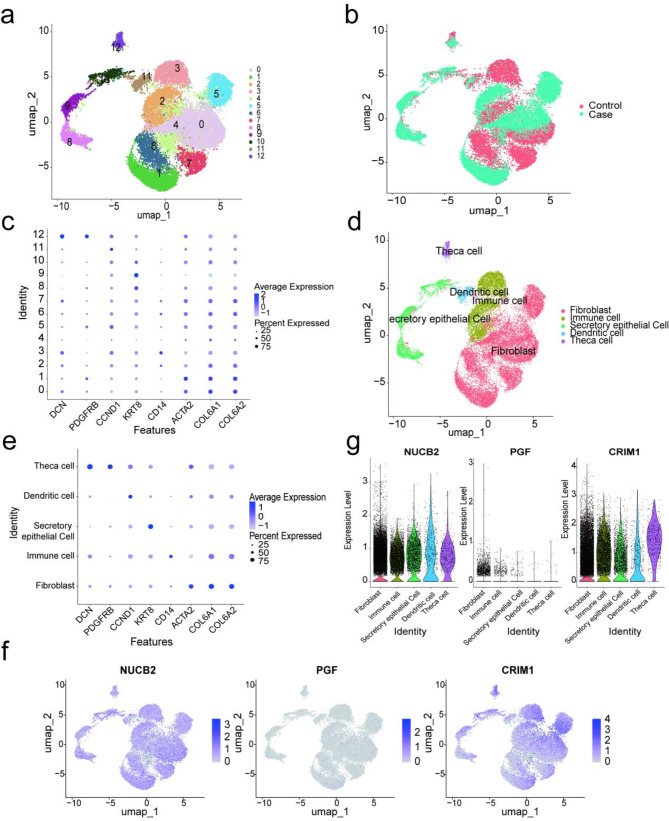
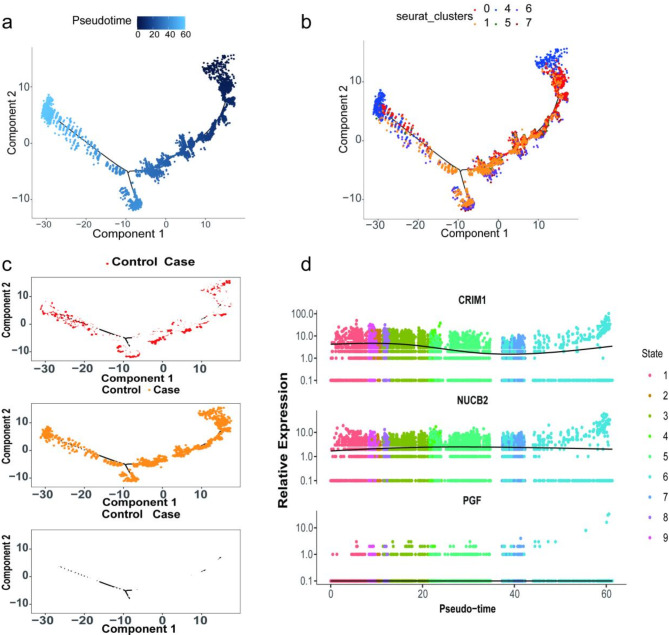
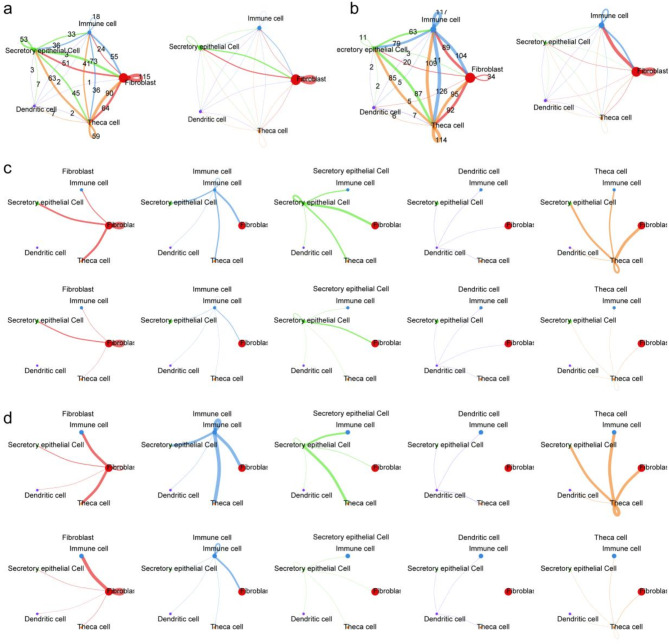
Results: Three key genes, NUCB2 [odds ratio (OR) = 0.8634, 95% confidence interval (CI): 0.8145-0.9152, P < 0.0001], PGF (OR = 0.8393, 95% CI: 0.7185-0.9805, P < 0.05), and CRIM1 (OR = 0.7539, 95% CI: 0.6556-0.670, P < 0.0001), were identified as having a unidirectional causal association with PCOS and were associated with a reduced risk of PCOS. In public datasets, NUCB2 exhibited significantly increased expression in PCOS samples, while PGF and CRIM1 showed the opposite trends. These three genes were enriched in pathways related to cellular functions, metabolic processes, and the operation of the nervous system, and they were co-expressed in smooth muscle. Additionally, five cell clusters were annotated, among which fibroblasts were identified as key cells due to their highest expression of all three key genes. Further analysis revealed a bifurcation event occurring during the mid-development stage of fibroblasts, with PCOS samples displaying a higher abundance of fibroblasts. In PCOS samples, fibroblasts exhibited more extensive communication with secretory epithelial cells, indicating a more complex intercellular interaction within this condition.
Conclusion: This study identified three EMT-RGs: NUCB2, PGF, and CRIM1, which were associated with a reduced risk of PCOS, with fibroblast identified as a key cell group in the disease's pathology. This provides new insights for PCOS research.
Keywords: Epithelial-mesenchymal transition; Mendelian randomization; Polycystic ovary syndrome; Single-cell RNA sequencing.
© 2025. The Author(s).
Conflict of interest statement
Declarations. Ethics approval and consent to participate: Not applicable. Consent for publication: Not applicable. Competing interests: The authors declare no competing interests.
Figures


Similar articles
-
From proteome to pathogenesis: investigating polycystic ovary syndrome with Mendelian randomization analysis.Front Endocrinol (Lausanne). 2024 Sep 9;15:1442483. doi: 10.3389/fendo.2024.1442483. eCollection 2024. Front Endocrinol (Lausanne). 2024. PMID: 39314522 Free PMC article.
-
Mendelian randomization and multi-omics approach analyses reveal impaired glucose metabolism and oxidative phosphorylation in visceral adipose tissue of women with polycystic ovary syndrome.Hum Reprod. 2024 Dec 1;39(12):2785-2797. doi: 10.1093/humrep/deae244. Hum Reprod. 2024. PMID: 39448886
-
Unveiling the molecular landscape of PCOS: identifying hub genes and causal relationships through bioinformatics and Mendelian randomization.Front Endocrinol (Lausanne). 2024 Dec 13;15:1431200. doi: 10.3389/fendo.2024.1431200. eCollection 2024. Front Endocrinol (Lausanne). 2024. PMID: 39735641 Free PMC article.
-
Causes and Consequences of Polycystic Ovary Syndrome: Insights From Mendelian Randomization.J Clin Endocrinol Metab. 2022 Feb 17;107(3):e899-e911. doi: 10.1210/clinem/dgab757. J Clin Endocrinol Metab. 2022. PMID: 34669940 Free PMC article. Review.
-
Causal relationship between gut microbiota and polycystic ovary syndrome: a literature review and Mendelian randomization study.Front Endocrinol (Lausanne). 2024 Feb 1;15:1280983. doi: 10.3389/fendo.2024.1280983. eCollection 2024. Front Endocrinol (Lausanne). 2024. PMID: 38362275 Free PMC article. Review.
References
-
- Escobar-Morreale HF. Polycystic ovary syndrome: definition, aetiology, diagnosis and treatment. Nat Rev Endocrinol. 2018;14 5:270–84. 10.1038/nrendo.2018.24. - PubMed
-
- Balen AH, Morley LC, Misso M, Franks S, Legro RS, Wijeyaratne CN, et al. The management of anovulatory infertility in women with polycystic ovary syndrome: an analysis of the evidence to support the development of global WHO guidance. Hum Reprod Update. 2016;22 6:687–708. 10.1093/humupd/dmw025. - PubMed
-
- Al Wattar BH, Fisher M, Bevington L, Talaulikar V, Davies M, Conway G, et al. Clinical practice guidelines on the diagnosis and management of polycystic ovary syndrome: a systematic review and Quality Assessment Study. J Clin Endocrinol Metab. 2021;106 8:2436–46. 10.1210/clinem/dgab232. - PMC - PubMed
MeSH terms
LinkOut - more resources
Full Text Sources
Medical
