. 2025 Feb 19;13(1):35.
doi: 10.1186/s40478-025-01952-x.

Spatial analysis of a complete DIPG-infiltrated brainstem reveals novel ligand-receptor mediators of tumour-to-TME crosstalk

Affiliations

Spatial analysis of a complete DIPG-infiltrated brainstem reveals novel ligand-receptor mediators of tumour-to-TME crosstalk

Anja Kordowski et al. Acta Neuropathol Commun. .

Abstract

Previous studies have highlighted the capacity of brain cancer cells to functionally interact with the tumour microenvironment (TME). This TME-cancer crosstalk crucially contributes to tumour cell invasion and disease progression. In this study, we performed spatial transcriptomic sequencing analysis of a complete annotated tumour-infiltrated brainstem from a single diffuse intrinsic pontine glioma (DIPG) patient. Gene signatures from ten sequential tumour regions were analysed to assess mechanisms of disease progression and oncogenic interactions with the TME. We identified four distinct tumour subpopulations and assessed respective ligand-receptor pairs that actively promote DIPG tumour progression via crosstalk with endothelial, neuronal and immune cell communities. Our analysis found potential targetable mediators of tumour-to-TME communication, including members of the complement component system and the neuropeptide/GPCR ligand-receptor pair ADCYAP1-ADCYAP1R1. These interactions could influence DIPG tumour progression and represent novel therapeutic targets.

Keywords: ADCYAP1-ADCYAP1R1; DIPG; Ligand-receptor pairs; Spatial transcriptomic sequencing; Tumour-CNS crosstalk.


Conflict of interest statement

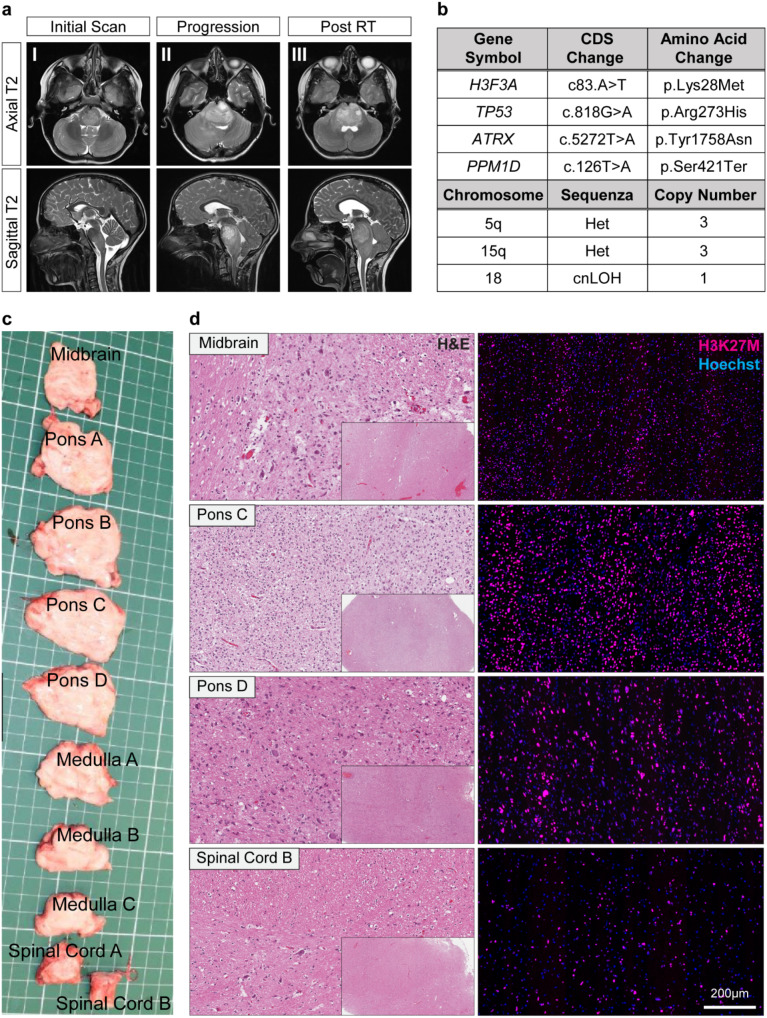
Declarations. Ethical approval: This study was performed in line with ethical approval from the QIMR human research ethics (HREC) committee under project P3420. Consent to publish: Written informed consent was obtained from the patient’s legal representative. The authors affirm that human research participants provided informed consent for publication of the images in Figure(s) 1a and 1c. Competing interests: The authors declare no competing interests.

Figures

Fig. 1
Fig. 1
Patient imaging and tumour characteristics. a MR images showing DIPG tumour progression over the course of disease. b Table summarising point mutations and chromosomal aberrations identified through tumour biopsy sampling and sequencing as part of the MNP2.0 (Germany) and PRISM (Sydney) trial. c Ten patient brainstem regions were collected at autopsy. d Different degrees of tumour burden were confirmed by H&E and H3K27M staining. Pontine regions showing areas of high cellularity, whereas the midbrain area shows clear patterns of tumour infiltration into normal brain tissue
Fig. 2
Fig. 2
Identification of DIPG cell communities. a UMAP plotting demonstrating unsupervised clustering and identification of ten distinct cell communities. b Quantification of all ten cell communities in all ten DIPG brainstem regions highlighting community C0 and C1 as the dominating populations. c Spatial visualisation of the ten cell communities in the brainstem regions showing heterogeneous distribution of the respective populations, including patterns of immune cell infiltration and highly compartmentalised OPC or stem-like populations. All major brain cell types are represented in the dataset. d InferCNV analysis was performed to identify chromosomal aberrations in the ten DIPG-infiltrated brainstem regions. 3 normal brain samples from SpatialLIBD were used as a control reference. Results demonstrated gain of chromosome 1, as well as losses of the chromosomes 5, 15 and 18 present in the spatial DIPG object. Loss of the chromosomes 5, 15, and 18 were previously identified via tumour biopsy sequencing (Fig. 1b). e Expression analysis of gain chr 1 and losses of chr 5, 15, 18 identified four communities with high levels of the chromosomal aberrations, including C0, C1, C6 and C8
Fig. 3
Fig. 3
Characterisation of DIPG tumour cell communities. a DIPG cellular states and tumour-associated cell types according to Liu et al. were assessed across the patient tissue at the spot-wise level. Reference-based deconvolution demonstrated a high degree of the AC-like phenotype in almost all communities. b The levels of selected marker genes associated with different DIPG cellular states were quantitated in the four tumour cell communities, demonstrating that C0 expresses known DIPG markers like NTRK2 or OLIG2, whilst genes expressed in C1 are correlated with more immature populations such as JUNB. C8 appears to be a mix of C0 and C1, with additional DNA damage markers including DDIT4. Community C6 represents a rather unique population, expressing proliferation and cell cycle markers like MKI67 and CDC20. c Signatures of DIPG cellular states were profiled more specifically across the four tumour cell communities, supporting the notion that these populations reflect different states of DIPG lineage differentiation. Community C1 shows characteristics of a more immature and MES-like state. C8 is associated with OPC-like 2 signatures whereas community C0 harbours characteristics of the more committed OPC-like 1 and AC-like cell state. d Spatial trajectory analysis was performed additionally to predict the trajectory path of the four tumour cell communities. Community C6, which is characterised by cell cycle markers such as MKI67 was determined as the initiating cell population. Analysis confirmed previous results revealing that community C1 instigates the development of community C8 and C0
Fig. 4
Fig. 4
Identification of CCIs and LR pairs. a Cell-cell interaction (CCI) scores were evaluated for each of the ten brainstem regions and between all ten cell communities. Sankey plotting highlighting the endothelial population as the top sender (ligand-expressing) community, followed by the two non-tumour populations of C3 (neuronal) and C5 (myeloid). The two most interacting receiver populations (receptor-expressing) identified by CCI profiling were the tumour communities C1 and C0. b The most significant ligand-receptor (LR) pairs involved in the crosstalk between the TME interaction partners identified in 5a (endothelial, neuronal and myeloid) and the four tumour communities combined were determined. c All four tumour populations were profiled to determine tumour subpopulation-specific LR pairs. Collagen and integrin pairs were identified as predominant endothelial-to-tumour interactions. Assessment of CCIs for each tumour population respectively revealed distinct results. C6 interacts mostly with myeloid cells, C1 with glial cells, C8 with the two tumour communities C0 and C1 and the more mature tumour sub-population of C0 interacts most strongly with neurons. d Assessment of ADCYAP1 and ADCYAP1R1 in the ten DIPG cell communities confirmed that expression of the ligand ADCYAP1 is exclusive to the neuronal population, whereas ADCYAP1R1 expression is most highly associated with the tumour cell communities of C0 and C8. e Immunohistochemistry staining of the corresponding proteins, PACAP38 and PAC1, on the same FFPE tissue blocks (Midbrain) confirmed this observation, showing co-expression of PACAP38 together with the neuronal marker NeuN and PAC1 expression predominantly on H3K27M positive DIPG cells
Fig. 5
Fig. 5
ADCYAP1-ADCYAP1R1 expression profiling. a Prediction analysis of interactions between the LR pair ADCYAP1-ADCYAP1R1 demonstrating crosstalk between the pair more strongly correlated to the midbrain and distal pons/medulla regions. Spatial transcriptomic profiling showed that interactions between this LR pair are fairly restricted. b Dual IHC staining for the corresponding proteins, PACAP38 together with PAC1, further highlighted that PACAP38 expressing cells surround PAC1 positive cells. c These were predominantly found in areas that appear to show patterns of tumour cell infiltration

References

    1. Bernstock JD et al (2024) Next-generation CAR T cell therapies for glioblastoma. Sci Transl Med 16(762):eadp2660 - PubMed
    1. Venkataramani V et al (2022) Disconnecting multicellular networks in brain tumours. Nat Rev Cancer 22(8):481–491 - PubMed
    1. Johung TB, Monje M (2017) Diffuse intrinsic pontine glioma: New Pathophysiological insights and emerging therapeutic targets. Curr Neuropharmacol 15(1):88–97 - PMC - PubMed
    1. Warren KE et al (2012) Genomic aberrations in pediatric diffuse intrinsic pontine gliomas. Neuro Oncol 14(3):326–332 - PMC - PubMed
    1. Monje M et al (2011) Hedgehog-responsive candidate cell of origin for diffuse intrinsic pontine glioma. Proc Natl Acad Sci 108(11):4453–4458 - PMC - PubMed

Publication types

MeSH terms

LinkOut - more resources