

Phenotype-based clusters, inflammation and cardiometabolic complications in older people before the diagnosis of type 2 diabetes: KORA F4/FF4 cohort study
- PMID: 39972466
- PMCID: PMC11841139
- DOI: 10.1186/s12933-025-02617-8
Phenotype-based clusters, inflammation and cardiometabolic complications in older people before the diagnosis of type 2 diabetes: KORA F4/FF4 cohort study
Abstract
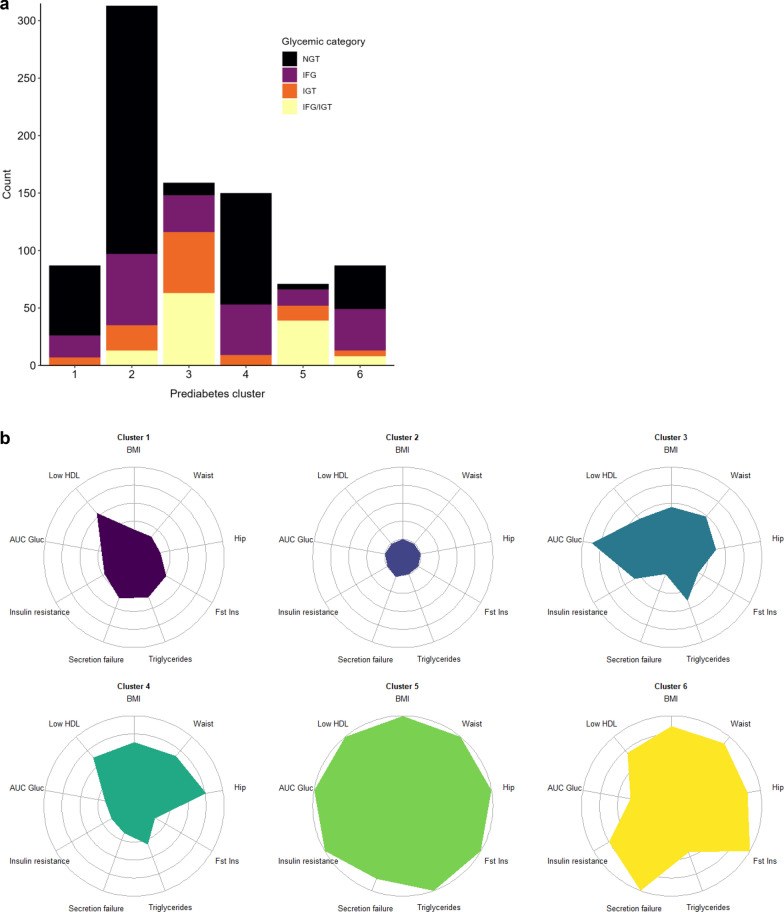
Background: Using a data-driven approach, six clusters with different risk profiles and burden of complications were recently identified in middle-aged people before the diagnosis of type 2 diabetes (T2D). We aimed to investigate whether these clusters could be generalised to older people and if subclinical inflammation was related to their cardiometabolic risk profiles.
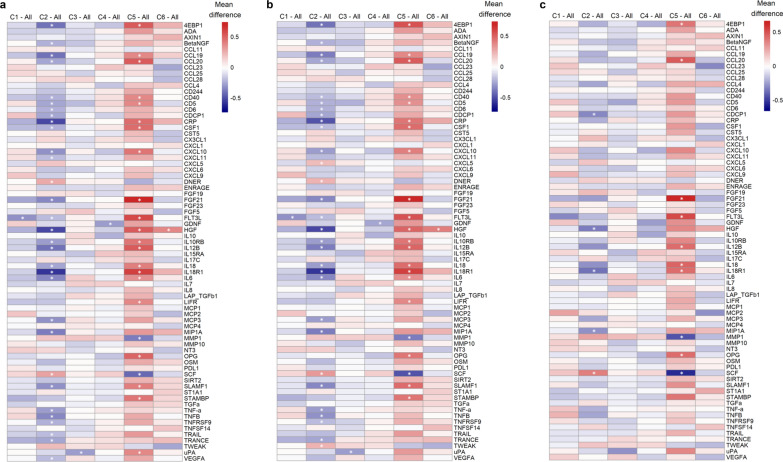
Methods: We assigned 843 participants of the KORA F4 study aged 61-82 years without T2D to the six previously defined phenotype-based clusters. Based on 73 biomarkers of subclinical inflammation, we derived an inflammation-related score ("inflammatory load") using principal component analysis to assess subclinical inflammation. Risk factors, inflammatory load as well as prevalence and incidence of (pre)diabetes-related complications were compared between the clusters using pairwise comparisons and regression analyses.
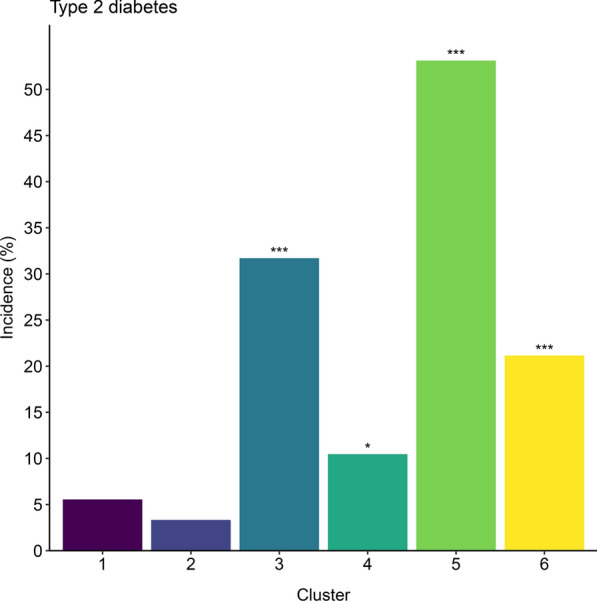
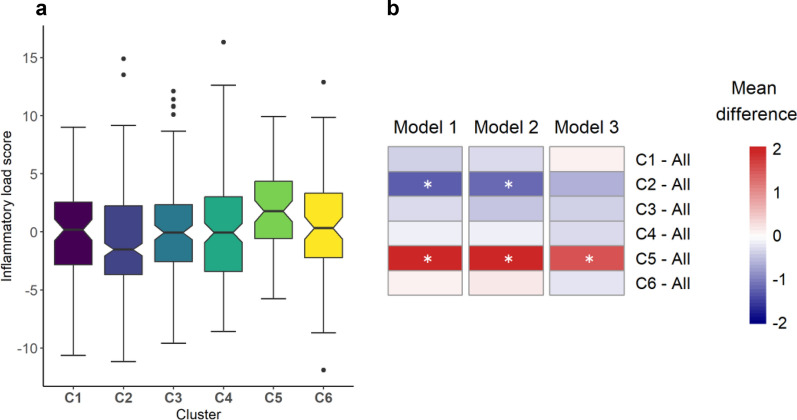
Results: Clusters 1 and 2 had the lowest cardiometabolic risk, whereas clusters 5 and 6 the highest. T2D risk was highest in clusters 3, 4, 5, and 6 compared with the low-risk cluster 2 (age- and sex-adjusted ORs between 3.6 and 34.0). In cross-sectional analyses, there were significant between-cluster differences in chronic kidney disease (CKD), distal sensorimotor polyneuropathy (DSPN) and cardiovascular disease (all p < 0.045). In prospective analyses (mean follow-up time 6.5-8.3 years), clusters differed significantly in CKD and DSPN incidence, but not in incident CVD or all-cause mortality. The inflammatory load was highest in the high-risk cluster 5 and lowest in cluster 2. Adjustment for the inflammatory load had only a minor impact on the aforementioned differences in outcomes between clusters.
Conclusions: Our findings extend the knowledge about the previously identified six phenotype-based clusters in older people without T2D. Differences between clusters were more pronounced for T2D risk than for prevalent or incident (pre)diabetes-related complications and absent for mortality. The high cardiometabolic risk corresponded to the high inflammatory load in cluster 5 but not to the lower inflammatory load of high-risk clusters 3 and 6.
Keywords: Cardiovascular disease; Chronic kidney disease; Cohort; Diabetes; Heterogeneity; Inflammation; Mortality; Polyneuropathy; Prediabetes; Subtypes.
© 2025. The Author(s).
Conflict of interest statement
Declarations. Ethics approval and consent to participate: The KORA study was carried out in accordance with the Declaration of Helsinki. All study participants gave written informed consent. The Ethics Committee of the Bavarian Medical Association approved the studies (S4 Study: EC No. 99186, F4 study and FF4 study: EC No. 06068). Consent for publication: Not applicable. Competing interests: MR received lecture fees or served on advisory boards for AstraZeneca, Echosens, Eli Lilly, Madrigal, Merck-MSD, Novo Nordisk and Target RWE and performed investigator-initiated research with support from Boehringer Ingelheim, Novo Nordisk and Nutricia/Danone to the German Diabetes Center (DDZ). All other authors declare that they have no competing interests.
Figures

References
-
- Ahlqvist E, Storm P, Käräjämäki A, Martinell M, Dorkhan M, Carlsson A, Vikman P, Prasad RB, Aly DM, Almgren P, Wessman Y, Shaat N, Spégel P, Mulder H, Lindholm E, Melander O, Hansson O, Malmqvist U, Lernmark Å, Lahti K, Forsén T, Tuomi T, Rosengren AH, Groop L. Novel subgroups of adult-onset diabetes and their association with outcomes: a data-driven cluster analysis of six variables. Lancet Diabetes Endocrinol. 2018;6(5):361–9. 10.1016/S2213-8587(18)30051-2. - PubMed
-
- Zaharia OP, Strassburger K, Strom A, Bönhof GJ, Karusheva Y, Antoniou S, Bódis K, Markgraf DF, Burkart V, Müssig K, Hwang JH, Asplund O, Groop L, Ahlqvist E, Seissler J, Nawroth P, Kopf S, Schmid SM, Stumvoll M, Pfeiffer AFH, Kabisch S, Tselmin S, Häring HU, Ziegler D, Kuss O, Szendroedi J, Roden M. Risk of diabetes-associated diseases in subgroups of patients with recent-onset diabetes: a 5-year follow-up study. Lancet Diabetes Endocrinol. 2019;7(9):684–94. 10.1016/S2213-8587(19)30187-1. - PubMed
-
- Herder C, Maalmi H, Strassburger K, Zaharia OP, Ratter JM, Karusheva Y, Elhadad MA, Bódis K, Bongaerts BWC, Rathmann W, Trenkamp S, Waldenberger M, Burkart V, Szendroedi J, Roden M. Differences in biomarkers of inflammation between novel subgroups of recent-onset diabetes. Diabetes. 2021;70(5):1198–208. 10.2337/db20-1054. - PubMed
MeSH terms
Substances
LinkOut - more resources
Full Text Sources
Medical
