Review
. 2025 Feb 15;228(Suppl_1):JEB248125.
doi: 10.1242/jeb.248125. Epub 2025 Feb 20.

Behavioural energetics in human locomotion: how energy use influences how we move

Affiliations
Review

Behavioural energetics in human locomotion: how energy use influences how we move

Megan J McAllister et al. J Exp Biol. .

Abstract

Nearly a century of research has shown that humans, and other animals, tend to move in ways that minimize energy use. A growing body of evidence suggests that energetic cost is not only an outcome of our movement, but also plays a central role in continuously shaping it. This has led to an emerging research area, at the nexus between biomechanics and neuroscience, termed behavioural energetics, which is focused on understanding the mechanisms of energy optimization and how this shapes our coordination and behaviour. In this Review, we first summarize the existing evidence for and against our preferred locomotor behaviours coinciding with energy optima. Although evidence of our preference for energetically optimal gaits has existed for decades, new research is revealing its relevance across a surprising array of dynamic locomotor tasks and complex environments. We next discuss evidence that we adapt our gait toward energy optima over short timescales and in novel environments, which we view as a more stringent test that energy expenditure is optimized in real-time. This necessitates that we sense energy use, or proxies for it, on similar timescales. We therefore next provide an overview of candidate sensory mechanisms of energy expenditure. Finally, we discuss how behavioural energetics can be applied to novel wearable assistive technologies and rehabilitation paradigms, and conclude the Review by outlining what we see as the most important future challenges and opportunities in behavioural energetics.

Keywords: Biomechanics; Energy minimization; Gait; Locomotion; Metabolic cost; Optimization.


Conflict of interest statement

Competing interests The authors declare no competing or financial interests.

Figures

Fig. 1.
Fig. 1.
Preferred gait characteristics and energy optima often coincide in steady-state locomotion. Cost landscapes for locomotor speed (A), step/pedal rate (B) and step width (C) for walking (red), running (blue), walk–run transition (purple) and cycling (yellow). Triangles illustrate preferred values and circles illustrate energy optimal values (minima). Horizontal lines represent ±1 s.d. and are presented when available. See Supplementary Materials and Methods for additional figure generation details.
Fig. 2.
Fig. 2.
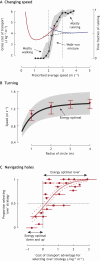
Humans exhibit energy optimal behaviours in non-steady-state locomotion. (A) A mixture of walking and running gaits are energy optimal near the intersection of the walk (red) and run (blue) cost landscapes, given the non-convexity of the effective cost curve (dashed curve). Participants self-select these walk–run mixtures (black line, grey shading is 25th to 75th percentile) when in the transition region between 2 and 3 m s−1 (vertical dashed lines), while selecting mostly walking and mostly running at lower and higher speeds, respectively. Data from Long and Srinivasan (2013). (B) When navigating turns of various radii, people select speeds that are predicted by energy optimality (black line, grey shading is ±2% of optimal energy cost). Red circles are across participant median speeds and error bars indicate the 25th to 75th percentile. Data from Brown et al. (2021). (C) When navigating cuboidal holes in the ground (of lengths 0.5–1.1 times leg length and depths of 0.1–0.5 times leg length), people select a strategy – stepping ‘over’ or ‘down and up’ – that is predicted by energy optimality. Red circles are across participant mean proportion for each length-depth combination (±1 s.d. as horizontal lines). Solid shaded red line represents the fitted logistic curve and dashed lines represent 95% confidence interval. Data from Daniels and Burn (2023). See Supplementary Materials and Methods for additional figure generation details.
Fig. 3.
Fig. 3.
Altering energetic consequences can drive gait adaptation. (A) Experimental paradigm in which exoskeletons are used to apply a resistance to the limb that is proportional to the participants' step frequency, altering the energy optimal step frequency. (B) Resulting cost landscapes with optima shifted to a higher (red, penalize-low controller) or lower (blue, penalize-high controller) step frequency, compared to natural walking (grey, controller off). Circles indicate across participant averages. The lines are fourth-order polynomial fits for illustrative purposes, and the shading shows their 95% confidence intervals. (C) Experimental paradigm where step length asymmetry was coupled to treadmill speed, altering the energy optimal step symmetry/speed combination. (D) Resulting cost landscape with optimum shifted to an asymmetric gait. The blue circles indicate across participant average, error bars are 1 s.e.m. The blue line is a second-order polynomial fit for illustrative purposes. Grey vertical bars represent the proportion of participants choosing each asymmetry/speed combination. Adapted, with permission, from Selinger et al., 2015 (A,B) and based on Roemmich et al., 2019 (C,D). See Supplementary Materials and Methods for additional figure generation details.
Fig. 4.
Fig. 4.
Candidate sensory mechanisms of energy use. (A) Possible local (red) and global (blue) sensors that indirectly or directly estimate energy use. Note that an efference copy (dashed line), derived from a motor command, is not a feedback sensory mechanism, but could be used to generate a feed-forward prediction about the energetic consequences of movement. (B) Theoretical plot of each sensor's response latency versus directness. (C) Conceptual diagram illustrating how behavioural energetics may involve indirect sensors that inform fast prediction and direct sensors that inform a slower optimization process to alter preferred gait mechanics. Adapted, with permission, from O'Connor and Donelan (2012). See Supplementary Materials and Methods for additional figure generation details.
Fig. 5.
Fig. 5.
Relevance of behavioural energetics in assistive device design. (A) Compared with natural running (red), running with the exotendon (blue) increased the energy optimal step frequency and decreased metabolic energy expenditure. Red squares and blue circles represent individual participant data points; lines are quadratic fits for illustrative purposes. Shading shows the 95% confidence intervals of the fits. (B) Theoretical diagram outlining the hypothesized mechanism of energy savings when running with an exotendon, where both swing and stance costs (COM work) are decreased. Reprinted from Simpson et al. (2019). See Supplementary Materials and Methods for additional figure generation details.
Fig. 6.
Fig. 6.
Relevance of behavioural energetics in rehabilitation and training. (A) Conceptual diagram illustrating the difference between traditional and energy incentivized rehabilitation approaches. (B) Theoretical outcome of an energy incentivized rehabilitation approach, where the cost landscape is intentionally altered to realign the energy optima with the desired gait characteristic.

References

    1. Abe, D., Fukuoka, Y. and Horiuchi, M. (2019). Why do we transition from walking to running? Energy cost and lower leg muscle activity before and after gait transition under body weight support. PeerJ 7, e8290. 10.7717/peerj.8290 - DOI - PMC - PubMed
    1. Abram, S. J., Poggensee, K. L., Sanchez, N., Simha, S. N., Finley, J. M., Collins, S. H. and Donelan, J. M. (2022). General variability leads to specific adaptation toward optimal movement policies. Curr. Biol. 32, 2222-2232.e5. 10.1016/j.cub.2022.04.015 - DOI - PMC - PubMed
    1. Abram, S. J., Selinger, J. C. and Donelan, J. M. (2019). Energy optimization is a major objective in the real-time control of step width in human walking. J. Biomech. 91, 85-91. 10.1016/j.jbiomech.2019.05.010 - DOI - PubMed
    1. Ackermann, M. and van den Bogert, A. J. (2010). Optimality principles for model-based prediction of human gait. J. Biomech. 43, 1055-1060. 10.1016/j.jbiomech.2009.12.012 - DOI - PMC - PubMed
    1. Adreani, C. M. and Kaufman, M. P. (1998). Effect of arterial occlusion on responses of group III and IV afferents to dynamic exercise. J. Appl. Physiol. (1985) 84, 1827-1833. 10.1152/jappl.1998.84.6.1827 - DOI - PubMed

Publication types

LinkOut - more resources