. 2025 Mar 1;5(3):527-548.
doi: 10.1158/2767-9764.CRC-24-0125.

A Checkpoint Reversal Receptor Mediates Bipartite Activation and Enhances CAR T-cell Function

Affiliations

A Checkpoint Reversal Receptor Mediates Bipartite Activation and Enhances CAR T-cell Function

Daniel Landi et al. Cancer Res Commun. .

Abstract

Abstract: The efficacy of chimeric antigen receptor T cells (CART) in solid tumors is limited by immune inhibition. In our study, we observed that effector cytokines mediated the upregulation of the PD-L1 immune checkpoint in primary glioblastoma. To offset the PD-L1 inhibitory signal, we engineered PD-1 checkpoint reversal receptors (CPR) with a CD28 or 41BB costimulatory endodomain and coexpressed them with a first-generation or a CD28-containing second-generation HER2-specific CAR (CPR/CART) using bicistronic vectors. We found that bipartite T-cell activation, by CAR-generated signal 1 and CPR costimulation (signal 2), fine-tuned proinflammatory cytokine release and sustained antitumor activity. Whereas both CPR28 and CPR41BB effectively counteracted the PD-1 signal in vitro, CPR41BB, when coexpressed with a first-generation CAR (CARζ/CPR41BB), promoted central memory differentiation following repeat antigenic stimulation. CARζ/CPR41BB T cells formed a robust immune synapse with tumor targets, similar to a 41BB-containing second-generation CART, maintained the favorable metabolic parameters associated with 41BB costimulation, and demonstrated superior antitumor function after adoptive transfer in xenograft models of gioblastoma and metastatic osteosarcoma. Thus, a CPR molecule with 41BB costimulation that curtails PD-1 inhibition and complements CAR signaling to optimize T-cell activation could enhance CART efficacy against solid tumors.

Significance: Enhancing CART function and persistence while balancing immune effector-mediated inflammation is crucial. Using our clinically relevant HER2-CAR platform, we demonstrate that tumor-intrinsic signals like the PD-1/PD-L1 immune checkpoint can be leveraged in CART design to modulate immune synapse and metabolic parameters, improving antitumor function without increasing cytokine production.


Conflict of interest statement

S.A. Navai reports grants from the NIH and Curing Kids Cancer during the conduct of the study. K. Sanber reports grants from Conquer Cancer, the ASCO Foundation outside the submitted work. A.Z. Gad reports grants from the Cancer Prevention and Research Institute of Texas during the conduct of the study. N. Ahmed is a paid consultant for The Children’s Cancer Hospital of Egypt 57357 in the matters of development, received one-time royalties from Celgene and Cell Medica, consulted in the past for Adaptimmune, and continues to consult for Equillium (pro bono). M. Hegde reports grants from Alex’s Lemonade Stand Foundation, the Stand Up To Cancer/American Association for Cancer Research, Curing Kids Cancer, the V Foundation for Cancer Research, the NIH, the Cancer Prevention and Research Institute of Texas, The Faris Foundation, and Cookies for Kids’ Cancer outside the submitted work; in addition, M. Hegde has a patent to “Method for producing cytotoxic effector memory T cells for CAR T-cell treatment of cancer” pending. K. Sanber, V.S. Salsman, T.T. Byrd, S.K. Joseph, N.Ahmed, and M. Hegde are named inventors on patent applications in the field of CART therapy owned by Baylor College of Medicine. No disclosures were reported by the other authors.

Figures

Figure 1
Figure 1
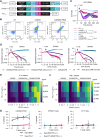
PD-L1 expression in GBM and PD-1 recruitment to the CARIS with GBM. A, Constitutive (UPN01) and inducible (UPN06) surface expression of PD-L1 in primary GBM cells after 24–48 hours of IFN-γ exposure. Representative results from two samples shown. UPN, unique patient number. B, PD-L1 median fluorescent intensity (MFI) on primary GBM (n = 14) before and at 48 hours of IFN-γ (10 ng/mL) exposure; ***, P < 0.001, Wilcoxon signed-rank test. C, Fold-change in PD-L1 MFI in GBM cells from baseline, at 24, 48, and 72 hours. Each color represents a single patient donor, with some measured at multiple time points. Data are shown as individual values with the mean ± SD. D, PD-L1 expression in WT LN229-GBM cells and LN229 with PD-L1 deletion (LN229-PD-L1 KO) at baseline and at 24 hours of exposure to IFN-γ (10 ng/mL) or CAR28ζ T cells. E, MFI of PD-1 in the immune synapse between CARζ cells and WT LN229-GBM cells at 15, 30, and 60 minutes (****, P < 0.0001; ns, P > 0.5, Kruskal–Wallis and Wilcox pairwise); ≥20,000 events were captured, and 300–1,000 CAR+ conjugates were examined for PD-1 recruitment to CARIS. The white box represents the IQR with horizontal lines at 25%, 50%, and 75%. F, Representative image capture showing the CARIS with tumor cell (WT LN229-GBM) and other parameters evaluated. Gating strategy is shown in the Supplementary material. G, Spearman correlation between PD-1 intensity and CAR intensity in the immune synapse at 15, 30, and 60 minutes. H, Spearman correlation between PD-1 intensity and actin intensity in the CARIS at 15, 30, and 60 minutes. ns, not significant.
Figure 2
Figure 2
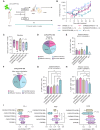
Design and functional screening of PD-1TR and CPR28 molecules. A, Schematic representation of the bicistronic vectors encoding for the HER2-CAR with truncated PD-1 (PD-1TR) or CPR28. The CPR28dimer included a membrane proximal extracellular cysteine residue (C141) required for CD28 homodimerization, as indicated. B, Flow cytometry analysis showing coexpression of HER2-CAR and PD-1 CPR on T cells. CAR28ζ and NT T cells from the same donor were used as controls for assessment of CPR expression determined by surface PD-1 detection. C, Long-term cytolytic function of CAR28ζ/PD-1TR, compared with CAR28ζ cells, against U373-GBM cells at effector to target ratios of 1:5 and 1:10 assessed using a cell-impedance based assay (xCELLigence). D, Comparison of the cytolytic ability of patient-derived CAR28ζ cells (n = 3) coexpressing CPR28dimer or CPR28monomer against autologous HER2+ GBM cells at an effector to target ratio of 1:10 by assessment of tumor cell viability in an xCELLigence assay. In C and D, error bars represent the mean ± SD at each time point. ****, P < 0.0001, two-way ANOVA with the Tukey multiple comparisons test. E, IL-2 and (F) IFN-γ release by CAR28ζ, CAR28ζ/PD-1TR, and CAR28ζ/CPR28 cells (100,000 T cells/well) upon stimulation with Fc-conjugated HER2 (0–2 μg/mL) and PD-L1 (0–5 μg/mL) proteins. Median values from a representative donor shown. G, CAR28ζ/CPR28 cell–induced lysis of Raji cells modified to express HER2 or HER2 and PD-L1 across different T-cell to tumor cell ratios but not the WT Raji cells (HER2/PD-L1) or those expressing PD-L1 alone in a 51Cr-release assay. T cells with CPR28 alone had no cytotoxic effect against HER2+ or PD-L1+ Raji cells, like NT T cells from the same donor. A, Created in BioRender. Navai, S. (2024) BioRender.com/l86h941.
Figure 3
Figure 3
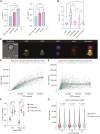
Effect of decoupling signal 2 from the CAR on T-cell function. A, Illustration depicting the bipartite T-cell activation through signal 1 delivery from CAR engaging the HER2 antigen and signal 2 from binding of CPR with PD-L1 (or PD-L2). B, Percent increase in IFN-γ production by CAR28ζ/CPR28 and CARζ/CPR28 compared with CAR28ζ cells (50,000 T cells/well) at 24 hours of coculture with autologous GBM cells (n = 5 patients). Effector (100,000 T cells) to target ratio of 1:1. **, P < 0.01; ****, P < 0.0001, one-way ANOVA with the Tukey multiple comparisons test. C, Cytolytic function of CAR28ζ/CPR28 and CARζ/CPR28 cells assessed using 4-hour 51Cr-release assay at baseline and at 7 days of persistent T-cell stimulation through the CAR. NT T cells had poor viability after prolonged stimulation without added homeostatic cytokines and were not evaluable. ****, P < 0.0001, two-way ANOVA with the Tukey multiple comparisons test. D, Percent of total T cells expressing HER2-CAR on cell surface, and percent of CAR+ T cells detected with PD-1 (surrogate marker for CPR), respectively, amongst different CPR/CART groups (n = 4 patients) using flow cytometry. E, Median fluorescent intensity (MFI) of HER2-CAR detected in transduced T cells shown in D. In D and E, only statistically significant differences are shown, *, P < 0.05; **, P < 0.01; ****, P < 0.0001, one-way ANOVA with the Tukey multiple comparisons test. F, Multiplex analysis for proinflammatory cytokines (IL-2, MIP-1α, TNF-α, and GM-CSF) in autologous T-cell and GBM coculture (n = 4 patients) supernatants at 24 hours. UPN, unique patient number. *, P < 0.05; **, P < 0.01; ****, P < 0.0001, two-way ANOVA with the Tukey multiple comparisons test. G, Assessment of long-term cytolytic function of CPR/CART against autologous GBM cells (n = 3 patients) using cell impedance–based xCELLigence assay. Statistical differences (denoted by the color key) shown are in comparison to control treatment CAR28ζ cells overtime. ****, P < 0.0001, two-way ANOVA with the Tukey multiple comparisons test. In G, black arrow indicates addition of T cells. A, Created in BioRender. Navai, S. (2019) BioRender.com/p40z816.
Figure 4
Figure 4
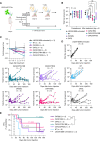
Phenotypic and functional profile of CART receiving bipartite activation signals through CPR41BB costimulation. A,In vivo functional screening of CARζ and CAR28ζ cells coexpressing CPR28 or CPR41BB against orthotopic xenografts of HER2+PD-L1+ U373-GBM in SCID mice (n = 5 per group). B, Fold change in tumor burden after treatment relative to the tumor volume before intratumoral injection of T cells (day 0), quantified by serial BLI. *, P < 0.05; **, P < 0.01, two-way ANOVA with the Tukey multiple comparisons test. Data are shown as the mean ± SD. C, CD8+: CD4+ ratio in CAR-expressing T cells among CPR/CART from patients with GBM (n = 4) as assessed by flow cytometry. Box plots show minimum to maximum with individual values. ns, P > 0.5, one-way ANOVA with the Tukey multiple comparisons test. D, Pie graph demonstrating immunophenotype distribution of CARζ/CPR41BB cells (n = 4 patients) at baseline. Percentages shown represent the mean value. Immunophenotype is defined as follows: naïve, CCR7+/CD45RA+; central memory, CCR7+/CD45RA; effector memory, CCR7/CD45RA; and terminal effector, CCR7/CD45RA+. E, The percentage CAR+CD8+ central memory (CCR7+/CD45RA) T cells did not significantly differ amongst different CPR/CART groups (n = 4 patients). The mean ± SEM is shown. ns, P > 0.5, one-way ANOVA with the Dunnett multiple comparisons test. F, Pie graph demonstrating immunophenotype distribution of CARζ/CPR41BB cells (n = 4 patients) after 7 days of continued stimulation by repeat cocultures with autologous GBM cells. Percentages shown represent the mean value. On day 7 of repeated stimulation, CARζ/CPR41BB cells (n = 4 patients) demonstrated (G) a significantly higher proportion of CAR+/CD8+ cells with the central memory phenotype compared with other CPR/CART groups and CAR28ζ, and (H) a significantly lower proportion of CAR+/CD8+ cells with the effector memory phenotype compared with CAR28ζ/CPR28 cells. The mean ± SEM is shown. *, P < 0.05; **, P < 0.01, one-way ANOVA with the Dunnett multiple comparisons test. I, Log-change in the median fluorescent intensity (MFI) of T-cell surface PD-1, LAG3, and TIM3 at 7 days of repeat coculture with autologous GBM cells (n = 4 patients) from baseline. Box plots show minimum to maximum with individual values. *, P < 0.05; **, P < 0.01, two-way ANOVA with the Tukey multiple comparisons test. ns, not significant.
Figure 5
Figure 5
Dynamics of CARζ/CPR41BB T-cell activation and CARIS formation in comparison with CAR41BBζ cells. A, CARζ/CPR41BB cells (n = 3 donors) demonstrated significantly lower IL-2 and IFN-γ release compared with CAR41BBζ cells at 24 hours of coculture with LN229-GBM cells, with CAR28ζ cells consistently showing the higher Th1 cytokine production. Data are shown as the mean ± SD. **, P < 0.000; ****, P < 0.0001; two-way ANOVA with the Tukey multiple comparisons test. B, Western blot analysis for CAR-phosphoCD3ζ (pCD3) in T cells in a resting state (maintained in culture with IL-7/IL-15). The pCD3 to CD3 ratio is normalized to CARζ in each donor. *, P < 0.05; one-way ANOVA with the Tukey multiple comparisons test. C, Representative image capture showing the CARIS with tumor cell (LN229-GBM) and different CARζ/CPR41BB immune synapse parameters evaluated. Gating strategy is shown in the Supplementary Material. Spearman correlation (D) between the intensity of CAR and CPR at the CARIS and (E) between the intensity of actin and CPR at the CARIS, both assessed by imaging flow cytometry at 15, 30, and 60 minutes. F, CARζ/CPR41BB and CAR41BBζ cells show significantly higher percent (%) of F-actin at the CARIS compared with CARζ cells. ns, P > 0.5; **, P < 0.01; ***, P < 0.0001, two-way ANOVA with the Tukey post hoc test. Data are shown as the mean with 95% confidence interval (CI). G, CARζ/CPR41BB cells show significantly higher CPR intensity in the CARIS with WT LN229 GBM cells at 15, 30, and 60 minutes compared with conjugates with LN229-PD-L1 KO (Kruskal–Wallis and Wilcox pairwise). CPR intensity increased over time in both conditions. ns, not significant.
Figure 6
Figure 6
Metabolomic parameters of CARζ/CPR41BB cells in comparison with CAR41BBζ cells. A, OCR measurements of resting (cultured in media containing in IL-7 and IL-15) CARζ/CPR41BB and CAR41BBζ cells (n = 3 donors; 200,000 T cells per well) under basal metabolic conditions and after the addition of mitochondrial inhibitors. B, Comparison of maximal respiration between CARζ/CPR41BB cells and CAR41BBζ cells at baseline (day 0). P = 0.059, Student two-tailed t test. C, Basal OCR, maximal respiration, and SRC between CAR41BBζ and CARζ/CPR41BB cells after 7 days of stimulation with Fc-conjugated HER2 and PD-L1 proteins. ns, P > 0.05, Student two-tailed t test. D, The ECAR in resting CARζ/CPR41BB and CAR41BBζ cells. E, The ECAR of CARζ/CPR41BB and CAR41BBζ at baseline and at 7 days of continued stimulation with plate-bound HER2 and PD-L1 proteins. ns, P > 0.05; **, P < 0.01, Student two-tailed t test. F, Basal OCR to ECAR ratio in CARζ/CPR41BB compared with CAR41BBζ cells at rest and at 7 days of continued stimulation with HER2 and PD-L1 proteins. ns, P > 0.05; *, P < 0.05, Student two-tailed t test. G, The OCR in CD8+ CARζ/CPR41BB and CAR41BBζ cells (n = 3 donors; 150,000 T cells per well) following 48-hour coculture with LN229-GBM cells (effector to tumor ratio 1:2). H, The SRC of CD8+ CARζ/CPR41BB and CAR41BBζ cells after 48 hours of coculture with LN229 GBM cells. ns, P > 0.05, Student two-tailed t test. The OCR and ECAR measurements are shown as the mean ± SEM. Data shown denote the IQR in the violin plot and the mean ± SEM in the bar graphs. ns, not significant.
Figure 7
Figure 7
In vivo antitumor activity of locoregionally delivered CARζ/CPR41BB cells in an orthotopic GBM model. A, Experimental schema for in vivo functional testing of CARζ/CPR41BB cells in a LN229-GBM orthotopic xenograft model. Mice were injected with eGFP.FFluc-expressing tumor cells on day 0 and randomized to treatment groups on day 11. Treatment consisted of two intracranial T-cell injections on days 13 and 21. Tumors were monitored by BLI. B, Comparison of tumor volumes between treatment and control groups after randomization but prior to treatment and 5 days after the first T-cell injection as measured by serial BLI. The statistical differences relative to control treatment CAR28ζ are shown. C, Quantification of treatment response by fold change in tumor burden after T-cell injection (day 0 for posttreatment assessment) within each treatment group, and (D) differences in tumor control over time as determined by BLI over 160 days after tumor inoculation (day 0). E, Kaplan–Meier analysis at 160 days after tumor injection showing probability of PFS in mice treated with HER2-targeted CART with or without CPR coexpression compared with untreated mice or those receiving NT T cells; all CART-improved PFS (P value color denotes significance over NT cells). Ticks represent censored subjects. *, P < 0.05; **, P < 0.01; ***, P < 0.001; Mann–Whitney test for comparison between two groups; two-way ANOVA with the Tukey post hoc test for multiple comparisons. Log-rank test (Holm–Sidak) for survival analysis.

References

    1. Srivastava S, Furlan SN, Jaeger-Ruckstuhl CA, Sarvothama M, Berger C, Smythe KS, et al. . Immunogenic chemotherapy enhances recruitment of CAR-T cells to lung tumors and improves antitumor efficacy when combined with checkpoint blockade. Cancer Cell 2021;39:193–208.e10. - PMC - PubMed
    1. Deng Q, Han G, Puebla-Osorio N, Ma MCJ, Strati P, Chasen B, et al. . Characteristics of anti-CD19 CAR T cell infusion products associated with efficacy and toxicity in patients with large B cell lymphomas. Nat Med 2020;26:1878–87. - PMC - PubMed
    1. Hegde M, Joseph SK, Pashankar F, DeRenzo C, Sanber K, Navai S, et al. . Tumor response and endogenous immune reactivity after administration of HER2 CAR T cells in a child with metastatic rhabdomyosarcoma. Nat Commun 2020;11:3549. - PMC - PubMed
    1. Cherkassky L, Morello A, Villena-Vargas J, Feng Y, Dimitrov DS, Jones DR, et al. . Human CAR T cells with cell-intrinsic PD-1 checkpoint blockade resist tumor-mediated inhibition. J Clin Invest 2016;126:3130–44. - PMC - PubMed
    1. Gargett T, Yu W, Dotti G, Yvon ES, Christo SN, Hayball JD, et al. . GD2-specific CAR T cells undergo potent activation and deletion following antigen encounter but can be protected from activation-induced cell death by PD-1 blockade. Mol Ther 2016;24:1135–49. - PMC - PubMed

MeSH terms