[Preprint]. 2025 Jan 21:2025.01.16.25320639.
doi: 10.1101/2025.01.16.25320639.

Spectral normative modeling of brain structure

Affiliations

Spectral normative modeling of brain structure

Sina Mansour L et al. medRxiv. .

Abstract

Normative modeling in neuroscience aims to characterize interindividual variation in brain phenotypes and thus establish reference ranges, or brain charts, against which individual brains can be compared. Normative models are typically limited to coarse spatial scales due to computational constraints, limiting their spatial specificity. They additionally depend on fixed regions from fixed parcellation atlases, restricting their adaptability to alternative parcellation schemes. To overcome these key limitations, we propose spectral normative modeling (SNM), which leverages brain eigenmodes for efficient spatial reconstruction to generate normative ranges for arbitrary new regions of interest. Benchmarking against conventional counterparts, SNM achieves a 98.3% speedup in computing accurate normative ranges across spatial scales, from millimeters to the whole brain. We demonstrate its utility by elucidating high-resolution individual cortical atrophy patterns and characterizing the heterogeneous nature of neurodegeneration in Alzheimer's disease. SNM lays the groundwork for a new generation of spatially precise brain charts, offering substantial potential to drive advances in individualized precision medicine.

Keywords: Brain Charts; Brain Eigenmodes; Graph Signal Processing; Normative Modeling.


Figures
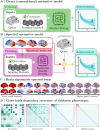
Figure. 1.
Figure. 1.. Schematic Comparison of Spectral Normative Modeling (SNM) with Conventional Normative Models.
(A) Design diagram for conventional (direct) normative models, which require a predetermined spatial query for model training. (B) Design diagram of SNM, which alleviates the need for predefined spatial queries. Instead, SNM enables assessments of multiple, arbitrary, a posteriori-defined spatial queries, allowing for greater flexibility. (C) Cortical projections of brain connectivity eigenmodes used in SNM. Eigenmodes across a range of graph frequencies are shown, illustrating how higher frequencies capture increasingly finer spatial details. (D) Cross-basis correlation magnitudes of cortical thickness phenotypes encoded onto the eigenmode basis set. The sparsity of cross-mode dependencies is demonstrated through nested heatmaps, with the lower triangles representing correlation magnitudes and the upper triangles indicating suprathreshold eigenmode pairs at a correlation threshold of ρ=0.25.
Figure. 2.
Figure. 2.. Cortical Signal Reconstruction Accuracy.
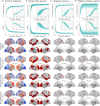
The columns display eigenmode reconstruction accuracies for (A) individual participant’s cortical thickness phenotypes, as well as (B) brain-wide, (C) regional, and (D) high-resolution spatial queries. In the shaded line plots, the lines represent the median across all observations, while the shades indicate the [25, 75], [5, 95], and [1, 99] percentiles. For cortical thickness, the data comprises observations from 2,473 participants. For spatial queries, the data respectively includes a total of 25, 200, and 400 different brain-wide, regional, and high-resolution regions of interest. The first and second rows respectively show the cumulative energy and standardized mean square error (SMSE) as a function of the number of low-frequency eigenmodes used for spectral reconstruction (logarithmic x-axis for the insets). The third row illustrates one exemplary brain map from each category, while the last three rows show the same map reconstructed using 100, 1,000, and 10,000 eigenmodes, respectively. The cortical thickness projections (first column) display the thickness for a single exemplary individual.
Figure. 3.
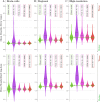
Figure. 3.. SNM Normative Performance.
This figure compares performance metrics of the SNM at various number of modes (k=10,102,103,104) against a direct normative model. Performance is evaluated across three scales of (A) brain-wide, (B) regional, and (C) high-resolution spatial queries. The rows display performance in modeling the mean (mean absolute error, MAE, top row) and the overall shape of the normative distribution (mean standardized log-loss, MSLL, bottom row). Lower values indicate better performance for both metrics. Green violin plots represent the direct model (benchmark), and SNM performance is shown in shades from purple to red for different numbers of modes. The distributional variation in the violin plots illustrates the performance variability across different spatial queries within each spatial scale. Solid and dashed lines mark the median and first/third quartiles, with a green arrow denoting the direct model’s median for reference. In all evaluations, SNMs with at least 1000 modes achieve performance comparable to the direct model.
Figure. 4.
Figure. 4.. Application of Spectral Normative Assessments for Personalized High-resolution Normative Testing.
(A) SNM can extract high-resolution lifespan charts of healthy cortical thickness changes. The model can provide estimates of normative vertex-wise thickness distribution moments (mean and deviation). (B) Execution times for training and assessments of SNM with 1,000 modes are compared to a hypothetical implementation using separate vertex-wise direct models. Times are displayed on a logarithmic scale due to the magnitude of differences; on a linear scale, the bar indicating SNM’s performance would be nearly imperceptible due to its significantly smaller execution time. (C) The high-resolution normative charts can be used for personalized assessments of individual brain scans. The cortical projections represent an exemplary individual from the test sample. Individual thickness values are smoothed using a selected kernel, and the high-resolution moments estimated by SNM are used to create individualized normative maps, indicating deviations quantified via high-resolution Z-scores or centile maps.
Figure. 5.
Figure. 5.. Cortical Signature of Atrophy in Alzheimer’s Disease and Its Cognitive Correlates.
High-resolution deviation maps were used to compute the cortical signature of atrophy in an elderly clinical cohort and assess its ability to predict cognitive impairments that are associated with AD. (A) Group-level normative differences between HC and AD. (B) Vertexwise associations between normative deviation z-scores and cognitive performance (MMSE). (C) The ETVC metric, quantifying extreme atrophy, can predict cognitive performance in the clinical cohort. (D) Comparison of z-score thresholds for ETVC reveals that vertices with extreme atrophy provide the highest predictive power for cognitive impairment. Cortical projections highlight significant regions (dimmed for non-significant voxels) at α=5% after FDR correction. Abbreviations: HC: Healthy Cohort, AD: Alzheimer’s Disease, MMSE: Mini-Mental State Examination, ETVC: Extremely Thin Vertex Count, FDR: False Discovery Rate.
Figure. 6.
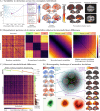
Figure. 6.. Heterogeneity Landscape of Atrophy Associated with Alzheimer’s Disease.
Individualized high-resolution deviation maps were used to assess the extent of heterogeneity in AD-related normative deviations. (A) Examples of two individuals with similar age, sex, cognitive scores, and diagnosis, who nevertheless display markedly different patterns of cortical atrophy. These maps can be overlaid onto native scans as summary reports to assist assessments of cortical atrophy. (B) Interindividual differences in normative deviations are quantified using Euclidean distance between assessment maps. Four hypothetical heatmaps illustrate how the structure of interindividual differences depends on the underlying deviation mechanisms. Deviations can be completely random and unrelated to severity (left), strictly delineated by diagnostic groups (middle left), uniformly progressive across disease stages (middle right), or display heterogeneous divergence from norms (right). (C) An empirical interindividual difference matrix is computed from the clinical cohort’s deviation maps, with individuals sorted by clinical diagnosis and, within each diagnosis, by cognitive performance (from high to low MMSE). This distance matrix suggests that AD-diagnosed individuals exhibit heterogeneous normative deviations. (D) High-resolution normative assessments are projected onto a 2-dimensional landscape, while preserving interindividual difference structure. The central scatter plot displays the distribution of individuals from HC (green), MCI (yellow), and AD (red) cohorts within this landscape, with density plots (bottom) highlighting regions predominantly occupied by each cohort. Cortical projections (left) show average deviation maps for three exemplary local areas of this landscape, while exemplary individual deviation maps are shown (right) for four AD-diagnosed individuals.

References

    1. Marquand A. F., Rezek I., Buitelaar J. & Beckmann C. F. Understanding Heterogeneity in Clinical Cohorts Using Normative Models: Beyond Case-Control Studies. Biological Psychiatry 80, 552–561. (2016). - PMC - PubMed
    1. Dinga R. et al. Normative modeling of neuroimaging data using generalized additive models of location scale and shape. bioRxiv. (2021).
    1. Rutherford S. et al. The normative modeling framework for computational psychiatry. Nature Protocols 17, 1711–1734. (July 2022). - PMC - PubMed
    1. Marquand A. F. et al. Conceptualizing mental disorders as deviations from normative functioning. Molecular Psychiatry 24, 1415–1424. (2019). - PMC - PubMed
    1. Bethlehem R. A. et al. A normative modelling approach reveals age-atypical cortical thickness in a subgroup of males with autism spectrum disorder. Communications Biology 3. (2020). - PMC - PubMed

Publication types

LinkOut - more resources