[Preprint]. 2025 Jan 22:2025.01.21.25320683.
doi: 10.1101/2025.01.21.25320683.

Fusion oncoproteins and cooperating mutations define disease phenotypes in NUP98-rearranged leukemia

Affiliations

Fusion oncoproteins and cooperating mutations define disease phenotypes in NUP98-rearranged leukemia

Masayuki Umeda et al. medRxiv. .

Update in

  • Fusion oncoproteins and cooperating mutations define disease phenotypes in NUP98-rearranged leukemia.
    Umeda M, Hiltenbrand R, Michmerhuizen NL, Barajas JM, Thomas Iii ME, Arthur B, Walsh MP, Song G, Ma J, Westover T, Kumar A, Pölönen P, Mecucci C, Di Giacomo D, Locatelli F, Masetti R, Bertuccio SN, Pigazzi M, Pruett-Miller SM, Pounds S, Rubnitz J, Inaba H, Papadopoulos KP, Wick MJ, Iacobucci I, Mullighan CG, Klco JM. Umeda M, et al. Blood. 2025 Oct 23;146(17):2102-2118. doi: 10.1182/blood.2025028993. Blood. 2025. PMID: 40700635

Abstract

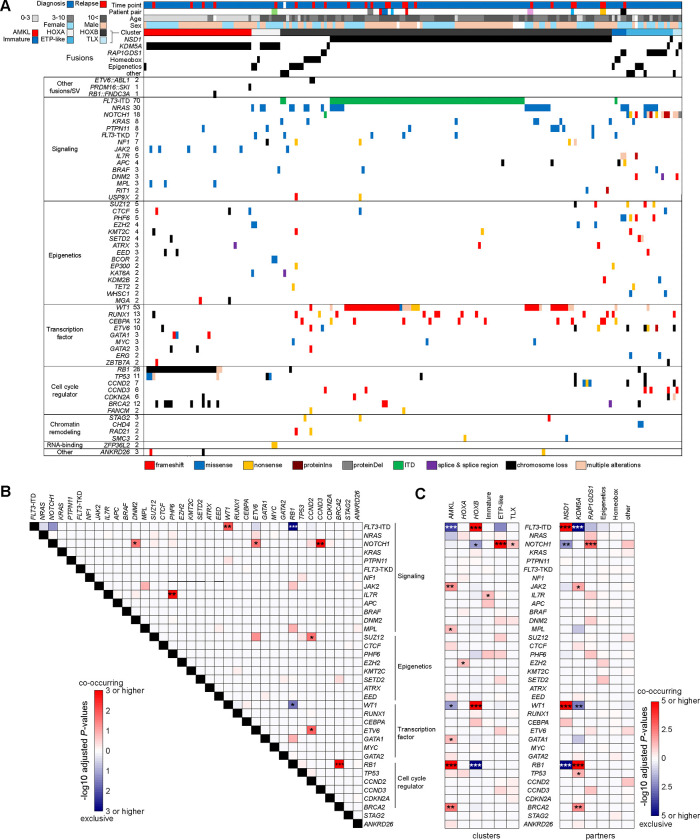
Leukemias with NUP98 rearrangements exhibit heterogeneous phenotypes correlated to fusion partners, whereas the mechanism responsible for this heterogeneity is poorly understood. Through genome-wide mutational and transcriptional analyses of 177 NUP98-rearranged leukemias, we show that cooperating alterations are associated with differentiation status even among leukemias sharing the same NUP98 fusions, such as NUP98::KDM5A acute megakaryocytic leukemia with RB1 loss or T-cell acute lymphoblastic leukemia with NOTCH1 mutations. CUT&RUN profiling reveals that NUP98 fusion oncoproteins directly regulate differentiation-related genes, with binding patterns also influenced by differentiation stage. Using in vitro models, we show RB1 loss cooperates with NUP98::KDM5A by blocking terminal differentiation toward platelets and expanding megakaryocyte-like cells, whereas WT1 frameshifts skew differentiation toward dormant lympho-myeloid primed progenitor cells and cycling granulocyte-monocyte progenitor cells. NUP98::KDM5A models with RB1 or WT1 alterations have different sensitivities to menin inhibition, suggesting cellular differentiation stage-specific resistant mechanism against menin inhibitors with clinical implications for NUP98-rearranged leukemia.


Figures

Figure 1.
Figure 1.. Heterogeneity of pediatric NUP98r leukemia
A. Details of NUP98-rearranged (NUP98r) leukemia samples (n=185, left) and analytical pipelines (right). B. Numbers and functional annotations of fusion partners in the study cohort. Colors indicate protein functional groups. C. Age distribution related to fusion partners and disease types. Colors indicate disease types. D. UMAP (Uniform Manifold Approximation and Projection) plots of transcriptional cohort (n=2,321) colored according to leukemia subtypes (left) and NUP98 fusion partners (mid) and enrichment of fusion partners in transcriptional clusters (right). The shapes of dots indicate disease types (circles-acute myeloid leukemia: AML, triangles-acute lymphoblastic leukemia: ALL), and colors in the heatmap indicate enrichment of fusions in each cluster, asterisks indicate statistically significant adjusted P-values from two-sided Fisher’s exact tests and the Benjamini-Hochberg adjustment (*<0.05, **<0.01, ***<0.001, black: enriched, blue: exclusive). In A and C, lines of the box plots represent 25% quantile, median, and 75% quantile and the upper whisker represents the higher value of maxima or 1.5 × interquartile range (IQR), and the lower whisker represents the lower value of minima or 1.5 × IQR. Abbreviations. tMN: therapy-related myeloid neoplasm, MDS/MPN: myelodysplastic syndrome/ myeloproliferative neoplasms, AEL/AMKL: acute erythroid leukemia/ acute megakaryocytic leukemia, ETP: Early T-cell precursor ALL. Abbreviations in leukemia subtypes are found in Table S10.
Figure 2.
Figure 2.. Mutational background of NUP98r leukemia associated with disease phenotypes
A. Genetic profiles of NUP98r samples in the cohort. Colors indicate patient annotations (top) and types of gene alterations (bottom). B. Co-occurrence and mutual exclusivity among recurrent alterations (n≥3). C. Enrichment of somatic alterations in transcriptional clusters (left) and fusion partners (right). In B and C, colors indicate adjusted P-values by two-sided Fisher’s exact tests and the Benjamini-Hochberg adjustment (red: co-occurring, blue: mutually exclusive), and asterisks indicate statistically significant values (adjusted P-values *<0.05, **<0.01, ***<0.001). Annotations of genes in mutational heatmaps depend on known general functions.
Figure 3.
Figure 3.. Variety of cellular hierarchies in NUP98r leukemia
A. Strategies for single cell RNAseq (scRNAseq) and deconvolution of bulk RNAseq data. B. UMAP plots of patient samples colored by sample source (left) and transcriptional clusters (right). C. Enrichment of cells in each cluster indicated by colors and sizes (left) and marker gene expression indicated by colors (averaged expression) and size (ratio of expressing cells: count>0). D. UMAP plot of reference bone marrow and thymocyte scRNAseq data, colored according to cell labels from the original reference data. E. Distribution of patient sample scRNAseq on the reference data inferred by MapQuery function in Seurat package. Cells in normal hematopoietic cell clusters were excluded. Cells are colored according to the cell density on UMAP. Cooperating mutations found in bulk samples are also shown. F. Enrichment of cells with each cell label inferred by Seurat, indicated by colors and sizes. G. Cellular component of bulk RNA samples (n=185) inferred by CIBERSORT using signature matrix derived from reference scRNAseq data. Bars are colored by cell populations in each sample. Abbreviations. HSPC: hematopoietic stem and progenitor cell, LMPP: Lympho-myeloid primed progenitor, GMP: Granulocyte-monocyte progenitor, cDC: classic dendritic cell, pDC: plasmacytoid dendritic cell, CLP: common lymphoid progenitor, DP: CD4-CD8 double-positive T-cell, NK: natural killer T-cell, MEP: Megakaryocyte–erythroid progenitor
Figure 4.
Figure 4.. Cord blood CD34 models recapitulate phenotypes of NUP98r leukemia
A. Experimental schema using cord blood CD34+ cell models (cbCD34). B. Colony-forming unit assays of cbCD34 models with empty control vectors or NUP98::NSD1, NUP98::KDM5A, or NUP98::HOXA9- expressing vectors. C. Cell growth assays of cbCD34 models in liquid culture. D. Flow cytometric analysis of cbCD34 models in liquid culture (top: CD34+, mid: CD11b+, bottom: CD41a+ population ratio:% in mCherry+ live cells). E. Principal component analysis (PCA) of RNAseq data from liquid culture. Colors indicate NUP98 fusions, and shapes indicate days after transduction. F. Heatmap showing expression of representative genes related to stemness or differentiation of hematopoietic cells. Colors of cells indicate expression levels normalized among samples, and genes are annotated on the left. G. Comparison of differentially expressed genes (DEGs) in each cbCD34 model compared with empty vector controls at day 42. Venn diagram showing overlaps of highly expressed genes in each model (mid) and GO term analyses of shared or specific DEGs are shown (left, right). Data was obtained from three biological replicates (different lots of cord blood). In B-D, statistical tests were performed by generalized linear mixed effect model with Poisson (B) and Gaussian (C-D) distributions followed by comparison with empty vector control and the Benjamini-Hochberg adjustment, asterisks indicating adjusted P-values *<0.05. Error bars indicate mean ± s.e.m. Abbreviations. FO: fusion oncoprotein, PDX: patient-derived xenograft, FDR: false-discovery rate.
Figure 5.
Figure 5.. Differential gene regulation by NUP98 fusion oncoproteins
A. IGV tracks of the HOXA-B clusters from CUT&RUN using HA, H3K4me3, and H3K27ac antibodies in HA-tagged NUP98r cbCD34 models (top: HA-NUP98::KDM5A-red, HA-NUP98::NSD1-blue, HA-NUP98::HOXA9-black) and heatmap showing expression levels of HOXA-B genes (bottom) B. IGV tracks of differentiation-related gene loci (top: RUNX1, GFI1B, and MECOM) and Venn diagram showing overlap of protein-coding genes with annotated peaks (bottom: FDR<0.00001). C. CUT&RUN strategy from primary patient samples or NUP98::KDM5A cell lines (CHRF-288–11 and ST1653). D. Counts of peaks from the N-terminus NUP98 antibody in primary samples (top) and overlaps of target genes among non-NUP98::KDM5A and NUP98::KDM5A. NUP98::KDM5A AMKL-specific 21 target genes are highlighted. Colors indicate peak annotations. E. IGV tracks of the HOXA-B cluster from CUT&RUN using N-terminal NUP98, H3K4me3, and H3K27ac antibodies in primary leukemia samples and NUP98::KDM5A cell lines. F. PCA of genome-wide PBS (probability being signals) scores of H3K27ac (left) and H3K27me3 (right) from primary samples. Colors indicate expression clusters and shapes indicate fusion partners. G. Differential signal analysis using H3K27ac PBS scores between NUP98::KDM5A and other (NUP98::NSD1 and NUP98::RAP1GDS1) samples (left) and NUP98::KDM5A AMKL and non-AMKL (right) calculated by limma followed by the Benjamini-Hochberg adjustment. Only regions with significant enrichment (adjusted P-values < 0.05) are shown. H. IGV tracks of the MECOM and MEIS2 gene loci from CUT&RUN using N-terminal NUP98, H3K4me3, and H3K27ac antibodies in primary leukemia samples and NUP98::KDM5A cell lines.
Figure 6.
Figure 6.. Functional characterization of recurrent somatic alterations in NUP98r leukemia
A. Experimental schema of induction of cooperating alterations (RB1, WT1) in cbCD34/Cas9 models. B. Cell growth assays of cbCD34/Cas9 NUP98::KDM5A with gRNAs targeting the AAVS, RB1, or WT1 loci (left), and cytospin of cells on day 35 (right). C. Induction rates of indel (insertions and deletions) at day 4 and 39 in each condition. Bars represent fractions of indel rates in all target sequence reads, and dots represent out-of-frame indel ratio among total indels. D. Flow gating (left), CD34+ CD41a+ positivity (mid), and CD34+ CD41a− (right) among mCherry+ GFP+ mAmetrine+ live cells. E. PCA of RNAseq of gRNA-transduced NUP98::KDM5A cbCD34 models at day 35. F. DEG analysis between AAVS controls and RB1-gRNA conditions (left) and gene ontology (GO) term analysis of DEGs (right). Colors indicate DEGs and GO terms (red: high in RB1-gRNA conditions, blue: low in RB1-gRNA conditions). G. DEG analysis between AAVS controls and WT1-gRNA conditions as shown in F. H. UMAP plots of scRNAseq data from gRNA-transduced NUP98::KDM5A cbCD34 models at day35, showing marker gene expression (left), annotated clusters (mid), and cell distributions among conditions (right). Colors in plots indicate relative expression levels, clusters, and cell density, respectively. I. Enrichment of cells with each cluster indicated by colors and sizes. J. Pseudotime along myeloid (HSC→GMP→monocytes) and platelet (HSC→MEP→MK→platelet) trajectories. Colors represent pseudotime scores of each single cell inferred by Slingshot. K. RB1 (top) and CDKN2A (bottom) expression along the pseudotime axis in each condition with red curves show average expressions. L. DEG analysis between the platelet-like and MK-like clusters in the AAVS-control condition (left) and GO term analysis (right) of genes high in the platelet-like cluster (red) and the MK-like cluster (blue). M. Schematics illustrating platelet differentiation in normal hematopoiesis and NUP98::KDM5A models. Assay data was obtained in technical triplicates from an established NUP98::KDM5A/Cas9 line and independent experiments. One data point in C was not obtained due to technical errors. RNAseq data was obtained from six independent experiments. In B-D, statistical tests were performed by linear mixed effect model (B) or two-sided Student’s t-test by comparing day 4 and day 39 (C) or gRNA conditions and AAVS controls (D), and limma (F, G) followed by the Benjamini-Hochberg adjustment when applicable. DEGs in scRNAseq (L) were identified using FindMarker function in Seurat package with default settings, which calculate adjusted P-values with limma implementation of the Wilcoxon rank-sum test followed by Bonferroni correction. Asterisks indicating P-values or adjusted P-values <0.05. Error bars indicate mean ± s.e.m.
Figure 7.
Figure 7.. Cooperating alterations and differentiation status affect sensitivity to menin inhibition
A. Experimental schema showing revumenib treatment. B. Relative cell growth of cbCD34 NUP98::KDM5A models with gRNA treated with revumenib (0.1–1μM) compared with DMSO controls. C. Flow gating (top), CD34+CD41a+ population (left), CD34−CD41a+ population (mid), and CD34−CD11B+ populations (right) among mCherry+ GFP+ mAmetrine+ live population at day 15. D. GSEA analyses between DMSO and revumenib-treated conditions, colors showing NES (top-left), comparison of expression changes between AAVS and RB1-gRNA1 conditions (right), and GO term analysis of changes enriched (difference of fold changes >1) in AAVS conditions (bottom-left). E. Relative cell growth of unedited cdCD34 NUP98::KDM5A (control, black), CHRF-288–11 (red) and ST1653 PDX (blue) treated with revumenib (0.1–1μM) compared with DMSO controls. F. Schematics illustrating cellular hierarchy of NUP98::KDM5A models. Data was obtained from three technical replicates using gRNA-transduced cells in Fig.6. One data point at day 15 was excluded for technical errors. Statistical tests were performed by generalized linear mixed effect model with Gaussian distribution followed by the Benjamini-Hochberg adjustment (B, E) or Student’s t-test by comparing gRNA conditions with AAVS controls (C). Asterisks indicating P-values or adjusted P-values *<0.05. Error bars indicate mean ± s.e.m.

References

    1. Rubnitz J.E. & Kaspers G.J.L. How I treat pediatric acute myeloid leukemia. Blood 138, 1009–1018 (2021). - PubMed
    1. Rubnitz J.E. et al. Clofarabine Can Replace Anthracyclines and Etoposide in Remission Induction Therapy for Childhood Acute Myeloid Leukemia: The AML08 Multicenter, Randomized Phase III Trial. J Clin Oncol 37, 2072–2081 (2019). - PMC - PubMed
    1. Pollard J.A. et al. Sorafenib in Combination With Standard Chemotherapy for Children With High Allelic Ratio FLT3/ITD+ Acute Myeloid Leukemia: A Report From the Children’s Oncology Group Protocol AAML1031. J Clin Oncol 40, 2023–2035 (2022). - PMC - PubMed
    1. Balgobind B.V. et al. Novel prognostic subgroups in childhood 11q23/MLL-rearranged acute myeloid leukemia: results of an international retrospective study. Blood 114, 2489–96 (2009). - PMC - PubMed
    1. Umeda M. et al. A new genomic framework to categorize pediatric acute myeloid leukemia. Nat Genet (2024). - PMC - PubMed

Publication types

LinkOut - more resources