Integrative transcriptomic and proteomic analysis reveals that SERPING1 inhibits neuronal proliferation via the CaMKII-CREB-BDNF pathway in schizophrenia
- PMID: 39974493
- PMCID: PMC11758061
- DOI: 10.5498/wjp.v15.i2.100214
Integrative transcriptomic and proteomic analysis reveals that SERPING1 inhibits neuronal proliferation via the CaMKII-CREB-BDNF pathway in schizophrenia
Abstract
Background: Schizophrenia (SZ), a chronic and widespread brain disorder, presents with complex etiology and pathogenesis that remain inadequately understood. Despite the absence of a universally recognized endophenotype, peripheral blood mononuclear cells (PBMCs) serve as a robust model for investigating intracellular alterations linked to SZ.
Aim: To preliminarily investigate potential pathogenic mechanisms and identify novel biomarkers for SZ.
Methods: PBMCs from SZ patients were subjected to integrative transcriptomic and proteomic analyses to uncover differentially expressed genes (DEGs) and differentially expressed proteins while mapping putative disease-associated signaling pathways. Key findings were validated using western blot (WB) and real-time fluorescence quantitative PCR (RT-qPCR). RNAi-lentivirus was employed to transfect rat hippocampal CA1 neurons in vitro, with subsequent verification of target gene expression via RT-qPCR. The levels of neuronal conduction proteins, including calmodulin-dependent protein kinase II (caMKII), CREB, and BDNF, were assessed through WB. Apoptosis was quantified by flow cytometry, while cell proliferation and viability were evaluated using the Cell Counting Kit-8 assay.
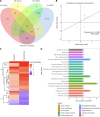
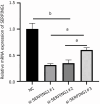
Results: The integration of transcriptomic and proteomic analyses identified 6079 co-expressed genes, among which 25 DEGs were significantly altered between the SZ group and healthy controls. Notably, haptoglobin (HP), lactotransferrin (LTF), and SERPING1 exhibited marked upregulation. KEGG pathway enrichment analysis implicated neuroactive ligand-receptor interaction pathways in disease pathogenesis. Clinical sample validation demonstrated elevated protein and mRNA levels of HP, LTF, and SERPING1 in the SZ group compared to controls. WB analysis of all clinical samples further corroborated the significant upregulation of SERPING1. In hippocampal CA1 neurons transfected with lentivirus, reduced SERPING1 expression was accompanied by increased levels of CaMKII, CREB, and BDNF, enhanced cell viability, and reduced apoptosis.
Conclusion: SERPING1 may suppress neural cell proliferation in SZ patients via modulation of the CaMKII-CREB-BDNF signaling pathway.
Keywords: Pathogenesis; Proteomics; SERPING1; Schizophrenia; Transcriptomics.
©The Author(s) 2025. Published by Baishideng Publishing Group Inc. All rights reserved.
Conflict of interest statement
Conflict-of-interest statement: The authors declare that they have no conflict of interest.
Figures


Similar articles
-
ω-3PUFAs Improve Cognitive Impairments Through Ser133 Phosphorylation of CREB Upregulating BDNF/TrkB Signal in Schizophrenia.Neurotherapeutics. 2020 Jul;17(3):1271-1286. doi: 10.1007/s13311-020-00859-w. Neurotherapeutics. 2020. PMID: 32367475 Free PMC article.
-
Dexmedetomidine attenuates the neurotoxicity of propofol toward primary hippocampal neurons in vitro via Erk1/2/CREB/BDNF signaling pathways.Drug Des Devel Ther. 2019 Feb 19;13:695-706. doi: 10.2147/DDDT.S188436. eCollection 2019. Drug Des Devel Ther. 2019. PMID: 30858699 Free PMC article.
-
Integrative transcriptome network analysis of iPSC-derived neurons from schizophrenia and schizoaffective disorder patients with 22q11.2 deletion.BMC Syst Biol. 2016 Nov 15;10(1):105. doi: 10.1186/s12918-016-0366-0. BMC Syst Biol. 2016. PMID: 27846841 Free PMC article.
-
Network pharmacology and experimental evidence: ERK/CREB/BDNF signaling pathway is involved in the antidepressive roles of Kaiyu Zhishen decoction.J Ethnopharmacol. 2024 Jul 15;329:118098. doi: 10.1016/j.jep.2024.118098. Epub 2024 Apr 4. J Ethnopharmacol. 2024. PMID: 38582152
-
Liver transcriptomic and proteomic analyses provide new insight into the pathogenesis of liver fibrosis in mice.Genomics. 2023 Nov;115(6):110738. doi: 10.1016/j.ygeno.2023.110738. Epub 2023 Oct 31. Genomics. 2023. PMID: 37918454 Review.
References
LinkOut - more resources
Full Text Sources
Research Materials
Miscellaneous

