. 2025 Feb 5:13:1450407.
doi: 10.3389/fcell.2025.1450407. eCollection 2025.

Cisplatin resistance alters ovarian cancer spheroid formation and impacts peritoneal invasion

Affiliations

Cisplatin resistance alters ovarian cancer spheroid formation and impacts peritoneal invasion

Lydia C Powell et al. Front Cell Dev Biol. .

Abstract

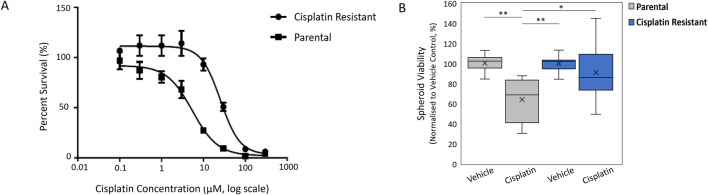
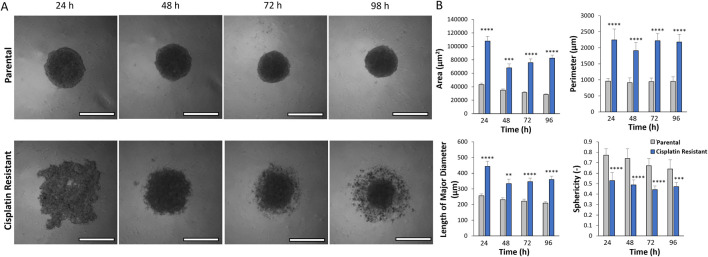
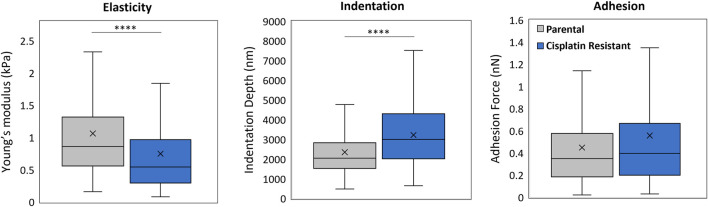
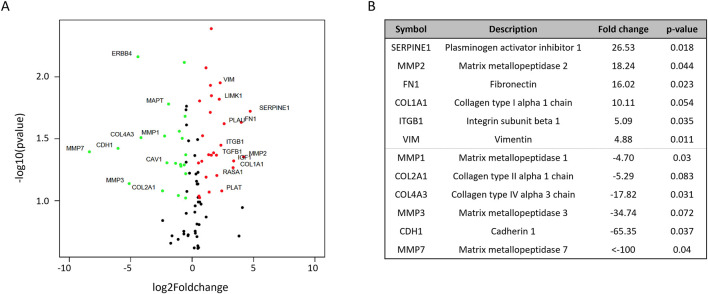
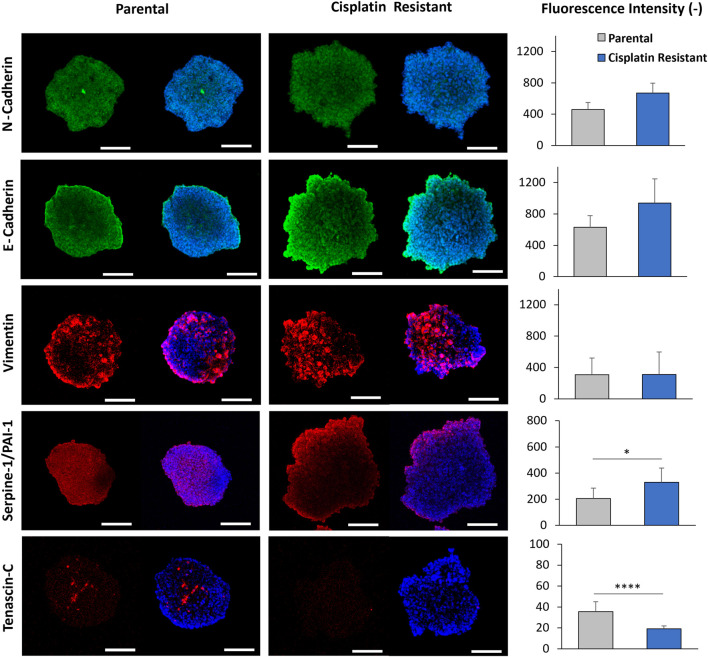
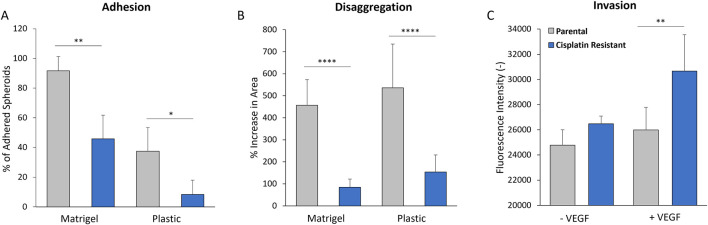
Epithelial ovarian cancer (EOC) is an aggressive and lethal gynaecologic malignancy due to late diagnosis and acquired resistance to chemotherapeutic drugs, such as cisplatin. EOC metastasis commonly occurs through the extensive dissemination of multicellular aggregates, formed of cells originally shed from the primary ovarian tumour, within the peritoneal cavity. However, little is known about how cisplatin resistance (CR) alters the biophysical properties of EOC multicellular aggregates and how this impacts metastasis. In this interdisciplinary study, light and atomic force microscopy was used, alongside quantitative gene and protein expression analysis, to reveal distinct differences in the biophysical properties of CR spheroids, which correlated with altered protein expression of plasminogen activator inhibitor-1 (PAI-1) and Tenascin-C. CR SKOV3 spheroids (IC50: 25.5 µM) had a significantly greater area and perimeter and were less spherical, with a reduced Young's modulus, (p < 0.01) compared to parental (P) SKOV3 spheroids (IC50: 5.4 µM). Gene expression arrays revealed upregulation of genes associated with cell adhesion, extracellular matrix (ECM) and epithelial-to-mesenchymal transition (EMT) in CR spheroids, while immunofluorescence assays demonstrated increased protein expression of PAI-1 (p < 0.05; implicated in cell adhesion) and reduced protein expression of Tenascin-C (p < 0.01; implicated in elasticity) in CR spheroids compared to P spheroids. Furthermore, the CR spheroids demonstrated altered interactions with a surface that mimics the peritoneal lining post mesothelial clearance (Matrigel). CR spheroids were significantly less adhesive with reduced disaggregation on Matrigel surfaces, compared to P spheroids (p < 0.05), while CR cells were more invasive compared to P cells. The combined characterisation of the biophysical and biological roles of EOC multicellular aggregates in drug resistance and metastasis highlight key proteins which could be responsible for altered metastatic progression that may occur in patients that present with cisplatin resistance.

Keywords: atomic force microscopy; biophysics; cisplatin; invasion; ovarian cancer; spheroids.


Conflict of interest statement

Authors AD and HH were employed by Bruker Nano GmbH and authors JW and NW were employed by AxisBio Discovery Services. The remaining authors declare that the research was conducted in the absence of any commercial or financial relationships that could be construed as a potential conflict of interest. The author(s) declared that they were an editorial board member of Frontiers, at the time of submission. This had no impact on the peer review process and the final decision.

Figures

FIGURE 1
FIGURE 1
(A) Cell viability curves to determine the IC50 value of cisplatin against Parental SKOV3 and Cisplatin-resistant SKOV3 cells. (B) Spheroid viability normalized to vehicle control of cisplatin against Parental SKOV3 and Cisplatin-resistant SKOV3 spheroids. Data shown is based on a minimum of three biological repeats (n = 3), statistically analysed as parametric data using one-way ANOVA test with Tukey’s multiple comparison test. Significance given as *p < 0.05, **p < 0.01.
FIGURE 2
FIGURE 2
(A) Light microscopy images of parental and cisplatin-resistant SKOV3 spheroids formed over 24–98 h (Scale bar 200 µm). (B) AnaSP analysis of the spheroid light microscopy images to quantify the area (µm2), perimeter (µm), length of the major diameter (µm) and the sphericity (−) of the spheroids. Data is shown as the mean and SD of 21 spheroids and a minimum of three biological repeats (n = 3), statistically analysed as non-parametric data using the Kruskal-Wallis test with Dunn’s multiple comparison test. Significance given as **p < 0.01, ***p < 0.001, ****p < 0.0001.
FIGURE 3
FIGURE 3
(A) CLSM images of 48 h parental and cisplatin-resistant SKOV3 spheroids stained with LIVE/DEAD staining and Hoechst to visualize the nucleus (Scale bar 200 µm). (B) Quantification of the fluorescence intensity of the fluorescent markers in the CLSM images. Data is shown as the mean and SD of 12 spheroids and a minimum of three biological repeats (n = 3). The data was statistically analysed as non-parametric data using the Mann Whitney test, however, no significant differences were determined.
FIGURE 4
FIGURE 4
AFM force measurement analysis of 48 h parental and cisplatin-resistant SKOV3 spheroids resulting in measurements of Young’s modulus (kPa), indentation depth (nm) and adhesion (nN). Data is shown as box plots produced from a minimum of 336 curves, 24 spheroids per sample and a minimum of three biological repeats (n = 3), statistically analysed as non-parametric data using Mann Whitney test. Significance given as ****p < 0.0001.
FIGURE 5
FIGURE 5
PCR arrays examining differential cytoskeleton and ECM remodeling gene expression between parental and cisplatin-resistant SKOV3 spheroids from two biological repeats (A) Volcano plot highlighting the most significantly upregulated (red) or downregulated (green) cytoskeleton and ECM genes. (B) List of the six most significantly upregulated and downregulated cytoskeleton and ECM genes, including fold changes and p-value. t-test statistical analyses were performed on ΔCt values of two biological replicates (n = 2).
FIGURE 6
FIGURE 6
CLSM imaging of 48 h parental and cisplatin-resistant SKOV3 spheroids that were immunofluorescently stained with primary/secondary antibodies to visualize E-cadherin, N-cadherin, vimentin, serpine-1/PA1-1 and tenascin-C. Furthermore, the cells were counterstained with Hoechst to visualize the nucleus (Scale bar 200 µm). Quantification of the fluorescence intensity of E-cadherin, N-cadherin, tenascin-C, vimentin, and serpine-1/PA1-1 markers expressed in the spheroids from the CLSM images is shown. Data is shown as the mean and SD of a minimum of five biological spheroid repeats, statistically analysed as non-parametric data using Mann Whitney test. Significance given as *p < 0.05, ****p < 0.0001.
FIGURE 7
FIGURE 7
(A) Adhesion of 48 h parental and cisplatin-resistant SKOV3 spheroids to uncoated plastic and Matrigel-coated surfaces after 3 h incubation. (B) Disaggregation of 48 h parental and cisplatin-resistant SKOV3 spheroids on uncoated plastic and Matrigel-coated surfaces after 24 h incubation, as measured by % increase in spheroid area. (C) Invasion of parental and cisplatin-resistant SKOV3 cells through basement membrane-coated transwells in the presence and absence of VEGF, as measured by fluorescence intensity of stained cells in the lower chamber. Data is shown as the mean with a SD of a minimum of six spheroids and a minimum of three biological repeats, statistically analysed as either parametric data using one-way ANOVA test with Tukey’s multiple comparison test or non-parametric data using the Kruskal-Wallis test with Dunn’s multiple comparison test. Significance given as *p < 0.05, **p < 0.01, ***p < 0.001, ****p < 0.0001.

References

    1. Abidine Y., Giannetti A., Revilloud J., Laurent V. M., Verdier C. (2021). Viscoelastic properties in cancer: from cells to spheroids. Cells 10, 1704. 10.3390/cells10071704 - DOI - PMC - PubMed
    1. Al Habyan S., Kalos C., Szymborski J., McCaffrey L. (2018). Multicellular detachment generates metastatic spheroids during intra-abdominal dissemination in epithelial ovarian cancer. Oncogene 37, 5127–5135. 10.1038/s41388-018-0317-x - DOI - PMC - PubMed
    1. An Q., Liu T., Wang M. Y., Yang Y. J., Zhang Z. D., Lin Z. J., et al. (2020). Circkrt7-mir-29a-3p-col1a1 axis promotes ovarian cancer cell progression. Onco Targets Ther. 13, 8963–8976. 10.2147/OTT.S259033 - DOI - PMC - PubMed
    1. Andolfi L., Greco S. L. M., Tierno D., Chignola R., Martinelli M., Giolo E., et al. (2019). Planar AFM macro-probes to study the biomechanical properties of large cells and 3D cell spheroids. Acta Biomater. 94, 505–513. 10.1016/J.ACTBIO.2019.05.072 - DOI - PubMed
    1. Ansardamavandi A., Tafazzoli-Shadpour M., Omidvar R., Nili F. (2020). An AFM-based nanomechanical study of ovarian tissues with pathological conditions. Int. J. Nanomedicine 15, 4333–4350. 10.2147/IJN.S254342 - DOI - PMC - PubMed

LinkOut - more resources