[Preprint]. 2025 Jan 27:2025.01.26.634826.
doi: 10.1101/2025.01.26.634826.

Epigenetic priming promotes acquisition of tyrosine kinase inhibitor resistance and oncogene amplification in human lung cancer

Affiliations

Epigenetic priming promotes acquisition of tyrosine kinase inhibitor resistance and oncogene amplification in human lung cancer

Rebecca M Starble et al. bioRxiv. .

Abstract

In mammalian cells, gene copy number is tightly controlled to maintain gene expression and genome stability. However, a common molecular feature across cancer types is oncogene amplification, which promotes cancer progression by drastically increasing the copy number and expression of tumor-promoting genes. For example, in tyrosine kinase inhibitor (TKI)-resistant lung adenocarcinoma (LUAD), oncogene amplification occurs in over 40% of patients' tumors. Despite the prevalence of oncogene amplification in TKI-resistant tumors, the mechanisms facilitating oncogene amplification are not fully understood. Here, we find that LUADs exhibit a unique chromatin signature demarcated by strong CTCF and cohesin deposition in drug-naïve tumors, which correlates with the boundaries of oncogene amplicons in TKI-resistant LUAD cells. We identified a global chromatin priming effect during the acquisition of TKI resistance, marked by a dynamic increase of H3K27Ac, cohesin loading, and inter-TAD interactions, which occurs before the onset of oncogene amplification. Furthermore, we have found that the METTL7A protein, which was previously reported to localize to the endoplasmic reticulum and inner nuclear membrane, has a novel chromatin regulatory function by binding to amplified loci and regulating cohesin recruitment and inter-TAD interactions. Surprisingly, we discovered that METTL7A remodels the chromatin landscape prior to large-scale copy number gains. Furthermore, while METTL7A depletion has little effect on the chromatin structure and proliferation of drug-naïve cells, METTL7A depletion prevents the formation and maintenance of TKI resistant-clones, highlighting the specific role of METTL7A as cells are becoming resistant. In summary, we discovered an unexpected mechanism required for the acquisition of TKI resistance regulated by a largely uncharacterized factor, METTL7A. This discovery sheds light into the maintenance of oncogene copy number and paves the way to the development of new therapeutics for preventing TKI resistance in LUAD.


Conflict of interest statement

Competing interests The authors declare no competing interests.

Figures

Extended Data Fig. 1.
Extended Data Fig. 1.. Oncogene amplification occurs in EGFR-mutant LUADs.
a, Cell viability curves in EGFR-mutant LUAD cell lines PC9, HCC827, and H1975 comparing osimertinib sensitivity between parental cells and osimertinib-resistant (OR) cell lines. Error bars: standard deviation between three biological replicates. b, Amplicon complexity score increases, although not statistically significant (NS), in osimertinib resistant cells compared to parental cells. c, WGS IGV tracks with schematic of DNA FISH probe design strategy. DNA FISH probes were designed to target a 100 kb amplified locus or a 1.5 Mb unamplified control locus. d, Quantification of FISH foci from Fig. 1c. P values determined by two-sided Wilcoxon test. **P < 0.01, ***P < 2.2 × 10⁻¹⁶. P: parental; OR: osimertinib-resistant. e, Representative metaphase FISH images in sensitive and resistant cells. Scale bars are 5 μm in all images except PC9-OR HSR inset, which has a 3 μm scale bar. f, Metaphase FISH images from COLO320-DM (top) and COLO320-HSR (bottom) which exhibit ecDNA- and HSR-like MYC amplicons, respectively.
Extended Data Fig. 2.
Extended Data Fig. 2.. Oncogene amplification occurs in osimertinib-resistant EGFR-mutant LUADs from patients.
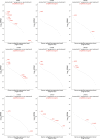
Ranked RNA expression plots of osimertinib-treated tumors from NCT02759835. Copy number analysis was performed comparing 1st or 2nd progression tumors treated with osimertinib to untreated tumors using whole exome sequencing. Red dots are amplified oncogenes.
Extended Data Fig. 3.
Extended Data Fig. 3.. Oncogene amplicons have a pre-defined chromatin architecture.
a, Breakdown of amplicon structures in PDX tumors derived from osimertinib-treated LUAD tumors. b, Copy number of amplified genes in PDX LUAD samples. Green: genes predicted to be amplified as ecDNA based on AA. c, Bar chart showing commonly amplified oncogenes across PDX tumor samples, colored by amplicon classification. d, Ranked RNA expression plots in osimertinib-treated PDX LUADs. Red dots: amplified oncogenes; green dots: ecDNA based on WGS/AA analysis. e, Amplicon complexity scores in PDX LUAD samples. f, Analysis of CTCF signal in PC9 cells based on the boundaries of amplicons from PDX tumors. CTCF is enriched at the boundaries of amplicons from PDX samples LAT001 and TMN0123. g, Example IGV sequencing tracks of PC9 CTCF signal (grey) and PC9 RAD21 signal (red) correlated with the boundaries of the amplicons from PDX tumors LAT001 (top) and TMN0123 (bottom). Both CTCF and RAD21 are enriched at one amplicon boundary. h, Example IGV sequencing track of CTCF signal from neural crest cells correlated with the boundary of the BRAF amplicon in M249 cells resistant to BRAFi and MEKi.
Extended Data Fig. 4.
Extended Data Fig. 4.. Chromatin priming precedes oncogene amplification.
a, Genome coverage (RPKM) based on H2A CUT&RUN in PC9 cells treated without osimertinib or with osimertinib for 6–8 or 12+ (PC9-OR) weeks. Each dot represents an amplicon locus determined by AA in PC9-OR cells. Signal is normalized for sequencing depth. b, Ranked RNA expression plot showing Log2FC between PC9 cells treated with osimertinib for 8 weeks compared to parental cells. Genes that have gained an H3K27ac peak upon osimertinib treatment are highlighted in red. c, Western blots showing shRNA-mediated knockdown efficiency of RAF1 in PC9 cells (left) and MET in HCC827 cells (right). d, Colony formation assay in PC9 (left) and HCC827 (right) cells expressing shRNAs targeting RAF1 or MET, respectively, or a non-targeting control. Cells were treated with osimertinib for approximately 5 weeks and fixed and stained with crystal violet. e, Quantification of (d). P-values determined by an unpaired t-test. Error bars represent standard deviation from three biological replicates.
Extended Data Fig. 5.
Extended Data Fig. 5.. METTL7A promotes the acquisition of osimertinib-resistant LUAD.
a, Ranked RNA expression plot showing the differentially expressed (Padj < 0.001) putative and known epigenetic factors that are upregulated (red, log2FC > 1) or downregulated (blue, log2FC < 1) after 4 (left) and 8 (right) weeks of osimertinib treatment. b, RT-qPCR of METTL7A in HCC827 cells treated with osimertinib at the indicated time points from two biological replicates. c, Top: Western blot in PC9 METTL7A WT, KO, or KO cells rescued by overexpressing METTL7A-MYC-FLAG. Bottom: RT-qPCR of METTL7A in METTL7A WT, KO, or KO cells rescued by overexpressing METTL7A-MYC-FLAG. d, (left) UMAP of YU-006 PDX samples colored based on clusters, (middle) colored by condition, (right) colored by METTL7A expression. e, Heatmap visualization showing METTL7A expression in clusters 2 and 8 from (d) along with previously identified factors such as ASCL1, that pre-exist in YU-006 untreated tumor. f, RT-qPCR of METTL7A in PC9 and HCC827 cells expressing a nontargeting control shRNA (shCTL) or an shRNA targeting METTL7A. g, Colony formation assay in PC9 and HCC827 cells expressing an shRNA targeting METTL7A or a non-targeting shCTL. shMETTL7A cells fail to form osimertinib-resistant colonies after approximately 4 weeks. h, Quantification of (g). Error bars represent standard deviation between biological triplicates. Significance determined by unpaired t-test. i, Colony formation assays in PC9-OR shCTL and shMETTL7A cells treated with or without osimertinib. j, Quantification of (i). k, Resistance index (mean percent area -osi/mean percent area +osi). Error bars represent standard deviation between biological triplicates with three technical replicates per biological replicate.
Extended Data Fig. 6.
Extended Data Fig. 6.. METTL7A binds to amplified oncogenes.
a, Subcellular fractionation of PC9 and HCC827 cells that express MYC-tagged METTL7A. Wildtype cells that do not express METTL7A-MYC were used as negative controls. α-tubulin, Calnexin, and Lamin B1 antibodies were used to ensure the purity of each indicated fraction. P: parental, OR: osimertinib-resistant. b, Overlap between METTL7A ChIP peaks and amplicons determined from WGS. c, Example IGV track of METTL7A enrichment over amplicons in PC9-OR cells. BigWig signal is normalized by ChIP input. d, METTL7A peak annotation in PC9-OR and HCC827-OR cells. e, METTL7A motif analysis via STREME. f, GO analysis of METTL7A promoter peaks in PC9-OR and HCC827-OR cells. g, Venn diagrams showing overlap between METTL7A and H3K9me2 (top) and H3K9me3 (bottom). h, Western blot of rescue constructs overexpressed in the METTL7A KO background. EV = empty vector. i, Representative immunofluorescence images of METTL7A-FLAG tag in PC9-OR cells expressing either WT METTL7A-FLAG-tag or K86A-mutant METTL7A-FLAG-tag. Scale bar is 10 microns. j, Quantification of nuclear METTL7A-FLAG-tag foci. ***p < 0.001.
Extended Data Fig. 7.
Extended Data Fig. 7.. Recombinant METTL7A binds to DNA in vitro.
a, Coomassie gel showing MBP-tagged METTL7A purified from E. coli. b, Gel shift assay shows MBP-M7AdsDNA complex formation at increasing ratios of MBP-M7A-to-dsDNA. c, Quantification of gel shift assays with recombinant MBP-M7A WT and MBP-M7A-K86A. The Kd value was calculated based on the fraction of bound dsDNA at increasing concentrations of MBP-METTL7A.
Extended Data Fig. 8.
Extended Data Fig. 8.. METTL7A affects the deposition of cohesin components.
a, Metaplots of H3K27ac and RAD21 CUT&RUN in PC9 cells treated with osimertinib in the METTL7A (M7A) WT, KO, or rescue background. b, Heatmaps of H3K27ac and RAD21 CUT&RUN data in PC9 cells treated without osimertinib (parental cells). Signal is centered on peaks that were lost, gained, or unchanged upon M7A KO. CUT&RUN signal is normalized by CPM, H2A signal is subtracted, and mean bigWig signal between two biological replicates is shown. c, METTL7A-MYC-FLAG immunoprecipitation using antibodies against IgG, MYC, or FLAG followed by PDS5A western blotting shows binding between METTL7A-MYC-FLAG and PDS5A relative to 0.5% input. Anti-FLAG blotting shows the efficiency of each IP. d, Proximity ligation assays in PC9-OR and HCC827-OR cells show that METTL7A and PDS5A are in close proximity. PDS5A and RAD21 antibodies were used as a positive control. Wildtype (WT) cells that do not express the METTL7A-MYC-FLAG fusion protein were used as a negative control. Green signal: PLA foci; magenta: DAPI. Scale bar: 20 μm. e, Quantification of 7d. ***P < 2.2 × 10⁻¹⁶. f, Metaplot of PDS5A CUT&RUN in PC9 cells treated with osimertinib in the METTL7A (M7A) WT, KO, or rescue background. g, Heatmaps of PDS5A CUT&RUN data in PC9 cells treated without osimertinib (parental cells). Signal is centered on peaks that were lost, gained, or unchanged upon M7A KO. CUT&RUN signal is normalized by CPM, H2A signal is subtracted, and mean bigWig signal between two biological replicates is shown. h, (top) Schematic depicting how the chromatin structure is “primed” during the acquisition of resistance prior to the development of resistant cells with oncogene amplification. (bottom) IGV tracks from WGS (dark blue), METTL7A ChIP in PC9-OR METTL7A-MYC cells (teal), H3K27ac CUT&RUN (green), and RAD21 CUT&RUN (red). H3K27ac and RAD21 are gained at the boundaries of the “future amplicons” (loci that are amplified in PC9-OR cells but not in “primed” cells). METTL7A KO leads to reduced H3K27ac and RAD21 at these loci. i, Overlap of PDS5A and RAD21 CUT&RUN peaks in cells treated with osimertinib. Percent overlap indicates percentage of overlapped peaks compared to total number of RAD21 peaks. j, Western blots of PDS5A and RAD21 show that changes in PDS5A and RAD21 deposition are not due to changes in protein levels.
Extended Data Fig. 9.
Extended Data Fig. 9.. METTL7A affects gene copy number.
a, RAF1 FISH in PC9 WT and METTL7A KO parental cells and cells treated with osimertinib for 8 weeks. b, Quantification of RAF1 DNA FISH in (a). c, RAF1 FISH in PC9-OR shCTL and shMETTL7A cells. d, Quantification of RAF1 DNA FISH in (c). e, WGS and AA analysis of PC9-OR WT and KO cells shows a decrease in average copy number upon METTL7A depletion.
Extended Data Fig. 10.
Extended Data Fig. 10.. METTL7A affects chromatin compaction as cells acquire resistance to osimertinib.
a, Fold change of inter-TAD decompaction score upon osimertinib (osi) treatment in PC9 WT and METTL7A (M7A) KO cells. b, Chr22 tracing reveals increased long-range inter-TAD contacts in wildtype cells treated with osimertinib compared to METTL7A KO cells. c, Quantification of long-range inter-TAD contact frequency across all long-range interTAD pairs, AA inter-TAD pairs, AB inter-TAD pairs, and BB inter-TAD pairs. (*** P < 0.001; ** P < 0.01; n.s. not significant).
Main Fig. 1.
Main Fig. 1.. Osimertinib-resistant EGFR-mutant LUADs exhibit oncogene amplicons demarcated by CTCF binding.
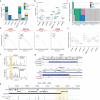
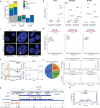
a, Whole-genome sequencing (WGS) and AmpliconArchitect (AA) analysis of parental and osimertinib-resistant cells shows the breakdown of amplicon structures across cell lines. P: parental, OR: osimertinib-resistant. b, Scatterplot of genes amplified across cell lines reveals an increase in amplicon copy number in PC9-OR and HCC827-OR cells compared to their parental counterparts. Pink and green dots denote genes predicted to be amplified via breakage-fusion-bridge (BFB) cycles and as extrachromosomal DNA (ecDNA) respectively based on AA analysis. c, Representative FISH images of amplified oncogenes and unamplified, control chromosomal loci. Scale bars: 5 μm. d, Ranked RNA expression plots in osimertinib-resistant cell lines. Red dots: amplified oncogenes; green dots: ecDNA based on WGS/AA analysis. e, Analysis of average CTCF and RAD21 signal at the boundaries of amplicons (left) compared to average signal at TAD boundaries (right) in PC9 cells. CTCF and RAD21 signal is increased at amplicon boundaries. Amplicon boundaries are determined by AA/WGS analysis in PC9-OR cells and TAD boundaries are determined by PC9 Hi-C. Because amplicons range in size from approximately 15 kb to 10 Mb, CTCF signal was plotted over scaled amplicons. Intersection between CTCF peaks and amplicons: p < 7.5 × 10⁻¹⁵, Fisher’s exact test. f, Left: amplicon CTCF motif classification based on the presence of a CTCF motif within 10kb of the start and/or end of the amplified interval. CTCF ChIP data is from PC9 parental cells; amplicons are based on AA from PC9-OR cells. Right: PC9 CTCF signal plotted over each of the PC9-OR amplicons categorized by the presence of CTCF motifs. g, Example IGV tracks showing CTCF (light grey) and RAD21 (red) enrichment over amplicon (dark blue) boundaries. CTCF orientation is indicated by grey triangles. h, CTCF signal plotted over amplicons (or amplicon coordinates shuffled over the genome, grey) in PC3 cell line.
Main Fig. 2.
Main Fig. 2.. METTL7A promotes the acquisition of osimertinib-resistant LUAD.
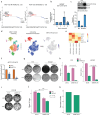
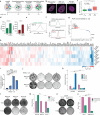
a, Schematic of PC9 cell line model of acquired osimertinib resistance. Cells transition through a quiescent, drug-tolerant persister (DTP) state before entering a proliferative resistant state. b, DNA FISH for the RAF1 locus (green) in PC9 cells treated for 0, 8, or 12+ weeks with osimertinib. c, Quantification of Fig. 2b. Significance determined by unpaired t-test. N = number of nuclei imaged per sample from two biological replicates. d, Total number of significant H3K27ac peaks (left) and RAD21 peaks (right) in PC9 cells treated without osimertinib or for 8 weeks with osimertinib. Plotted are the consensus peaks based on IDR analysis between two biological replicates. e, H3K27ac CUT&RUN signal in PC9 cells treated without osimertinib or with osimertinib for 6–8 weeks, centered on genes significantly upregulated upon osimertinib treatment. H3K27ac signal is normalized by CPM and H2A is subtracted. Gain of H3K27ac signal in 8-week osimertinib-treated cells is not correlated with differentially expressed genes. f, CTCF signal is enriched at H3K27ac and RAD21 peaks gained upon osimertinib treatment compared to peaks randomly shuffled over the genome. g, Ranked RNA expression plot showing the differentially expressed (Padj < 0.001) putative and known chromatin and epigenetic factors that are upregulated (red, log2FC > 1) or downregulated (blue, log2FC < 1) in PC9 cells after 5 weeks of osimertinib treatment. h, Heatmap of differentially expressed epigenetic factors in PDX models treated with osimertinib compared to vehicle. METTL7A (red) is one of the top upregulated genes across PDX samples treated with osimertinib. i, RT-qPCR validation of RNA-seq shows significant upregulation of METTL7A during the acquisition of osimertinib resistance in PC9 cells. P < 0.0001, calculated via an unpaired t-test. Standard deviation is based on three technical replicates. j, Long-term colony formation assay in PC9 WT and METTL7A KO cells stained with crystal violet at the indicated time points during chronic (1 μM) osimertinib treatment. k, Quantification of 2j. Error bars represent standard deviation between three biological replicates. l, Colony formation assay of PC9 WT, METTL7A KO, and METTL7A rescue cells treated with increased doses of osimertinib (0.1 to 1 μM) for 5 weeks. METTL7A (M7A) rescue cells were derived by overexpressing METTL7A in the KO background. m, Quantification of colony formation assay. Error bars represent standard deviation between biological triplicates. Significance determined by unpaired t-test. n, Crystal violet assay performed in shCTL or shMETTL7A BT474 breast cancer cells treated with or without trastuzumab. o, Quantification of (n). Error bars represent standard deviation between biological triplicates. Significance determined by unpaired t-test.
Main Fig. 3.
Main Fig. 3.. METTL7A binds to amplified oncogenes.
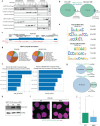
a, Immunofluorescence in PC9 and HCC827 cells expressing MYC-tagged METTL7A shows increased nuclear localization of METTL7A in osimertinib-resistant cells compared to parental cells. Scale bar: 20 μm. b, 3D reconstruction of PC9 and HCC827 cells expressing MYC-tagged METTL7A. Scale bar: 5 μm. c, Quantification of (a) reveals a significant increase in the number of nuclear METTL7A foci in OR cells compared to parental cells. d, Heatmaps of METTL7A MYC-tag ChIP-seq in PC9 and HCC827 cells. Signal is separated based on peaks called in parental cells only, resistant cells only, or peaks present in both parental and resistant cells. Signal is normalized based on CPM and signal from input. e, CTCF signal is enriched over METTL7A peaks. Signal is normalized by counts per million (CPM). METTL7A peaks significantly intersect CTCF peaks (p < 2 × 10⁻¹⁰, Fisher’s exact test). f, Colony formation assays in parental cells treated with or without osimertinib. Colony formation assays were performed in METTL7A KO cells with reconstituted METTL7A WT or K86A (or empty vector control). g, Quantification of (f). Error bars represent standard deviation between biological triplicates. Significance determined by unpaired t-test. h, MYC-tag ChIP-seq reveals a depletion of signal upon overexpression of M7A-FLAG-MYC K86A mutant, similar to ChIP in cells overexpressing a FLAG-MYC empty vector. Mean ChIP signal between biological replicates is shown. Signal is normalized to input.
Main Fig. 4.
Main Fig. 4.. METTL7A primes chromatin via recruitment of cohesin components.
a, Schematic of PC9 cell line model of acquired osimertinib resistance. Cells emerge from a quiescent, drug-tolerant persister (DTP) state before entering a proliferative resistant state. Time points selected for genomics experiments are highlighted in red. b, PCA plots of H3K27ac and RAD21 CUT&RUN bigWig signal shows that METTL7A KO cells treated with osimertinib fail to exit a drug-naïve-like chromatin state. Individual biological replicates are plotted. Signal is normalized based on CPM and H2A CUT&RUN signal is subtracted. c, Heatmaps of H3K27ac and RAD21 CUT&RUN signal in PC9 cells treated with and without osimertinib. Signal is centered on peaks that were lost, gained, or unchanged upon osimertinib treatment. Treatment with osimertinib is associated with gain of both H3K27ac and RAD21 peaks. Depletion of METTL7A (M7A) results in reduced H3K27ac and RAD21 binding, resembling the drug-naïve chromatin state. d, PDS5A signal is enriched over METTL7A peaks compared to peaks shuffled over the genome. Significance calculated via Fisher’s exact test (p < 2 × 10⁻¹⁰). e, RAD21 signal is enriched over METTL7A peaks compared to randomly shuffled peaks. Significance calculated via Fisher’s exact test (p < 2 × 10⁻¹⁰). f, Heatmaps of PDS5A CUT&RUN data in PC9 METTL7A WT and KO cells treated with osimertinib. Signal is centered on peaks that were lost, gained, or unchanged upon METTL7A KO. CUT&RUN signal is normalized by CPM and H2A signal is subtracted. Mean bigWig signal between two biological replicates is shown. g, TOP2B CUT&RUN shows an increase in TOP2B intensity in WT cells treated with osi (red box), which is depleted upon METTL7A KO. CUT&RUN signal is normalized by E. coli spike-in and CPM. Mean bigWig signal between two biological replicates is shown. h-i, TOP2B signal is enriched over H3K27ac (h) and RAD21 (i) peaks gained in WT cells treated with osimertinib. TOP2B signal is depleted in METTL7A KO cells treated with osi to levels similar to untreated WT cells.
Main Fig. 5.
Main Fig. 5.. METTL7A regulates chromatin architecture.
a, Schematic of chromosome 22 chromatin tracing. After initial primary probe hybridization to 27 TADs along Chr22, unique secondary probes that bind to primaries for each TAD are sequentially hybridized, imaged, and bleached. b, Chr22 tracing reveals increased inter-TAD interaction in wildtype cells treated with osimertinib. In METTL7A KO cells, this gain of inter-TAD contacts is absent. c, Compartment score profiles of wildtype and METTL7A KO cells treated with or without osimertinib for 6–8 weeks. d, Bar chart showing the WGS coverage (RPKM) in PC9-OR cells within each locus targeted by Chr22 TAD probes and the METTL7A peak density within each TAD based on METTL7A ChIP-seq analysis. e, Proposed model of the role of METTL7A during the acquisition of osimertinib resistance. We propose that METTL7A is upregulated as cells acquire resistance to osimertinib. METTL7A localizes to the nucleus, where it binds to amplified oncogenes and affects chromatin architecture via PDS5A-mediated cohesin recruitment, which “primes” these loci for future gene amplification.

References

    1. Nukaga S. et al. Amplification of EGFR Wild-Type Alleles in Non–Small Cell Lung Cancer Cells Confers Acquired Resistance to Mutation-Selective EGFR Tyrosine Kinase Inhibitors. Cancer Res. 77, 2078–2089 (2017). - PubMed
    1. Chmielecki J. et al. Analysis of acquired resistance mechanisms to osimertinib in patients with EGFR-mutated advanced non-small cell lung cancer from the AURA3 trial. Nat. Commun. 14, 1071 (2023). - PMC - PubMed
    1. Sequist L. V. et al. Genotypic and Histological Evolution of Lung Cancers Acquiring Resistance to EGFR Inhibitors. Sci. Transl. Med. 3, 75ra26 (2011). - PMC - PubMed
    1. Engelman J. A. et al. MET Amplification Leads to Gefitinib Resistance in Lung Cancer by Activating ERBB3 Signaling. Science 316, 1039–1043 (2007). - PubMed
    1. Cappuzzo F. et al. MET increased gene copy number and primary resistance to gefitinib therapy in non-small-cell lung cancer patients. Ann. Oncol. 20, 298–304 (2009). - PMC - PubMed

Publication types

LinkOut - more resources