[Preprint]. 2025 Jan 28:2025.01.28.635360.
doi: 10.1101/2025.01.28.635360.

Molecular determinants of RNase MRP specificity and function

Affiliations

Molecular determinants of RNase MRP specificity and function

Eric M Smith et al. bioRxiv. .

Abstract

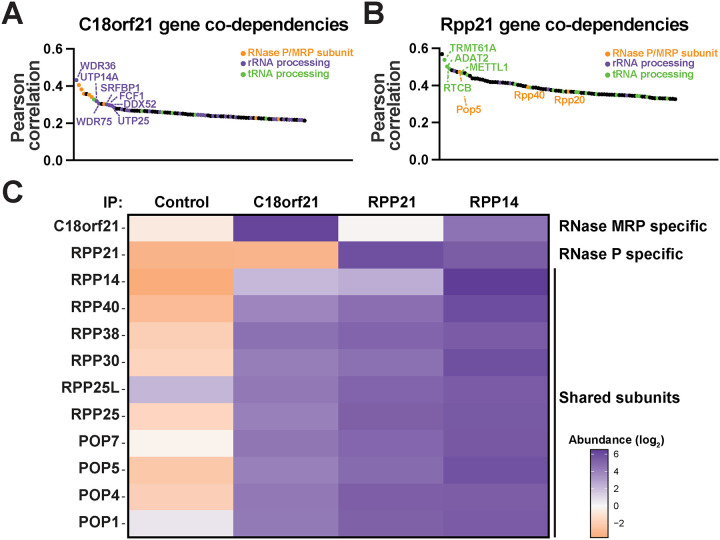
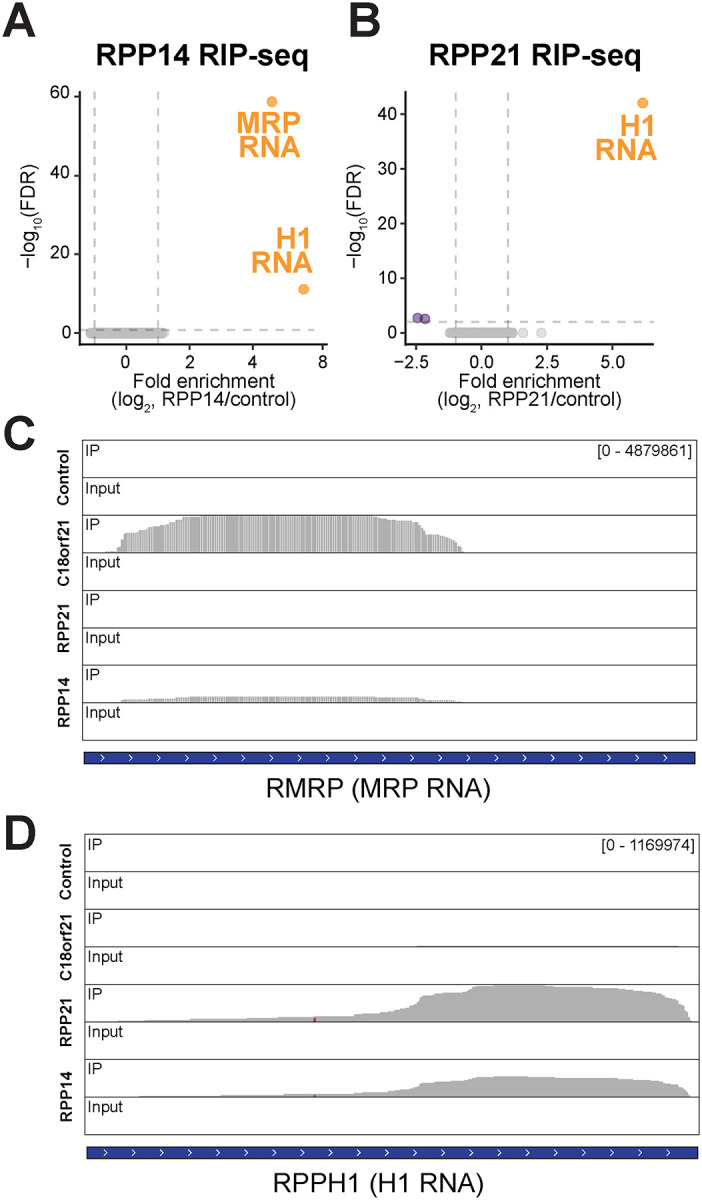
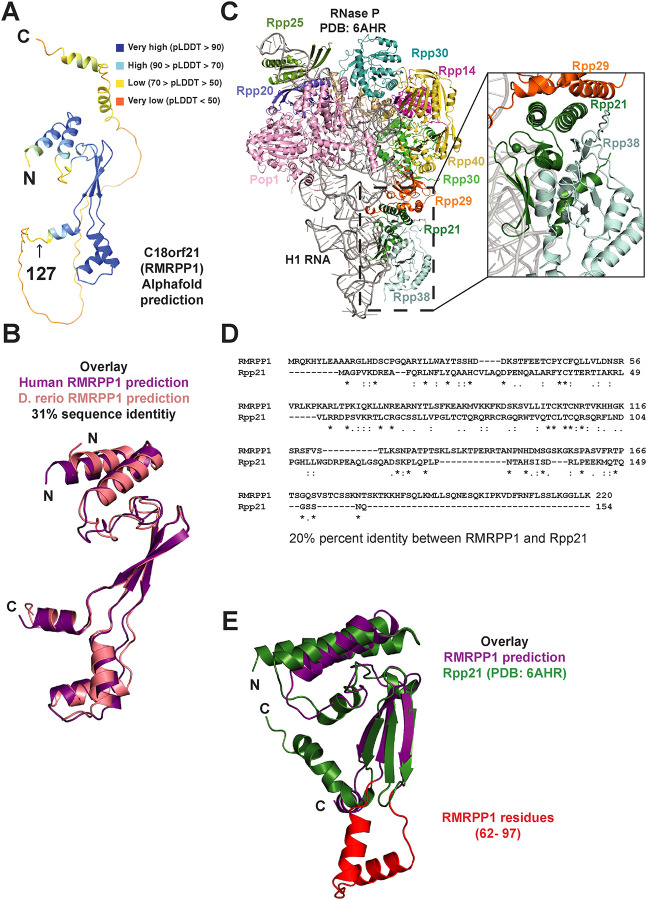
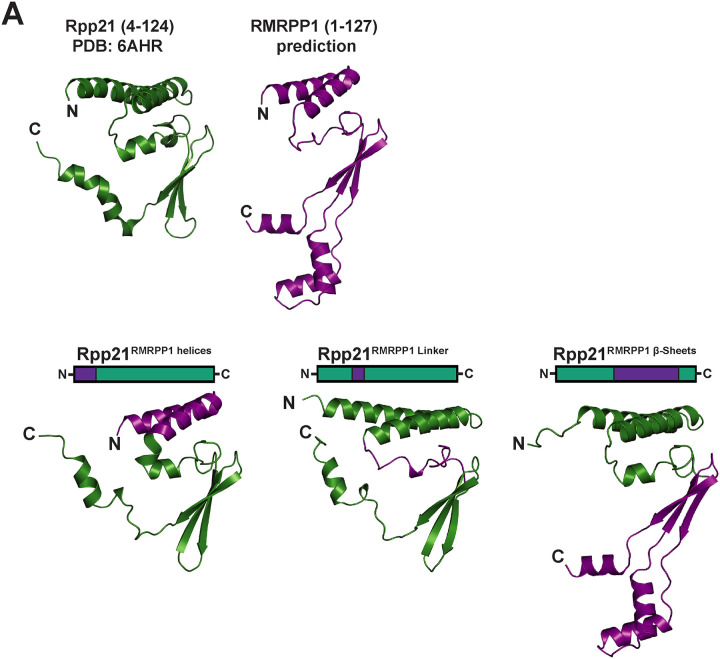
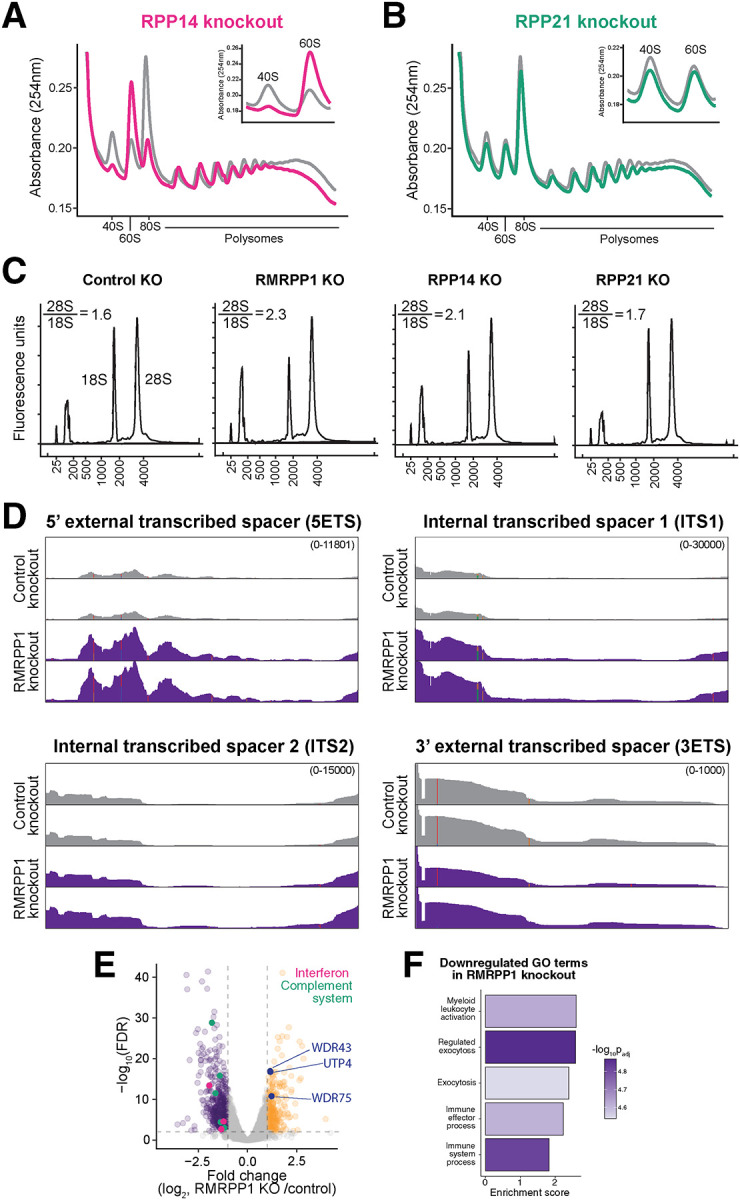
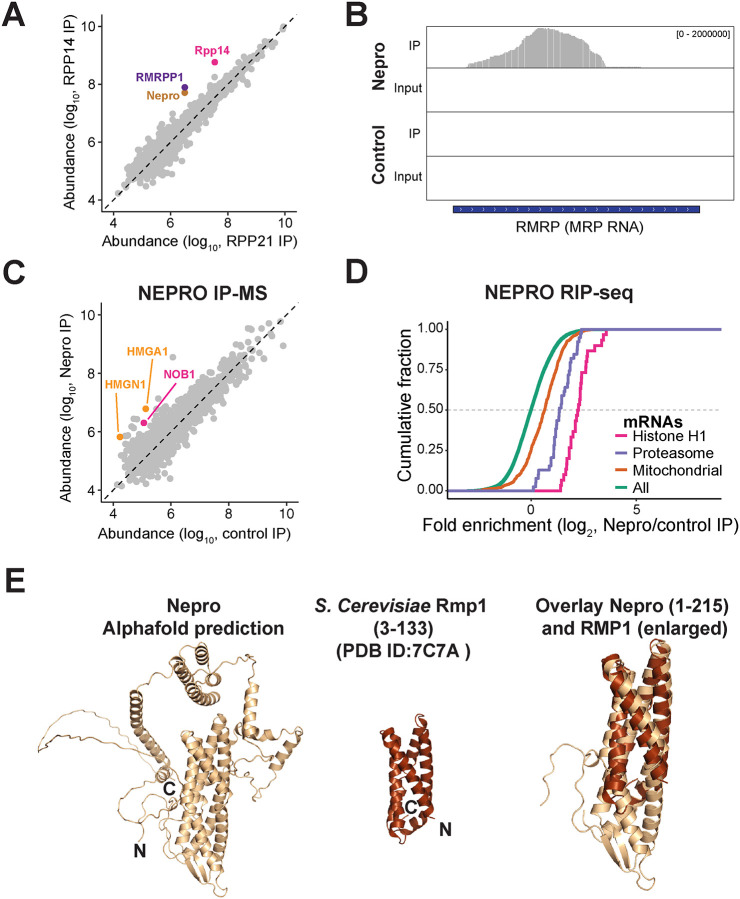
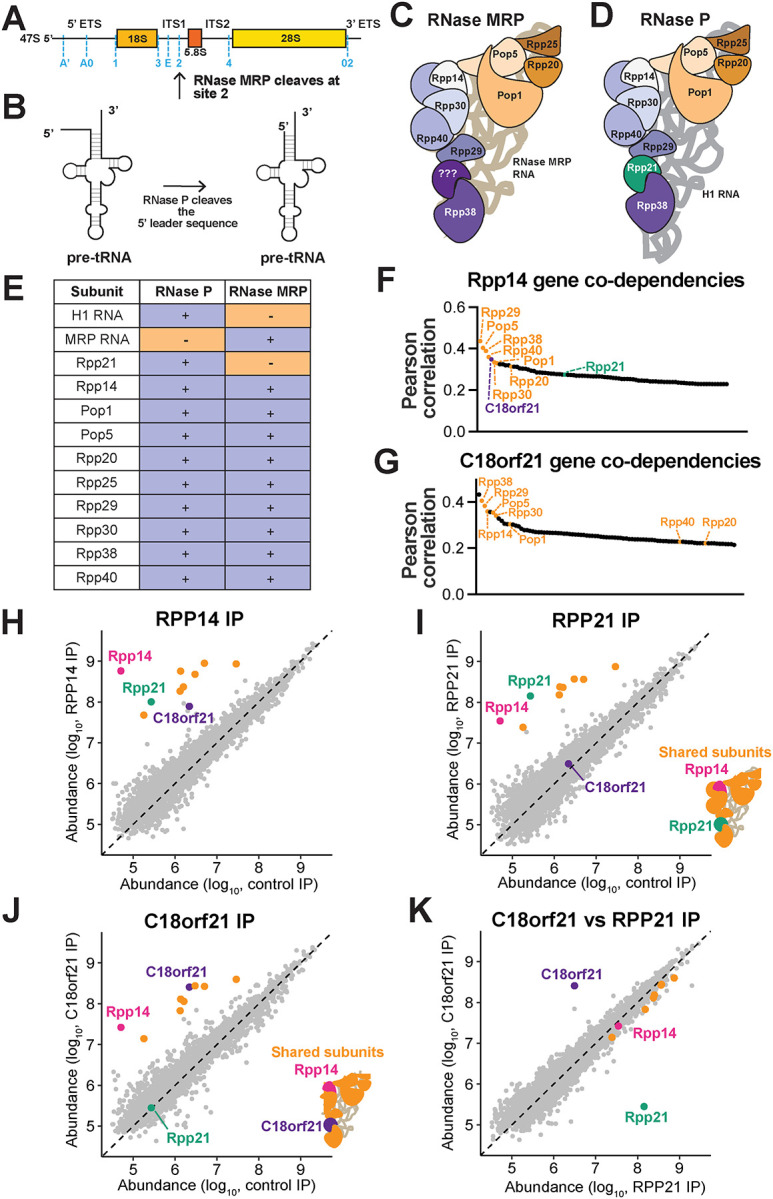
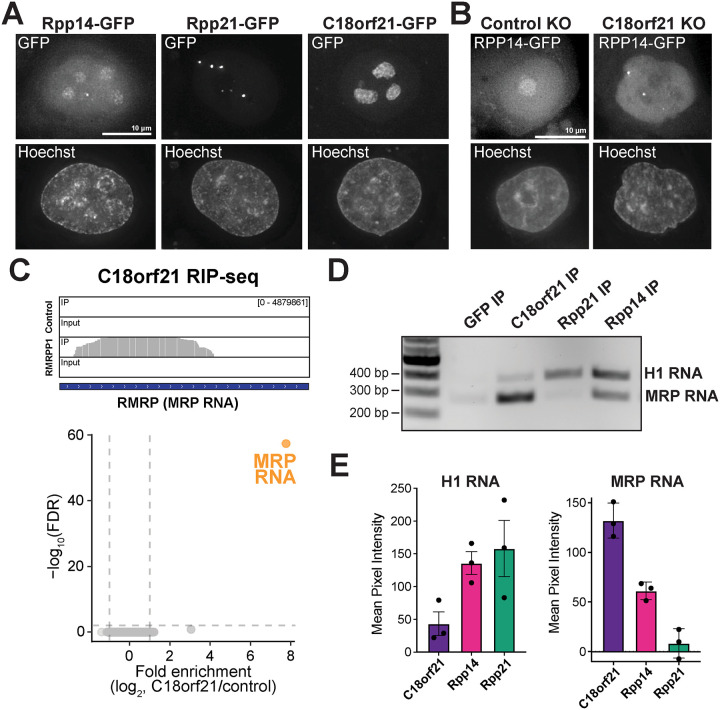
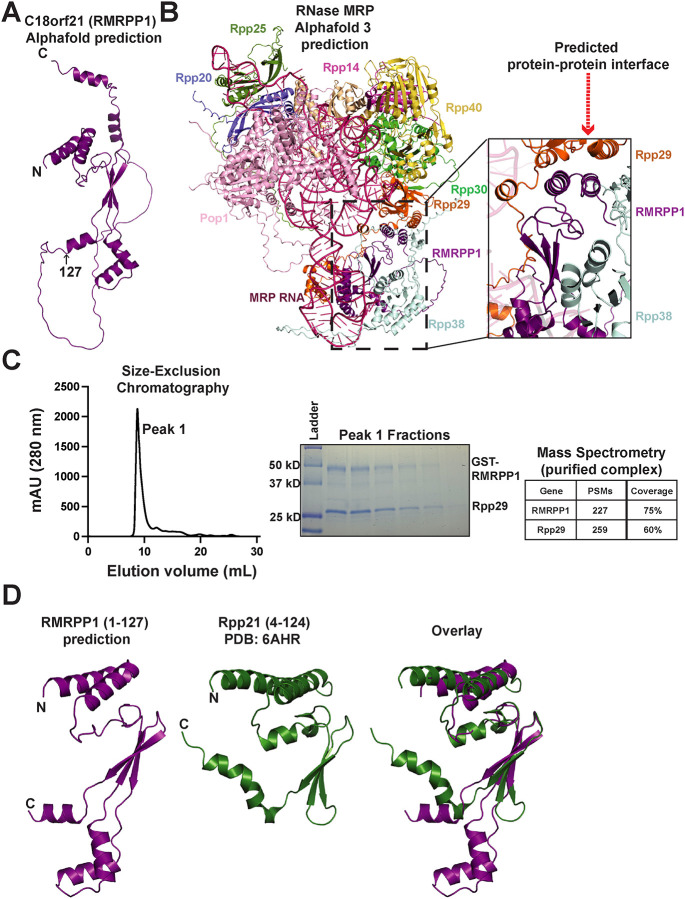
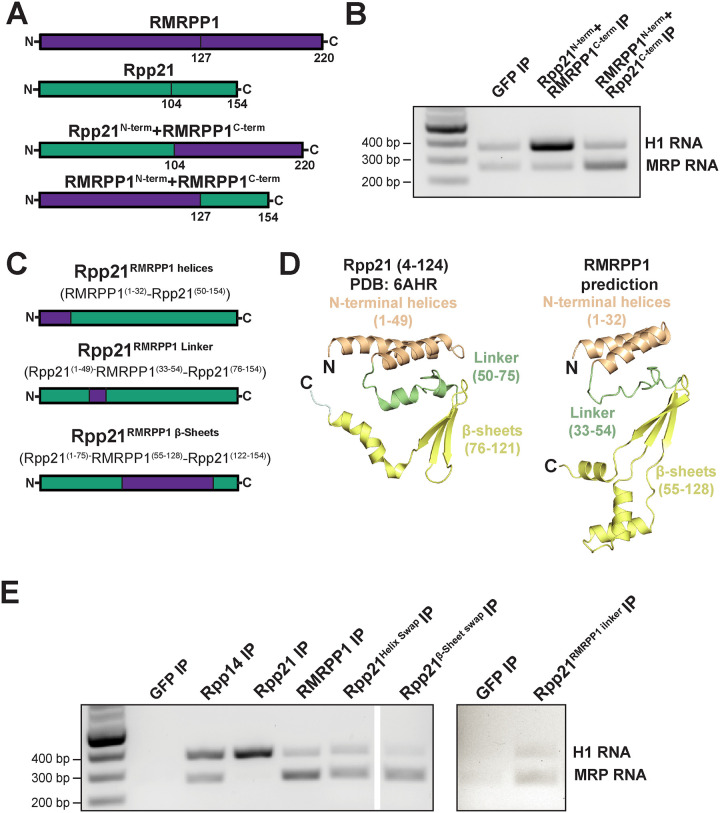
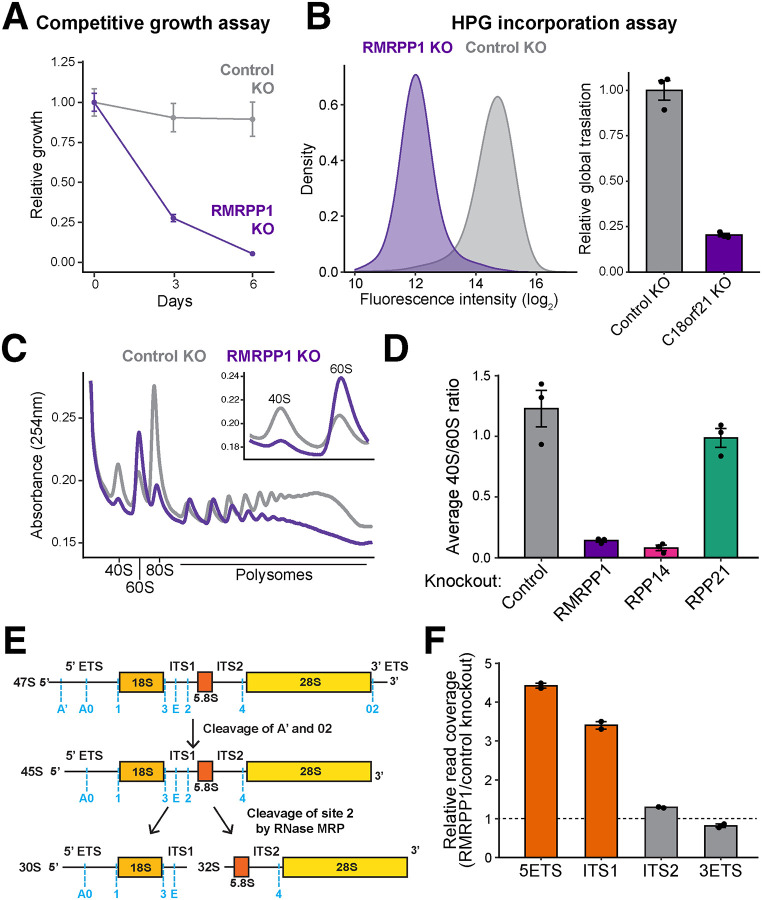
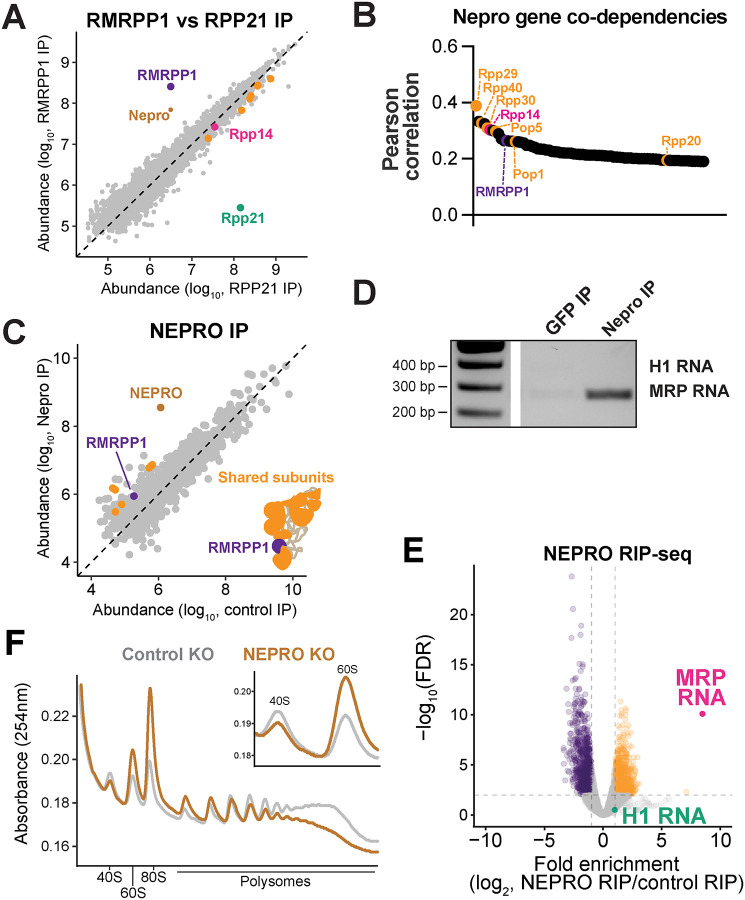
RNase MRP and RNase P are evolutionarily related complexes that facilitate rRNA and tRNA biogenesis, respectively. The two enzymes share nearly all protein subunits and have evolutionarily related catalytic RNAs. Notably, RNase P includes a unique subunit, Rpp21, whereas no RNase MRP-specific proteins have been found in humans, limiting molecular analyses of RNase MRP function. Here, we identify the RNase MRP-specific protein, C18orf21/RMRPP1. RMRPP1 and Rpp21 display significant structural homology, but we identify specific regions that drive interactions with their respective complexes. Additionally, we reveal that RNase MRP is required for 40S, but not 60S, ribosome biogenesis uncovering an alternative pathway for ribosome assembly. Finally, we identify Nepro as an essential rRNA processing factor that associates with the RNase MRP complex. Together, our findings elucidate the molecular determinants of RNase MRP function and underscore its critical role in ribosome biogenesis.


Conflict of interest statement

Declaration of interests The authors declare no competing interests.

Figures

Extended Data Figure 1.
(A) A waterfall plot showing the genes with the highest Pearson correlation of CRISPR-Cas9 based targeting effect scores to C18orf21 in the Depmap database. The shared RNase P and MRP components are shown in orange. Genes involved in rRNA processing are shown in cyan and genes involved in tRNA processing are shown in green. (B) A waterfall plot showing the genes with the highest Pearson correlation of CRISPR-Cas9 based targeting effect scores to Rpp21 in the Depmap database. The shared RNase P and MRP components are shown in orange. Genes involved in rRNA processing are shown in cyan and genes involved in tRNA processing are shown in green. (C) A heat map showing the scaled relative precursor ion abundances of each RNase P/MRP component immunoprecipitated from cell lines ectopically expressing the indicated GFP tagged construct.
Extended Data Figure 2.
(A) A graph showing the Log10 False discovery rate (FDR) on the Y-axis and fold enrichment on the X-axis obtained from the indicated ribonucleoprotein-immunoprecipitation (RIP) RNA sequencing experiments performed in duplicate. (B) A graph showing the Log10 False discovery rate (FDR) on the Y-axis and fold enrichment on the X-axis obtained from ribonucleoprotein-immunoprecipitation (RIP) RNA sequencing experiments performed in duplicate. (C) RNA-sequencing coverage plots that display the RMRP reads from the RMRPP1, Rpp14, or Rpp21 immunoprecipitations. The plot for the RMRP reads for RMRPP1 and control cells is duplicated here from figure 3C to allow for comparison between the reads obtained from these immunoprecipitations and the reads obtained from the immunoprecipitations of Rpp14 and Rpp21. (D) RNA-sequencing coverage plots that display the RPPH1 reads from the RMRPP1, Rpp14, or Rpp21 immunoprecipitations.
Extended Data Figure 3.
(A) The predicted structure of RMRPP1 shown in a cartoon representation. The structure is colored by the predicted local distance difference test (pLDDT) confidence score acquired from the AlphaFold prediction. (B) An overlay of the predicted structures of RMRPP1 from human (deep purple) and from Danio Rerio (Salmon). (C) A cartoon representation of the solved structure of human RNase P PDB ID: 6AHR. Pop5 is shown in wheat, Pop1 is shown in light pink, Rpp40 is shown in yellow orange, Rpp38 is shown in light blue, Rpp30 is shown in teal and green, Rpp29 is shown in orange, Rpp25 is shown in split pea green, Rpp20 is shown in slate blue, Rpp21 is shown in forest green, Rpp14 is shown in magenta, and H1 RNA is shown in grey. The magnified view to the right of the structure highlights the contacts between Rpp21 and Rpp29. (D) Sequence alignment of human RMRPP1 and human Rpp21 performed in Clustal omega. (E) An overlay of the predicted structure of RMRPP1 (deep purple) and the solved structure of human Rpp21 (Forest green, PDB ID: 6AHR). Residues 62–97 of RMRPP1 are highlighted in red to accentuate the difference in structure between RMRPP1 and Rpp21.
Extended Data Figure 4.
(A) Structural predictions for each chimeric construct used in Figure 4. Structural elements taken from RMRPP1 are shown in purple and structural elements taken from Rpp21 are shown in green. Each prediction was done with the full-length construct, for simplicity, only the conserved N-terminal domain is depicted.
Extended Data Figure 5.
(A) Representative polysome profile obtained from the fractionation of cell lysates obtained from Rpp14 knockout cells. The inset in the top right is zoomed in to highlight the 40S to 60S ribosome ratio. (B) Representative polysome profile obtained from the fractionation of cell lysates obtained from Rpp21 knockout cells. The inset in the top right is zoomed in to highlight the 40S to 60S ribosome ratio. (C) Representative bioanalyzer traces obtained from RNA isolated from control, RMRPP1, Rpp21, or Rpp14 knockout cells. Ratios of 28S:18S were obtained by integrating each peak in the bioanalyzer trace. (D) RNA-sequencing coverage plots that display reads for specific regions of the 45S rRNA from the RMRPP1 knockout cells or control knockout cells. (E) Volcano plot showing the changes in gene expression in RMRPP1 knockout compared to control knockout cells. Genes with FDR < 0.01 and a fold change > 2 were called as significant. (F) Gene set enrichment analysis of RMRPP1 knockout cells to identify gene sets that are downregulated upon RMRPP1 knockout.
Extended Data Figure 6.
(A) A Scatter plot showing the abundance of the proteins detected in the indicated immunoprecipitation-mass spectrometry experiments. Rpp14 is shown in pink, RMRPP1 is highlighted in purple, and Nepro is highlighted in brown. (B) RNA-sequencing coverage plots that display reads for RNase MRP RNA. (C) The same scatter plot that is shown in Figure 6C highlighting non-RNase MRP/P proteins that were immunoprecipitated by Nepro. (D) Plot showing the cumulative fraction on the Y-axis and the log2 Fold enrichment on the X-axis of families of mRNA species obtained from ribonucleoprotein-immunoprecipitation (RIP) RNA sequencing experiments. Mitochondrial gene annotations were taken from MitoCarta3.0. (E) A cartoon representation of the predicted structure of Nepro that was created using AlphaFold 3 is depicted in wheat and the solved structure of S. cerevisae Rmp1 (PDB ID: 7C7A) shown in brown. An overlay of the structurally similar N-terminal helical bundle is shown to the right.
Figure 1.
Figure 1.. C18orf21 is associated with the shared subunits of the RNase P and RNase MRP complexes.
(A) A schematic of the 47S rRNA transcript. Endonucleolytic cleavage sites in the externally and internally transcribed spaces (ETS and ITS) are marked in blue. RNase MRP cleaves at site 2 in ITS1. (B) A schematic of a precursor tRNA before and after the cleavage of the 5’ leader sequence by RNase P. (C) A cartoon representation of RNase MRP. (D) A cartoon representation of RNase P. (E) A table showing which subunits are found in either the RNase P complex, the RNase MRP complex, or in both complexes. (F) A waterfall plot showing the genes with the highest Pearson correlation coefficients to Rpp14. These coefficients are acquired from the CRISPR-Cas9 targeting effect scores in the Depmap database. The shared RNase P and MRP components are shown in orange, C18orf21 is shown in purple, and Rpp21 is shown in green. (G) A waterfall plot showing the genes with the highest Pearson correlation of CRISPR-Cas9 based targeting effect scores to C18orf21 in the Depmap database. The shared RNase P and MRP components are shown in orange. (H-K) Scatter plots showing the abundance of the proteins detected in the indicated immunoprecipitation-mass spectrometry experiments. The shared components of the RNase P/MRP complexes are highlighted in orange, except Rpp14 which is shown in pink. C18orf21 is highlighted in purple and Rpp21 is highlighted in green.
Figure 2.
Figure 2.. C18orf21 (RMRPP1) is a subunit of the RNase MRP complex.
(A) Representative Z-projected images taken by live cell imaging cells the ectopically express C-terminally GFP tagged versions of RMRPP1, Rpp21, or Rpp14. Images were deconvolved and each set of images is scaled differently to highlight localization of each component. (B) Representative Z-projected images taken by live imaging cells that ectopically express C-terminally GFP tagged Rpp14 and are targeted with either a control guide (AAVS1 locus) or a guide targeting RMRPP1. Images were deconvolved and each image is scaled differently to highlight the differences in localization that were observed. (C) Top: RNA-sequencing read coverage plots that display the RMRP reads that were enriched in the RMRPP1 immunoprecipitation. Bottom: A graph showing the Log10 False discovery rate (FDR) on the Y-axis and fold enrichment on the X-axis obtained from ribonucleoprotein-immunoprecipitation (RIP) RNA sequencing experiments performed in duplicate. (D) Representative agarose gel stained with ethidium bromide showing the results of ribonucleoprotein-immunoprecipitation RT-PCR experiments. (E) Quantitation of the mean pixel intensity of either the intensity of the H1 band (left) or RNase MRP RNA band (right) with the GFP RIP RT-PCR background signal subtracted. The error bars represent the standard error of the mean from three replicates.
Figure 3.
Figure 3.. RMRPP1 is predicted to have structural homology with Rpp21.
(A) Cartoon representation of the structure of RMRPP1 (deep purple) predicted by Alphafold. (B) A cartoon representation of the predicted structure of human RNase MRP that was created using AlphaFold 3. Pop5 is shown in wheat, Pop1 is shown in light pink, Rpp40 is shown in yellow orange, Rpp38 is shown in light blue, Rpp30 is shown in green, Rpp29 is shown in orange, Rpp25 is shown in split pea green, Rpp20 is shown in slate blue, Rpp14 is shown in magenta, RMRPP1 is shown in deep purple and MRP RNA is shown in hot pink. The magnified view to the right of the full structure highlights the predicted contacts between RMRPP1 and Rpp29. (C) A representative chromatogram resulting from passing the RMRPP1-Rpp29 complex over a Superdex S200-increase column. A coomassie stained SDS-PAGE gel that shows the peak fractions eluted from the Superdex S200-increase column. A table showing the peptide spectrum matches (PSMs) and coverage of RMRPP1 and Rpp29 obtained from injecting the purified complex on the LC-MS. (D) A cartoon representation of the predicted structure of RMRPP1 (residues 1–127, deep purple), Rpp21 (residues 4–124, forest green) from PDB ID: 6AHR, and an overlay of the two structures.
Figure 4.
Figure 4.. Specificity for RNase MRP or RNase P are dictated by the N-termini of Rpp21 and RMRPP1.
(A) Diagram depicting the chimeric constructs used in B. (B) Representative agarose gel stained with ethidium bromide showing the results of ribonucleoprotein-immunoprecipitation RT-PCR experiments. (C) Diagram depicting the chimeric constructs used in D. (D) A cartoon representation of the solved structure of human Rpp21 PDB ID: (6AHR) and the predicted structure of RMRPP1. Each of the three shared structural features are depicted in a different color. The N-terminal helices are shown in wheat, the linker is shown in pale green, and the beta-sheets are shown in yellow. (E) Representative agarose gel stained with ethidium bromide showing the results of ribonucleoprotein-immunoprecipitation RT-PCR experiments.
Figure 5.
Figure 5.. Loss of RMRPP1 leads to defects in ribosome biogenesis.
(A) A plot showing the relative growth (Y-axis) of either RMRPP1 knockout cells (purple) or control knockout cells (grey) relative to control cells over the course of time (X-axis). (B) A plot generated by measuring the fluorescence intensity (X-axis) of HPG incorporated cells by flow cytometry (Left). Quantitation of average HPG signal in each condition. The error bars represent standard error of the mean from three replicates. (C) An overlay of the polysome profiles obtained from the fractionation of cell lysates separated on a 10 – 50% sucrose gradient. The inset on the top right shows a magnified view of the 40S and 60S traces. (D) Quantification of the ratio of 40S to 60S ribosomes obtained from polysome gradients with the indicated gene knocked out by CRISPR-Cas9 targeting. The error bars represent the standard error of the mean from three biological replicates. (E) Schematic outline of the primary rRNA maturation pathway in HeLa cells. (F) Quantitation of RNA sequencing data showing the relative read coverage of different domains of the 45S rRNA transcript obtained from RNA isolated from RMRPP1 knockout cells and AAVS1 control knockout cells. The error bars represent the standard error of the mean from 2 replicates.
Figure 6.
Figure 6.. Nepro is an rRNA processing factor that associates with RNase MRP.
(A) A Scatter plot showing the abundance of the proteins detected in the indicated immunoprecipitation-mass spectrometry experiments. The shared components of the RNase P/MRP complexes are highlighted in orange, except Rpp14 which is shown in pink. RMRPP1 is highlighted in purple, Nepro is highlighted in brown, and Rpp21 is highlighted in green. (B) A waterfall plot showing the genes with the highest Pearson correlation of CRISPR-Cas9 based targeting effect scores to Nepro in the Depmap database. The shared RNase P and MRP components are shown in orange, except Rpp14 is shown in pink, and RMRPP1 is shown in purple. (C) A Scatter plot showing the abundance of the proteins detected in the indicated immunoprecipitation-mass spectrometry experiments. The shared components of the RNase P/MRP complexes are highlighted in orange. RMRPP1 is highlighted in purple, and Nepro is highlighted in brown. Peptides mapping to Rpp21 were not identified in the Nepro IP-MS experiments. (D) Representative agarose gel stained with ethidium bromide showing the results of ribonucleoprotein-immunoprecipitation RT-PCR experiments performed in triplicate. (E) A graph showing the Log10 False discovery rate (FDR) on the Y-axis and fold enrichment on the X-axis obtained from ribonucleoprotein-immunoprecipitation (RIP) RNA sequencing experiments. (F) An overlay of the polysome profiles obtained from the fractionation of cell lysates separated on a 10 – 50% sucrose gradient. The Nepro profile is depicted in brown and the control profile is depicted in gray. The inset on the top right shows a magnified view of the 40S and 60S traces.

Similar articles

References

    1. Blobel G. & Potter V. R. Studies on free and membrane-bound ribosomes in rat liver. I. Distribution as related to total cellular RNA. J Mol Biol 26, 279–292, doi:10.1016/0022-2836(67)90297-5 (1967). - DOI - PubMed
    1. Palazzo A. F. & Lee E. S. Non-coding RNA: what is functional and what is junk? Front Genet 6, 2, doi:10.3389/fgene.2015.00002 (2015). - DOI - PMC - PubMed
    1. Henras A. K., Plisson-Chastang C., O’Donohue M. F., Chakraborty A. & Gleizes P. E. An overview of pre-ribosomal RNA processing in eukaryotes. Wiley Interdiscip Rev RNA 6, 225–242, doi:10.1002/wrna.1269 (2015). - DOI - PMC - PubMed
    1. Bohnsack K. E. & Bohnsack M. T. Uncovering the assembly pathway of human ribosomes and its emerging links to disease. EMBO J 38, e100278, doi:10.15252/embj.2018100278 (2019). - DOI - PMC - PubMed
    1. Gerstberger S. et al. The Conserved RNA Exonuclease Rexo5 Is Required for 3’ End Maturation of 28S rRNA, 5S rRNA, and snoRNAs. Cell Rep 21, 758–772, doi:10.1016/j.celrep.2017.09.067 (2017). - DOI - PMC - PubMed

Publication types

LinkOut - more resources