[Preprint]. 2025 Jan 29:2025.01.29.635439.
doi: 10.1101/2025.01.29.635439.

Clostridioides difficile major toxins remodel the intestinal epithelia, affecting spore adherence/internalization into intestinal tissue and their association with gut vitronectin

Affiliations

Clostridioides difficile major toxins remodel the intestinal epithelia, affecting spore adherence/internalization into intestinal tissue and their association with gut vitronectin

Pablo Castro-Cordova et al. bioRxiv. .

Abstract

The most common cause of healthcare-associated diarrhea and colitis in the U.S., is Clostridioides difficile, a spore-forming pathogen. Two toxins, TcdA and TcdB, are major virulence factors essential for disease manifestations, while C. difficile spores are essential for disease transmission and recurrence. Both toxins cause major damage to the epithelial barrier, trigger massive inflammation, and reshape the microbiome and metabolic composition, facilitating C. difficile colonization. C. difficile spores, essential for transmission and recurrence of the disease, persist adhered and internalized in the intestinal epithelia. Studies have suggested that toxin-neutralization in combination with antibiotic during CDI treatment in humans significantly reduces disease recurrence, suggesting a link between toxin-mediated damage and spore persistence. Here, we show that TcdA/TcdB-intoxication of intestinal epithelial Caco-2 cells leads to remodeling of accessible levels of fibronectin (Fn) and vitronectin (Vn) and their cognate alpha-integrin subunits. While TcdB-intoxication of intestinal tissue had no impact in accessible levels of Fn and Vn, but significantly increased levels of intracellular Vn. We observed that Fn and Vn released to the supernatant readily bind to C. difficile spores in vitro, while TcdB-intoxication of intestinal tissue led to increased association of C. difficile spores with gut Vn. Toxin-intoxication of the intestinal tissue also contributes to increased adherence and internalization of C. difficile spores. However, TcdB-intoxicated ligated loops infected of mice treated with Bezlotoxumanb (monoclonal anti-TcdB antibodies) did not prevent TcdB-mediated increased spore adherence and internalization into intestinal tissue. This study highlights the importance of studying the impact of C. difficile toxins of host tissues has in C. difficile interaction with host surfaces that may contribute to increased persistence and disease recurrence.


Figures

Fig. 1 |
Fig. 1 |. Effect of TcdA/TcdB intoxication of intestinal epithelial Caco-2 cells in redistribution of Fibronectin and Vitronectin.
Differentiated Caco-2 cells intoxicated with TcdA and TcdB for 3, 6, or 8h in DMEM FBS-free. As a control, cells were treated with DMEM FBS-free. Unpermeabilized cells were stained for accessible Fibronectin or Vitronectin (acc Fn or acc Vn; green), permeabilized, and stained total Fibronectin or Vitronectin (total Fn or total Vn; red) and nuclei (blue). a, b Representative confocal microscopy images 3D projection of control cells (left) and intoxicated cells for 8h (right) immunostained for acc Fn or Vn and total Fn or Vn, below a magnified slide (XY), and the orthogonal view (XZ). Relative fluorescence intensity measured as the sum of raw intensity density/area for each z-step of accFn and total Fn, its abundance in the c apical side or d in the basal side of the cell; in the same way, the relative fluorescence intensity of Vn, its abundance in the e apical side and f the basal side of the cell. g, immunoblotting of anti-nonglucosylated Rac1 and total Rac1 of cell lysates of differentiated Caco-2 cells intoxicated with TcdA and TcdB for 3, 6, or 8 h. Nonglucosylated Rac1 was evaluated with corresponding antibodies, then the membrane was stripped, and subsequently tested for total Rac1. Western blotting is representative of 3 independent experiments. Controls were set at 100%. Error bars indicate the mean ± SEM from at least 9 fields (n = 3). Statistical analysis was performed by Two-Way ANOVA post-Bonferroni; ns, p > 0.05; * p < 0.05. Scale bar, top panels 20μm; bottom panels 5μm.
Fig. 2 |
Fig. 2 |. TcdA and TcdB increase accessible α5 and αV but no β1 integrins in intestinal epithelial cells.
Differentiated Caco-2 cells intoxicated with 600pM of TcdA and TcdB for 8h in DMEM FBS-free. As a control, cells were treated with DMEM FBS-free. Unpermeabilized cells were stained for accessible a, ɑ5 integrin; b, αV integrin, and c, β1 integrin, (shown in green), permeabilized, and stained total ɑ5, αV or β1 integrin respectively (shown in red) and F-actin (grey). a-c, Representative confocal microscopy images 3D projection of control cells (left) and intoxicated cells for 8h (right); below a magnified slide (XY), and the orthogonal view (XZ). d-i, Quantification of relative fluorescence intensity based on raw intensity density per area for each individual cell generated from the microscopy images using the 3D Surface Plotter plug-in of ImageJ. Relative fluorescence intensity measured as the sum of raw intensity density/area for each z-step of accessible and total α5 located in the d, apical, and e, basal side of the cell. Relative fluorescence intensity measured as the sum of raw intensity density/area for each z-step of accessible and total αV located in the f, apical and g, basal side of the cell. Relative fluorescence intensity measured as the sum of raw intensity density/area for each z-step of accessible and total β1 located in the h, apical, and i, basal side of the cell. Controls were set 100%. Error bars indicate the mean ± S.E.M from at least 9 fields (n = 3). Statistical analysis was performed by unpaired Student’s t test, ns, p > 0.05; * p < 0.05; ** p < 0.01. Bars, top panels 20 μm; bottom panels 5μm.
Fig. 3 |
Fig. 3 |. Effect of TcdB in the redistribution of Fibronectin and Vitronectin a ligated ileal loop mouse model.
Ileal ligated loops were intoxicated for 5 h with 0.1, 0.5, 1, or 5μg of TcdB or saline as control. Then loops were removed, washed, fixed, and subjected to immunofluorescence. Unpermeabilized tissues were stained for accessible Fibronectin or Vitronectin (acc Fn or acc Vn; green), and then permeabilized and stained total Fibronectin or Vitronectin (total Fn or total Vn; red) and F-actin (grey). a-b, Representative confocal microscopy images 3D projection of control cells (left) or intoxicated loops with 5μg TcdB (right) immunostained for accessible and total Fn or Vn; right bottom, a magnified 3D projection, next to a z-stack (XY), and then magnified orthogonal view (XZ). Quantification of c, e, accessible or d, f, total Fn or Vn fluorescence intensity per cell measured in the z-projection (sum). For acc Fn or Vn, the analyzed area was Ctrl of 170,360 μm2; 0.1 μg TcdB of 340,720 μm2; 0.5 μg TcdB of 340,720 μm2; 1 μg TcdB of 340,720 μm2 and 5 μg TcdB of 511,080 μm2. n = 3 animal per group. In scatter plots, each dot corresponds to one independent cell. Dots in colors correspond to the average of each analyzed mice/field. Error bars indicate mean or mean ± SEM. Statistical analysis was performed by unpaired Student’s t test; ns, p > 0.05; * p < 0.05; **p < 0.01; **** p < <0.0001. Scale bar 20 μm.
Fig. 4 |
Fig. 4 |. Intoxication increases association of C. difficile spores with Fn and Vn.
a-d, Differentiated Caco-2 cells were intoxicated with 600pM of TcdA and TcdB for 8h in DMEM FBS-free media. Controls include non-intoxoicated cells in DMEM FBS-free. Supernatant was collected from untreated and intoxicated cells and subsequently utilized to resuspend C. difficile spores and incubate for 1 h at 37 °C. Spores resuspended in DMEM alone were also included as a control. Spores were washed and strained for immunofluorescence anti- fibronectin and - vitronectin. a-b, Micrographs show representative phase-contrast (phase), fibronectin and vitronectin specific immunofluorescence and fluorescence intensity profiles (Fl. int.). Representative Fl. int. were provided using 3D Surface plotter function of Fiji. c-d, Quantitative analysis of the fluorescence Fl. int. of Fn and Vn in spores Fl. Int of 600 spores. Mean ± SEM are denoted. e-g, Ileal ligated loops were intoxicated with 5μg of TcdB and 5 × 10⁸ C. difficile R20291 spores for 5 h. Then loops were removed, washed, fixed, and subjected to immunofluorescence. Unpermeabilized tissues were stained for accessible Fibronectin or Vitronectin (acc Fn or acc Vn; green), and then permeabilized and stained total Fibronectin or Vitronectin (total Fn or total Vn; red) and F-actin (grey). e, g, representative 3D confocal micrograph projection reconstruction of fixed whole-mount small intestine tissue, and magnification of C. difficile spores associated with Fn or Vn. Plot profiles of fluorescence intensity of C. difficile spores (red line) and accessible Fn or Vn (green lines). f,h, quantification of spores that were positive (Fn+) or negative (Fn-) for Fn fluorescence signal in f, or positive (Vn+) or negative (Vn-) for Vn fluorescence signal in h. The average of associated and non-associated spores with f Fn or h Vn for each field. A total of ~ 500 spores were counted per mice (n = 5 per group). GRUBB’s test was performed to identify outliers, and one point was removed in Vn. Error bars indicate mean ± S.E.M. Statistical analysis was performed by two-tailed unpaired Student’s t test; ns indicates non-significant differences. Scale bar, 20 μm.
Fig. 5 |
Fig. 5 |. TcdB-intoxication increases C. difficile spore adherence and internalization to the intestinal barrier in vivo.
Intestinal loops, of approximately ~1.5 cm, were injected with 5 × 10⁸ C. difficile R20291 spores and 1 or 5 μg of TcdB for 5h (or saline alone as control). a, 3D projections of representative confocal micrographs. C. difficile spores are shown in green, and F-actin is shown in grey (fluorophores colors were digitally reassigned for a better representation). b,c, Quantification of b adhered or c internalized spots (spores) per 105 μm2 is expressed in relative values to the unintoxicated control. Controls were set 100%. GRUBB’s test was performed to identify outliers, and one point was removed in b for group intoxicated with 1 μg TcdB and in c for control group. Error bars indicate the mean ± S.E.M. Statistical analysis was performed by unpaired Mann-Whitney test, ns, indicates non- significant differences, * p < 0.05. Scale bar 100μm. n = 5 mice per group.
Fig. 6 |
Fig. 6 |. Effect of Bezlotoxumab in TcdB-intoxication induced redistribution of Fibronectin and Vitronectin in vivo.
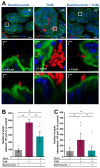
Prior to ileal surgeries intraperitoneal injection of 5mg/kg of Bezlotoxumab or saline solution was administered as indicated. Ligated loops were injected with C. difficile Spores and 5μg of TcdB or saline as control. Mice were let for recovery for 5 h before euthanasia. a,b Representative 3D confocal micrograph projection reconstruction of fixed whole-mount small intestine tissue. Unpermeabilized tissues were stained for Acc Fn or Vn shown in green, and then permeabilized and stained for total Fn or Vn shown in red, and F-actin in gray and cell DNA with Hoechst (blue), (some fluorophores colors were digitally reassigned for a better representation). Panels c,d show the fluorescence intensity immunodetected in cells for acc and total c Fn or d Vn. Nearly 2000 – 3000 cells were counted per field. Quantification of total or accessible Vn, fluorescence intensity per cell measured in the z-projection (sum). Error bars indicate mean ± S.E.M. Statistical analysis was performed by two-tailed unpaired Student’s t test, ns indicates non-significant differences; * p < 0.05; **p < 0.01; **** p < <0.0001. Colored dots represent the average normalized fluorescence intensity of each independent mice in the group. n = 5 mice per group. Scale bar, 30 μm.
Fig. 7 |
Fig. 7 |. Bezlotoxumab neutralizes TcdB- increased adherence of C. difficile spores caused by TcdB.
A) Mice were treated with an intraperitoneal injection of 5mg/kg of Bezlotoxumab or saline solution 24h prior to ileal loops surgery. Loops where then injected with 5 × 10⁸ C. difficile R20291 spores with or without 5μg of TcdB. Representative confocal micrographs of ileal loops are shown, with C. difficile spores stained in red, F-actin is shown in green, and nuclei in blue. b,c, Quantification of b adhered and c internalized spots (spores) per 105 μm2 is shown relativized to the non-intoxicated Bezlotoxumab control. GRUBB’s test was performed to identify outliers, and one point was removed in group Bezlotoxumab + spore and one in TcdB + spore. Error bars indicate the mean ± S.E.M. Statistical analysis was performed by Mann-Whitney test, ns, p > 0.05, * p < 0.05. Scale bar 20μm. n = 5 mice per group.
Fig. 8 |
Fig. 8 |. Model of C. difficile toxin-mediated spore interactions and Bezlotoxumab effects on intestinal epithelial cells.
Left panel (CDI): During C. difficile infection, toxins A and B (TcdA/TcdB) cause increased accessible (Acc) fibronectin (Fn), vitronectin (Vn), and their associated integrins (α5 and αv) on both apical and basal surfaces of intestinal epithelial cells. This leads to enhanced spore adherence and internalization, ultimately resulting in epithelial cell apoptosis. Right panel (CDI + Bezlotoxumab): Treatment with Bezlotoxumab partially neutralizes TcdB, reducing epithelial damage and spore adherence/internalization. While total Vn levels increase, total Fn levels decrease. The presence of Bezlotoxumab antibodies results in reduced spore adherence and internalization compared to untreated conditions, demonstrating partial protection against TcdB-mediated damage. Arrows indicate increased (↑) or decreased (↓) levels of proteins. A and B represent TcdA and TcdB toxins, respectively. The apical and basal sides of the epithelium are indicated.

Similar articles

References

    1. Lessa FC, Mu Y, Bamberg WM, Beldavs ZG, Dumyati GK, Dunn JR, Farley MM, Holzbauer SM, Meek JI, Phipps EC, Wilson LE, Winston LG, Cohen JA, Limbago BM, Fridkin SK, Gerding DN, McDonald LC. Burden of Clostridium difficile infection in the United States. N Engl J Med. 2015;372(9):825–34. Epub 2015/02/26. doi: 10.1056/NEJMoa1408913. - DOI - PMC - PubMed
    1. McDonald LC, Gerding DN, Johnson S, Bakken JS, Carroll KC, Coffin SE, Dubberke ER, Garey KW, Gould CV, Kelly C, Loo V, Shaklee Sammons J, Sandora TJ, Wilcox MH. Clinical Practice Guidelines for Clostridium difficile Infection in Adults and Children: 2017 Update by the Infectious Diseases Society of America (IDSA) and Society for Healthcare Epidemiology of America (SHEA). Clin Infect Dis. 2018;66(7):987–94. doi: 10.1093/cid/ciy149. - DOI - PubMed
    1. Kelly CP. Can we identify patients at high risk of recurrent Clostridium difficile infection? Clin Microbiol Infect. 2012;18 Suppl 6:21–7. doi: 10.1111/1469-0691.12046. - DOI - PubMed
    1. Zhang S, Palazuelos-Munoz S, Balsells EM, Nair H, Chit A, Kyaw MH. Cost of hospital management of Clostridium difficile infection in United States-a meta-analysis and modelling study. BMC Infect Dis. 2016;16(1):447. Epub 20160825. doi: 10.1186/s12879-016-1786-6. - DOI - PMC - PubMed
    1. Guery B, Galperine T, Barbut F. Clostridioides difficile: diagnosis and treatments. BMJ. 2019;366:l4609. Epub 2019/08/20. doi: 10.1136/bmj.l4609. - DOI - PubMed

Publication types

LinkOut - more resources