[Preprint]. 2025 Feb 8:2025.02.04.636277.
doi: 10.1101/2025.02.04.636277.

IRF7 controls spontaneous autoimmune germinal center and plasma cell checkpoints

Affiliations

IRF7 controls spontaneous autoimmune germinal center and plasma cell checkpoints

Adam J Fike et al. bioRxiv. .

Update in

Abstract

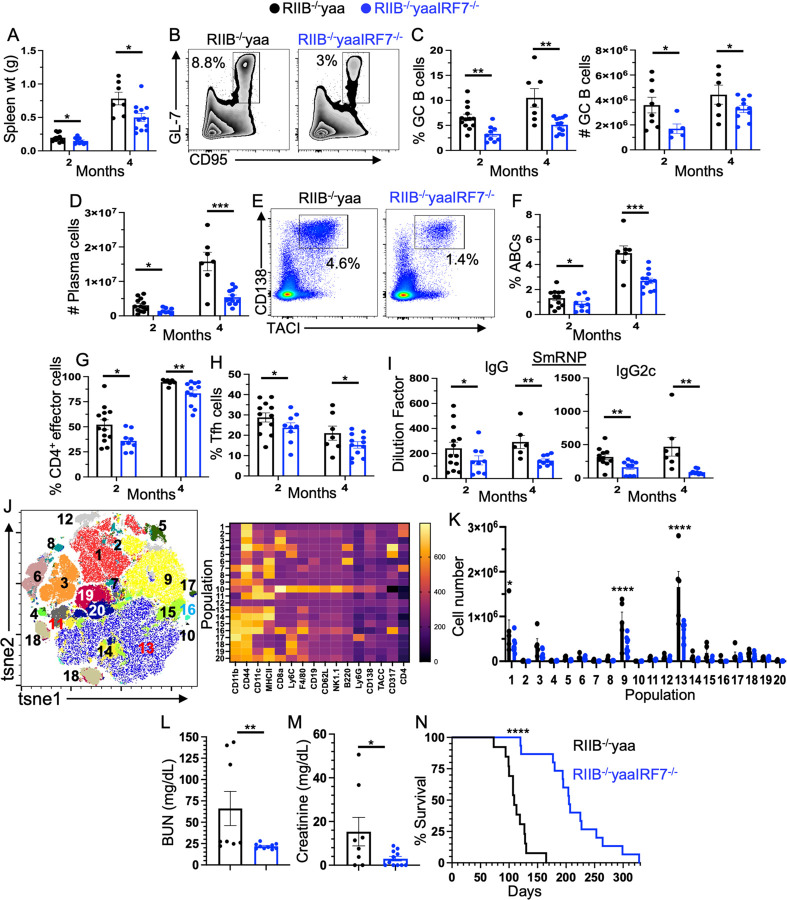
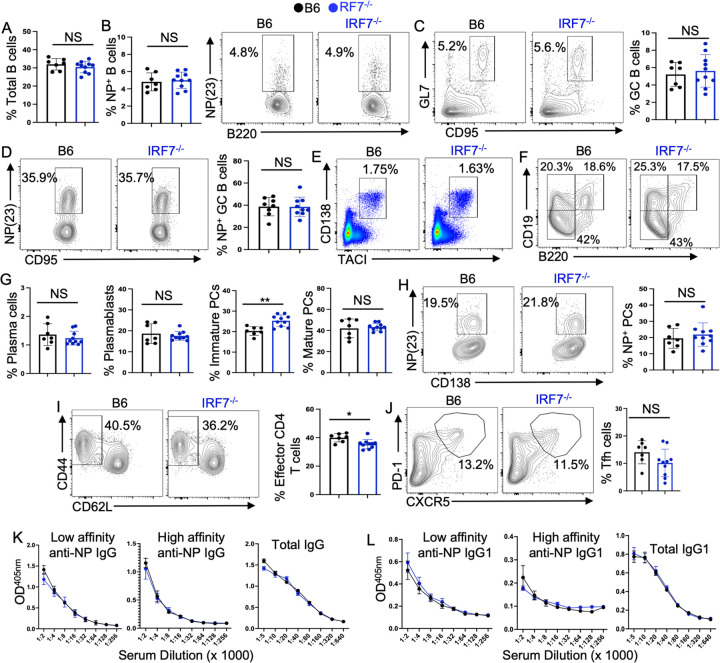
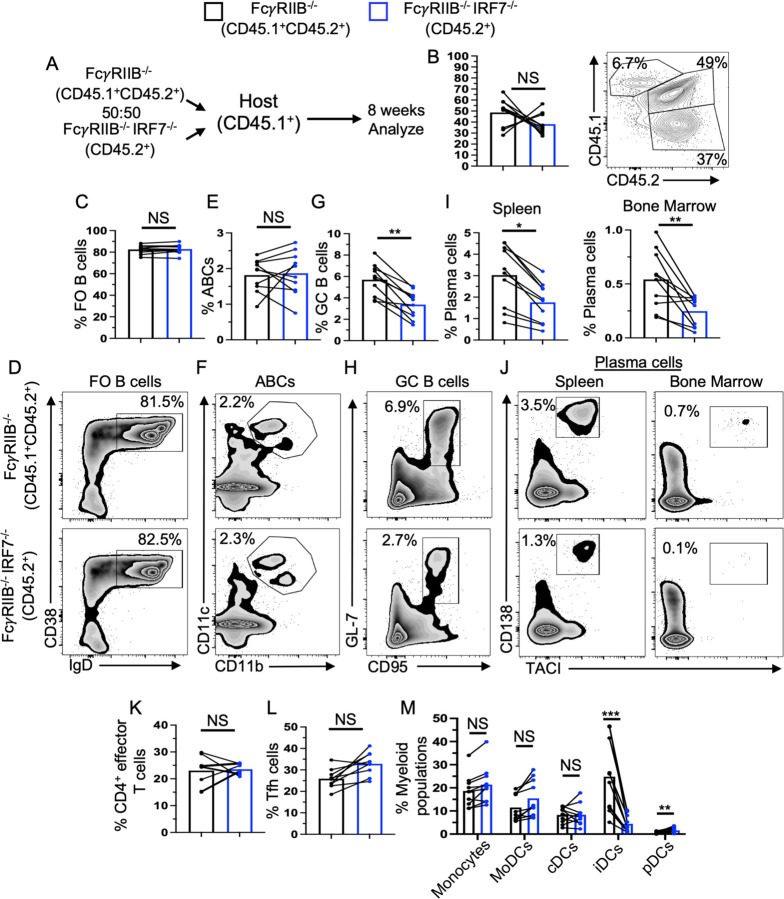
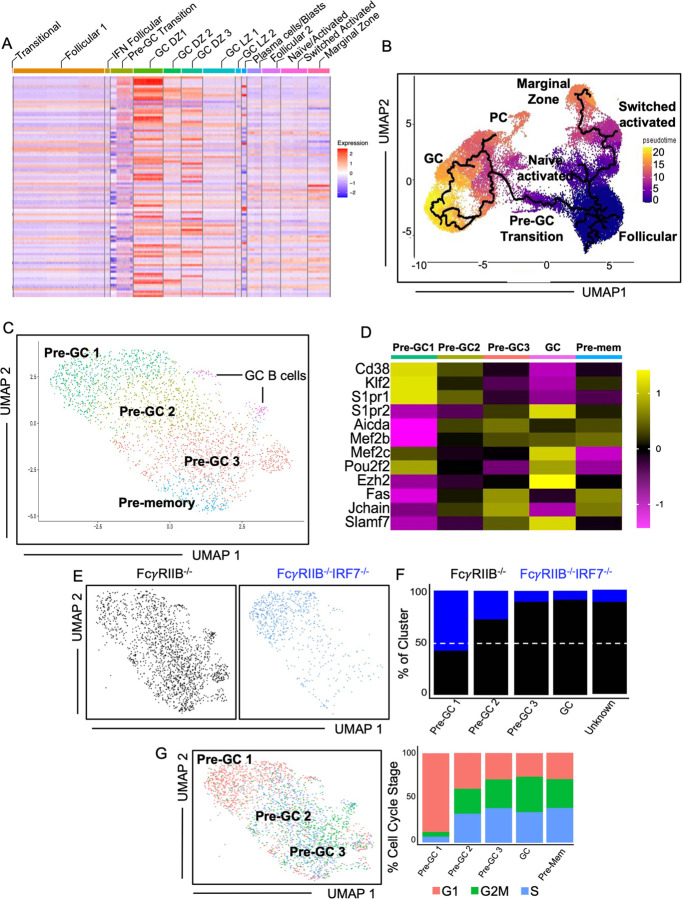
How IRF7 promotes autoimmune B cell responses and systemic autoimmunity is unclear. Analysis of spontaneous SLE-prone mice deficient in IRF7 uncovered the IRF7 role in regulating autoimmune germinal center (GC), plasma cell (PC) and autoantibody responses and disease. IRF7, however, was dispensable for foreign antigen driven GC, PC and antibody responses. Competitive bone marrow (BM) chimeras highlighted the importance of IRF7 in hematopoietic cells in spontaneous GC and PC differentiation. Single-cell-RNAseq of SLE-prone B cells indicated IRF7 mediated B cell differentiation through GC and PC fates. Mechanistic studies revealed that IRF7 promoted B cell differentiation through GC and PC fates by regulating the transcriptome, translation, and metabolism of SLE-prone B cells. Mixed BM chimeras demonstrated a requirement for B cell-intrinsic IRF7 in IgG autoantibody production but not sufficient for promoting spontaneous GC and PC responses. Altogether, we delineate previously unknown B cell-intrinsic and -extrinsic mechanisms of IRF7-promoted spontaneous GC and PC responses, loss of tolerance, autoantibody production and SLE development.


Conflict of interest statement

Competing interests: The authors have no financial conflicts of interests to disclose.

Figures

Figure 1:
Figure 1:. IRF7 promotes autoimmunity in the FcγRIIB−/− mouse model of SLE.
(A-H) B and T cell responses were evaluated in the spleens of FcγRIIB−/− and FcγRIIB−/−IRF7−/− mice at 2, 4 and 6 mo time points. (A) Frequency and number of B220+GL-7+CD95+ GC B cells of total B220+ B cells. (B) Representative flow plots showing the gating strategy of GC B cells. (C) Representative images showing IgDGL-7+ GC B cells and CD4+ Tfh cells within the GC by staining splenic sections with anti-IgD (blue), GL-7 (green) and anti-CD4 (red). (D) Frequency and number of CD4+CD44+CD62L effector T cells of total CD4+ cells. (E) Flow cytometry gating strategy, and (F) frequency and number of CD4+CD44+CD62LCXCR5+PD-1+ Tfh of total CD4+ cells. (G) Number and (H) flow cytometry gating strategy of CD138+TACI+ total plasma cells gated on IgD cells followed by gating on CD138+TACI+ total plasma cells for B220 and CD19 expression to identify B220+CD19+ plasmablast (PB), B220CD19+ immature (iPC) and B220 CD19 mature (mPC) plasma cells based on B220 and CD19 expression. ELISpot assay quantifying the number of dsDNA-, nucleosome- and SmRNP-specific (I) splenic and (J) bone marrow AFCs. (K) Hep-2 immunofluorescent (IF) images showing ANA seropositivity. (L) Nucleosome-, (M) dsDNA- and (N) SmRNP-specific serum IgG and IgG2c titers. (O) IF images of kidney sections showing C3+ (green) and IgG+ (red) immune complex deposition. (P) Flow cytometry plots showing the gating strategy and frequency of CD45+ immune cells in the kidney. (Q) Representative images of kidney sections stained with periodic acid–Schiff (PAS) and (R) the pathology score for glomerulonephritis (GN), interstitial nephritis (IN) and vessels. Each symbol (panels A to P and R) represents an individual mouse (n = 7–22 mice per group) and data are presented as means ± SEM. Data in panels A to R represent two- four experiments per time point. P values were calculated via two-way Anova with Sidak multiple comparisons test (A-G) or an unpaired Student’s t-test (I-R) (*, p <0.05, **, p <0.01, ***, p <0.001, ****, p <0.0001).
Figure 2:
Figure 2:. The major contribution of IRF7 to a TLR7-driven FcγRIIB−/− model of SLE.
(A-H) B and T cell responses were evaluated in the spleens of FcγRIIB−/−yaa (RIIB−/−yaa) and FcγRIIB−/− yaaIRF7−/− (RIIB−/−yaaIRF7−/−) mice at 2 and 4 mo age. (A) Spleen weight of RIIB−/−yaa and RIIB−/− yaaIRF7−/− mice. (B) Flow cytometry gating strategy, and (C) frequency and number of B220+GL-7+CD95+ GC B cells of total B220+ B cells. (D) Number and (E) flow cytometry gating strategy and frequency of CD138+TACI+ plasma cells in IgD B cells. (F) Frequency of IgD CD11b+CD11c+ age associated B cells (ABCs) of B220+CD19+ B cells in the spleen. Frequency of (G) CD4+CD44+CD62L effector T cells of total CD4+ cells and (H) CD4+CD44+CD62L CXCR5+PD-1+ Tfh of total CD4+ cells. (I) Serum IgG and IgG2c anti-SmRNP antibodies were measured by ELISA. (J, K) tsne plot generated from high dimensional flow cytometry analysis of kidney immune cell infiltrates identifying 20 populations. (L) BUN and (M) creatinine levels were measured in sera collected from 4 mo old mice. (N) The percentage of survival in RIIB−/−yaa and RIIB−/−yaaIRF7−/− mice. Each symbol represents an individual mouse (n = 7–13 mice per group) and data are presented as means ± SEM. Data in each panel represent three experiments per time point. P values were calculated via two-way Anova with Dunn-Sidak correction (A-K), an unpaired Student’s t-test (L), Mann-Whitney test (M), or Log-rank (Mantel-Cox) test (N) (*, p <0.05, **, p <0.01, ***, p <0.001, ****, p <0.0001).
Figure 3.
Figure 3.. IRF7 signaling is not required for foreign antigen driven GC, PC and Ab responses.
IRF7-deficient (IRF7−/−, blue circles) and C57BL/6 (B6, black circles) control mice were immunized with NP-KLH in CFA as described in Materials and Methods. The splenic GC, PC and antibody responses were analyzed on 14d post-immunization. Frequencies of (A) B220+ total and (B) B220+NP+ B cells. (C) Frequency of B220+GL-7+CD95+ GC B cells of total B220+ B cells. (D) Frequency of B220+GL-7+CD95+NP+ GC B cells of total B220+ B cells. (E) Representative flow plot of total IgDCD138+TACI+ plasma cells. (F) Gating strategy for different subsets of PCs. (G) Percentages of subsets of plasma cells (total IgDCD138+TACI+ plasma cells, IgDCD138+TACI+B220intCD19+ plasmablasts, IgDCD138+TACI+B220CD19+ immature plasma cells, IgDCD138+TACI+B220CD19 mature/resting plasma cells). (H) Representative flow and dot plots of NP+IgDCD138+TACI+ plasma cells. Frequencies of (I) CD4+CD44+CD62L splenic effector and (J) CD4+CD44+CD62LCXCR5+PD-1+ Tfh of total CD4+ T cells. (K) High affinity (NP4) and (L) low affinity (NP28) anti-NP and total serum IgG and IgG1 titers. Each symbol represents an individual mouse (n =7–10 mice per group) and data are presented as means ± SEM. Data in each panel represent two experiments. P values were calculated via an unpaired Student’s t-test (A-J) or two-way Anova with Dunn-Sidak correction (K-L) (NS, not significant, p>0.05, *, p <0.05, **, p <0.01).
Figure 4:
Figure 4:. IRF7 controls autoimmune GC and AFC responses by functioning in hematopoietic cells.
(A) The schematic of competition chimeras in which allotype marked bone marrow from FcγRIIB−/− (CD45.1+CD45.2+) and FcγRIIB−/−IRF7−/− (CD45.2+) mice were transferred into lethally irradiated CD45.1+ hosts. (B) The bars and flow cytometry plot show bone marrow reconstitution of FcγRIIB−/− (CD45.1+CD45.2+) and FcγRIIB−/−IRF7−/− (CD45.2+) donor cells. Flow cytometry analysis of (C) the frequency and (D) gating strategy of CD38+IgD+ FO B cells of total B220+CD19+ splenic B cells. Flow cytometry analysis of (E) the frequency and (F) gating strategy of IgDCD11b+CD11c+ ABCs of B220+CD19+ total splenic B cells and (G) the frequency and (H) gating strategy of B220+GL-7+CD95+ GC B cells of B220+CD19+ total splenic B cells. Flow cytometry analysis of (I) the frequency and (J) gating strategy of CD138+TACI+ splenic and bone marrow plasma cells of IgD B cells (shown in Figure 1H). Flow cytometry analysis of the frequencies of splenic (K) CD4+ effector T cells, and (L) Tfh of total CD4+ cells and (M) the frequencies of various myeloid cells of total myeloid populations. Each symbol represents an individual mouse (n = 10–14 mice per group) and data are presented as means ± SEM. Data in each panel represent three experiments. P values were calculated via an unpaired Student’s t-test (Not significant, NS, p >0.05, *, p <0.05, **, p <0.01, ***, p <0.001).
Figure 5:
Figure 5:. Single cell RNAseq identifies 14 clusters in SLE-prone FcγRIIB−/− B cells.
(A) Gating strategy for sorting 90% IgD activated and 10% IgD+ naïve B cells for scRNAseq analysis. (B) Unsupervised clustering of 36,842 splenic B cells from 3 mo old FcγRIIB−/− and FcγRIIB−/−IRF7−/− mice, visualized using UMAP. Cells analyzed contained 10% B220+IgD+ naïve and 90% B220+IgD activated B cells that were sorted from two individual FcγRIIB−/− and FcγRIIB−/−IRF7−/− mice (n = 4 mice). (C) Representative UMAPs of hallmark genes to demonstrate annotation of populations in the scRNAseq dataset. Gene expression for clusters is shown at a log scale. (D) UMAPs depicting the distribution of cells between the FcγRIIB−/− and FcγRIIB−/− IRF7−/− mice. (E) The percentage of cells in each B cell cluster from FcγRIIB−/− and FcγRIIB−/−IRF7−/− mice is shown in the bar graphs.
Figure 6:
Figure 6:. Single cell RNAseq delineates the role of IRF7 in B cell differentiation through GC and plasma cell fates.
(A) Top 100 differentially expressed genes across the scRNAseq dataset were analyzed among all clusters. (B) Pseudotime analysis of the scRNAseq dataset projected using the UMAP to transcriptionally predict the differentiation projection of follicular B cells in FcγRIIB−/− mice. (C) Subclustering of the pre-GC transitional cluster (n = 2,461 cells) of splenic B cells from FcγRIIB−/− mice using (D) markers associated with B cell differentiation into GC B cells. (E) Cell cycle analysis of cells in these subclusters. (F) The cells in subclusters were compared between FcγRIIB−/− and FcγRIIB−/−IRF7−/− mice. (G) The percentages of cells in each subcluster from FcγRIIB−/− and FcγRIIB−/−IRF7−/− mice that are in cell cycle are shown in the bar graphs.
Figure 7:
Figure 7:. IRF7 regulates translation and metabolism during B cell activation.
(A) Ingenuity pathway analysis of differentially expressed genes within the pre-GC clusters of the scRNAseq data from FcγRIIB−/− and FcγRIIB−/−IRF7−/− mice. (B) The heatmaps of upregulated and downregulated genes linked to EIF2 signaling and Oxidative Phosphorylation (OxPhos) between FcγRIIB−/− and FcγRIIB−/−IRF7−/− pre-GC clusters. (C) The pie chart showing the genomic locations of IRF7 peaks from ChIP-seq analysis of antigen-experienced IgD B cells from FcγRIIB−/− mice. (D) The volcano plot of IRF7 target genes identified by ChIPseq analysis which are upregulated and downregulated between FcγRIIB−/− and FcγRIIB−/−IRF7−/− B cells in scRNAseq analysis. (E) Representative IRF7 peaks in the promoters of several ribosomal protein genes. (F, G) Extracellular flux analysis showing OXPHOS and glycolysis of FcyRIIB−/−IRF7−/− and FcyRIIB−/− B cells including basal respiration and non-mitochondrial O2 consumption rate. (H) Translation analysis in total and spontaneously activated B cells from FcγRIIB−/− and FcγRIIB−/− IRF7−/− mice. (I) Analysis of translation in TLR7-activated B cells from FcγRIIB−/− and FcγRIIB−/− IRF7−/− mice by flow cytometry. Data in (A-E) represent 4 mice. Each symbol in (F-I) represents an individual mouse (n=3–6 mice group) and data are presented as means ± SEM. Data in (F-I) represent two- four experiments. P values were calculated via an unpaired Student’s t-test (F-G) or two-way Anova with Dunn-Sidak correction (H, I) (Not significant, ns, p <0.05, **, p <0.01, ***, p <0.001, ****, p <0.0001).
Figure 8:
Figure 8:. B cell-intrinsic and -extrinsic roles of IRF7 in breaking tolerance and autoimmune PC and GC responses.
(A) Gating strategy of B220+CD19+GL-7CD95 non-GC B cells (non-GCB), B220+CD19+GL-7CD95+ pre-GC B cells (pre-GCB) and B220+CD19+GL-7+CD95+ GC B cells (GCB). (B) IRF7 expression in gMFI in non-GCB, pre-GCB and GCB cells in B6 and FcγRIIB−/− mice. Our analysis of published RNAseq data of healthy control (HC) and systemic lupus erythematosus (SLE) patients showing IRF7 RNA expression in total (C) and various subsets of B cells (D) such as transitional 3 (T3), resting naïve (rN), activated naïve (aN), double negative (DN2) B cells, switched memory (SM), and plasmablast/plasma cells (ASCs). (E) IRF7 expression was measured in B cells from healthy PBMCs following activation for 24 hours with a TLR7 agonist. (F) Schematic of B cell-specific mixed bone marrow chimeric mice generation. (G) Immunofluorescent staining of Hep-2 slides for serum ANA seropositivity and (H, I) serum anti-dsDNA and anti-SmRNP antibody titers in μMT recipient mice with FcγRIIB−/− B cells sufficient and deficient IRF7. RNA expression in healthy control (HC) and SLE patient B cells. (J-L) Spleen weight and frequencies of B220+ total and FO B cells, GC B cells, splenic plasma and bone plasma cells of B220+ total B cells. (M) Flow cytometry analysis of frequencies of CD4+ total T cells, CD4+ effector T cells and Tfh cells of total CD4+ T cells. (N) Flow cytometry analysis of frequencies of splenic myeloid cells in these mice. Each symbol represents an individual mouse (n = 9–10 mice per group) and data are presented as means ± SEM. Data in each panel represent two independent experiments. P values were calculated via two-way Anova with Dunn-Sidak correction (B) or an unpaired Student’s t-test (C-E and G-N) (NS, not significant, *, p <0.05, **, p <0.01, ***, p <0.001, ****, p <0.0001).

References

    1. Andrilenas K.K., Ramlall V., Kurland J., Leung B., Harbaugh A.G., and Siggers T.. 2018. DNA-binding landscape of IRF3, IRF5 and IRF7 dimers: implications for dimer-specific gene regulation. Nucleic Acids Res 46:2509–2520. - PMC - PubMed
    1. Arkatkar T., Du S.W., Jacobs H.M., Dam E.M., Hou B., Buckner J.H., Rawlings D.J., and Jackson S.W.. 2017. B cell-derived IL-6 initiates spontaneous germinal center formation during systemic autoimmunity. J Exp Med 214:3207–3217. - PMC - PubMed
    1. Bagavant H., and Fu S.M.. 2009. Pathogenesis of kidney disease in systemic lupus erythematosus. Curr Opin Rheumatol 21:489–494. - PMC - PubMed
    1. Ban T., Kikuchi M., Sato G.R., Manabe A., Tagata N., Harita K., Nishiyama A., Nishimura K., Yoshimi R., Kirino Y., Yanai H., Matsumoto Y., Suzuki S., Hihara H., Ito M., Tsukahara K., Yoshimatsu K., Yamamoto T., Taniguchi T., Nakajima H., Ito S., and Tamura T.. 2021. Genetic and chemical inhibition of IRF5 suppresses pre-existing mouse lupus-like disease. Nat Commun 12:4379. - PMC - PubMed
    1. Banga J., Srinivasan D., Sun C.C., Thompson C.D., Milletti F., Huang K.S., Hamilton S., Song S., Hoffman A.F., Qin Y.G., Matta B., LaPan M., Guo Q., Lu G., Li D., Qian H., Bolin D.R., Liang L., Wartchow C., Qiu J., Downing M., Narula S., Fotouhi N., DeMartino J.A., Tan S.L., Chen G., and Barnes B.J.. 2020. Inhibition of IRF5 cellular activity with cell-penetrating peptides that target homodimerization. Sci Adv 6:eaay1057. - PMC - PubMed

Publication types

LinkOut - more resources