[Preprint]. 2025 Feb 7:2025.02.07.636843.
doi: 10.1101/2025.02.07.636843.

Fsr quorum sensing system restricts biofilm growth and activates inflammation in enterococcal infective endocarditis

Affiliations

Fsr quorum sensing system restricts biofilm growth and activates inflammation in enterococcal infective endocarditis

Haris Antypas et al. bioRxiv. .

Abstract

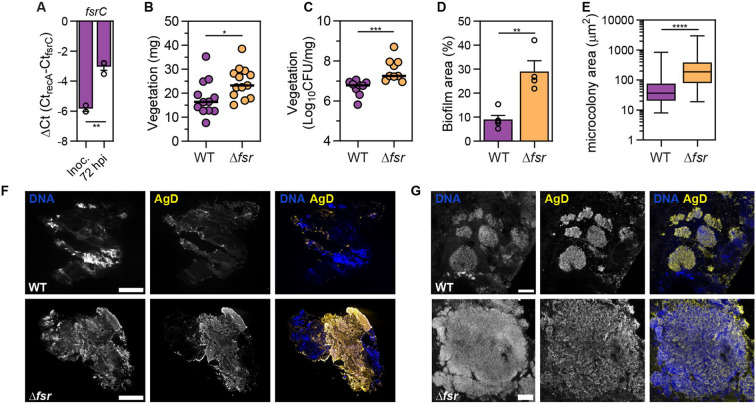
Infective endocarditis (IE) is a life-threatening biofilm-associated infection, yet the factors driving biofilm formation remain poorly understood. Here, we identified the Fsr quorum sensing (QS) system of Enterococcus faecalis as a potent negative regulator of IE pathogenesis. Using microfluidic and in vivo models, we show that Fsr is induced in late IE when bacteria become shielded from blood flow. Deleting Fsr altered biofilm metabolism and promoted robust biofilm growth and gentamicin tolerance in vivo. Furthermore, Fsr inactivation attenuated inflammation by disrupting IL-1β cleavage and activation via the Fsr-regulated gelatinase (gelE), allowing biofilm to grow unchecked by the immune system. Consistent with our pre-clinical findings, analysis of two IE patient cohorts linked naturally occurring Fsr-deficient E. faecalis to prolonged bacteremia. Overall, our findings provide insights into the role of QS in biofilm growth, persistence, and immune evasion in enterococcal IE.

Keywords: Enterococcus faecalis; Fsr; IL-1β; biofilm; gelatinase; immune evasion; infective endocarditis; quorum sensing.


Conflict of interest statement

DECLARATION OF INTERESTS The authors declare no competing interests

Figures

Fig. 1.
Fig. 1.. Fluid flow prevents Fsr QS system induction via advection.
A. Volcano plot showing differentially expressed genes in E. faecalis OG1RF after exposure to fluid flow for 30 min compared to static conditions. Genes exhibiting log2FC > 1.0 with FDR < 0.05 are shown in black. fsr locus genes and associated regulon are labeled. N = 3 independent experiments B. Gene Ontology (GO) enrichment analysis showing the most significantly enriched biological processes (p < 0.05) in E. faecalis when subjected to fluid flow. C. Mean relative gene expression under different magnitudes of shear stress compared to static conditions assessed by qPCR. N = 5, error = SEM. Statistical significance was determined using a one-way ANOVA test and Tukey’s multiple comparison test; *** = p < 0.001, **** = p < 0.0001.
Fig. 2.
Fig. 2.. Early colonization of vegetation is independent of the Fsr QS system.
A-C. Vegetation weight (A), vegetation CFU (B), and blood CFU (C) at 6 hpi. Median of n = 5 - 6 animals per group from N = 1 experiment is shown. Statistical significance was determined using a Mann-Whitney test, ns = not significant. D. E. faecalis adhesion on vegetation (Vg) surface at 6 hpi captured with LSCM, stained for DNA and Enterococcus-specific Group D Streptococcus antigen (AgD) and merged with transmitted light (TL) images. L = lumen, dashed line = vegetation boundary, arrow = bacteria. Representative images are shown from n = 2 animals per group, harvested from N = 2 independent experiments. Scale = 5 μm.
Fig. 3.
Fig. 3.. Absence of Fsr QS system promotes biofilm growth in late IE.
A. qPCR analysis showing mean fsrC expression of the WT strain in the inoculum and vegetations at 72 hpi. fsrC expression is presented as ΔCt values normalized to the expression of the reference gene recA. Vegetation cDNA from n = 3 rats from N = 2 independent experiments was used. Error = SEM. Statistical significance was determined using a t-test. B. Vegetation weight at 72 hpi. Median of n = 12-13 animals per group from N = 3 is shown. Statistical significance was determined using a Mann-Whitney test. C. Vegetation CFU at 72 hpi. Median of n = 9 animals per group from N = 2 is shown. Statistical significance was determined using a Mann-Whitney test. D. Mean biofilm coverage (%) of vegetation sections is shown for n = 4 – 5 animals per group from N = 2. Biofilm coverage was determined by calculating the antigen D (AgD) positive area to total vegetation area. Error = SEM. Statistical significance was determined using a t-test. E. Median of intravegetational microcolony area from n = 2 – 3 animals per group from N = 2 is shown. A total of 88 microcolonies for WT and 101 microcolonies for ΔfsrABDC were quantified. Statistical significance was determined using a Mann-Whitney test. F. Tile images of whole vegetation sections from 72 hpi captured with fluorescence microscopy, stained for DNA and AgD. Representative sections from n = 4 – 5 animals per group from N = 2 are shown. Scale = 500 μm. G. Z-projections of biofilm microcolonies from 72 hpi captured with LSCM stained for DNA and AgD. Representative images from n = 4 – 5 animals per group from N = 2 are shown. Scale = 20 μm; * = p < 0.05, ** = p < 0.01, *** = p < 0.001, **** = p < 0.0001.
Fig 4.
Fig 4.. Absence of gelE and sprE contributes to biofilm growth in late IE.
A-B. qPCR analysis showing mean gelE and sprE expression of the WT strain in the inoculum and vegetations at 72 hpi. gelE expression is presented as ΔCt values normalized to the expression of recA. Vegetation cDNA from n = 3 rats from N = 2 independent experiments was used. Error = SEM, statistical significance was determined using a sample t-test. C-D. Vegetation weight (B) and CFU (C) at 72 hpi. Median of n = 8 - 10 animals per group from N = 2 is shown, with statistical significance assessed with a Mann-Whitney test. E. Epifluorescence microscopy tile images of whole vegetation sections from 72 hpi, stained for DNA and antigen D (AgD). Representative section from n = 4 animals from N = 2 is shown. Scale = 500 μm. F. Z-projection of biofilm microcolonies from 72 hpi captured with LSCM stained for DNA and AgD. Representative image from n = 4 animals from N = 2 is shown. Scale = 20 μm. G. Mean biofilm coverage (%) per vegetation section from n = 4 animals from N = 2 is shown. Biofilm coverage was determined by calculating the antigen D positive area to total vegetation area. Error = SEM. H. Microcolony area median of n = 1 animal from N = 1. A total of 65 microcolonies were quantified. I-L. Vegetation weight and CFU at 72 hpi. Median of n = 4 – 5 animals per group from N = 1 for (H) and (I) and n = 7 – 9 from N = 2 for (J) and (K) is shown, with statistical significance assessed with a Mann-Whitney test; * = p < 0.05, ** = p < 0.01, ns = not significant.
Fig. 5.
Fig. 5.. E. faecalis gelatinase cleaves and activates IL-1β.
A. Z-projections of WT and ΔgelE vegetations at 72 hpi, captured with LSCM and stained for DNA, myeloperoxidase (MPO), and IL-1β. Cyan insets are highlighting the presence of IL-1β between the NETs-biofilm interface. Orange inset is shown magnified in Fig. S3B, and it is highlighting the colocalization of IL-1β in neutrophils. Representative images from n = 3 animals per group from N = 1 experiment are shown. B = biofilm, scale = 20 μm. B. Detection and quantification of IL-1β in WT and Δfsr vegetations at 72 hpi with western blotting. β-actin was used as a loading control. Red arrowhead = pro-IL-1β, blue arrowhead = mature IL-1β. Mean is shown from n = 3 of N = 1. Error = SEM, ns = not significant. Statistical significance was assessed with a t-test. C. Pro-IL-1β and its cleaved fragments in supernatants from OG1RF WT and mutant strains detected by western blotting. Pro-IL-1β was incubated in BHI with indicated OG1RF strains and sampled at 2, 4, 6, and 24 h. Gelatinase presence was also determined by western blotting in these supernatants. ΔgelE::gelEE352A expresses proteolytically inactive gelatinase. BHI = Negative control with only media and pro-IL 1β. Red arrowhead = pro-IL-1β, blue arrowhead = mature IL-1β. D. Activation of HEK-Blue IL-1R reporter cells in the presence of supernatants harvested from OG1RF WT and ΔgelE::gelEE352A cultures with or without pro-IL-1β at 18 h. Cell activation was assessed by spectrophotometric measurement of reporter cell supernatants incubated with a chromogenic substrate. Stimulation of cells with mature human IL-1β was used as a positive control. N = 3, Error = SEM. Statistical significance was determined with one-way ANOVA. E. Mass spectrometry analysis of pro-IL-1β peptide abundance after incubation with OG1RF WT for 0, 6, and 18 h. F. Schematic representation of gelatinase and caspase-1 cleavage sites; *** = p < 0.001, **** = p < 0.0001, ns = not significant.
Fig. 6.
Fig. 6.. fsr locus absence promotes sugar phosphotransferase system and antiholin-like protein upregulation.
A. Volcano plot showing differentially expressed genes of E. faecalis in Δfsr-infected vegetations compared to WT at 72hpi. Genes exhibiting Log2FC ≥ 1.0 with FDR < 0.05 are shown in black. fsr-associated regulon and lrgAB are labeled. n = 4 animals per group from N = 1 experiment. B. Gene Ontology (GO) enrichment analysis showing the most significantly enriched biological processes in E. faecalis in Δfsr-infected vegetations at 72 hpi. C. Endpoint absorbance of OG1RF WT, lrgA::Tn, and lrgB::Tn grown in M1 media, with or without pyruvate (110mM) or glucose (110mM) supplementation, under aerobic and anaerobic conditions. Mean and SEM is shown for N = 3, two-way ANOVA was applied; ** = p < 0.01, **** = p < 0.0001, ns = not significant
Fig. 7.
Fig. 7.. Absence of Fsr correlates with increased antibiotic tolerance, longer bacteraemia, and cases of high disease severity in IE.
A-D. Vegetation weight (A), vegetation CFU (B), platelet blood concentration (C), blood CFU (D) at 72 hpi, with and without gentamicin treatment. Median of n = 4 – 5 animals per group from N = 1 independent experiment is shown. Statistical significance was determined with a Mann-Whitney test between treated and untreated groups infected with the same strain; * = p < 0.05, ns = not significant. E. fsrA presence (%) in E. faecalis isolates from IE patients. F. Bacteremia duration of IE patients in relation to fsrA presence. Median, 10th, and 90th percentiles are shown. Statistical significance was determined with Wilcoxon rank sum test with continuity correction. G. Cumulative disease severity score (Y-axis) of IE patients infected in relation to fsrA presence (X-axis). Frequency (n) for each disease score is shown within each heatmap box. Statistical significance was determined with Fisher’s exact test.

References

    1. Miller M.B., and Bassler B.L. (2001). Quorum sensing in bacteria. Annu Rev Microbiol 55, 165–199. 10.1146/ANNUREV.MICRO.55.1.165. - DOI - PubMed
    1. Solano C., Echeverz M., and Lasa I. (2014). Biofilm dispersion and quorum sensing. Curr Opin Microbiol 18, 96–104. 10.1016/J.MIB.2014.02.008. - DOI - PubMed
    1. Spoering A.L., and Gilmore M.S. (2006). Quorum sensing and DNA release in bacterial biofilms. Curr Opin Microbiol 9, 133–137. 10.1016/J.MIB.2006.02.004. - DOI - PubMed
    1. Kim M.K., Ingremeau F., Zhao A., Bassler B.L., and Stone H.A. (2016). Local and global consequences of flow on bacterial quorum sensing. Nat Microbiol. 10.1038/nmicrobiol.2015.5. - DOI - PMC - PubMed
    1. Kirisits M.J., Margolis J.J., Purevdorj-Gage B.L., Vaughan B., Chopp D.L., Stoodley P., and Parsek M.R. (2007). Influence of the hydrodynamic environment on quorum sensing in Pseudomonas aeruginosa biofilms. J Bacteriol 189, 8357–8360. 10.1128/JB.01040-07. - DOI - PMC - PubMed

Publication types

LinkOut - more resources