An official website of the United States government
The .gov means it’s official.
Federal government websites often end in .gov or .mil. Before
sharing sensitive information, make sure you’re on a federal
government site.
The site is secure.
The https:// ensures that you are connecting to the
official website and that any information you provide is encrypted
and transmitted securely.
Many of the environments that we navigate through every day are hierarchically organized-they consist of spaces nested within other spaces. How do our mind/brains represent such environments? To address this question, we familiarized participants with a virtual environment consisting of a building within a courtyard, with objects distributed throughout the courtyard and building interior. We then scanned them with fMRI while they performed a memory task that required them to think about spatial relationships within and across the subspaces. Behavioral responses were less accurate and response times were longer on trials requiring integration across the subspaces compared to trials not requiring integration. fMRI response differences between integration and non-integration trials were observed in scene-responsive and medial temporal lobe brain regions, which were correlated the behavioral integration effects in retrosplenial complex, occipital place area, and hippocampus. Multivoxel pattern analyses provided additional evidence for representations in these brain regions that reflected the hierarchical organization of the environment. These results indicate that people form cognitive maps of nested spaces by dividing them into subspaces and using an active cognitive process to integrate the subspaces. Similar mechanisms might be used to support hierarchical coding in memory more broadly.
Conflicts of interest The authors declare no conflicts of interest.
Figures
Figure 1 –. Experimental design and procedure.
A) Participants were familiarized with a virtual environment…
Figure 1 –. Experimental design and procedure.
A) Participants were familiarized with a virtual environment consisting of a building (orange) inside a courtyard (green). The building interior could be accessed through a single doorway on the “West” side (marked by an arrow in the image). The building interior could not be perceived from the courtyard or vice versa. Sixteen objects (marked in the image by blue dots) were located in the environment, eight in each subspace (building and courtyard). Participants only saw the environment from a ground-level perspective (right) and never saw an overhead map (left). B) Experimental tasks. Images show the visual displays presented to the participants during the experimental tasks. C) Experimental procedure. Participants learned the locations of the objects in the environment (Environmental Learning) outside the fMRI scanner on Day 1, with a refresher on Day 2. Then the Judgment of Relative Direction (JRD) task was performed within the scanner, followed by free recall and map localization tasks outside the scanner. See the Methods section for full details on the tasks and procedure.
Figure 2:. Behavioral evidence for segmentation into…
Figure 2:. Behavioral evidence for segmentation into subspaces.
A) In the environmental learning task, participants…
Figure 2:. Behavioral evidence for segmentation into subspaces.
A) In the environmental learning task, participants made more within-subspace errors than between-subspace errors. B) A similar trend was observed in the map localization task. C) During free recall, within-subspace transitions between consecutively named objects were more frequent that between-subspace transitions. Grey points and lines indicate individual subjects, black points and lines indicate the group average. Error bars indicate standard error of the mean. * - p<0.05, ** - p<0.01, *** - p<0.001, + - marginal effect (0.05
Figure 3:. Behavioral evidence for integration between…
Figure 3:. Behavioral evidence for integration between the two subspaces.
A) Example schematics of non-integration…
Figure 3:. Behavioral evidence for integration between the two subspaces.
A) Example schematics of non-integration (within-subspace) and integration (between-subspace) JRD trials; the red dot indicates the starting object, the full arrow indicates the facing direction, and the dashed arrow indicates the target object’s direction. B) Integration costs: integration trials show lower accuracy, with an interaction with starting subspace demonstrating asymmetric responses. This is consistent with a model in which people use the hierarchical relations to infer the object direction when they are in the higher hierarchy layer (courtyard) by pointing to the location of the building instead of the location of the object in it. Left – mean+-SE for each trial type. Right – effect sizes: integration – integration cost, non-integration minus integration trial accuracy. Subspace – subspace effect – courtyard minus building accuracy. Interaction – interaction between effects – (courtyard-non-integration minus courtyard-integration) minus (building-non-integration minus building-integration). C) Integration costs in response times (RTs). Integration trials show higher RT than non-integration trials, and building trials show higher RT than courtyard trials, but there is no interaction. Elements similar to panel B, but effect size calculations reversed (integration minus non-integration and building minus courtyard). Other plot elements similar to Figure 2.
Figure 4:. Behavioral switching cost effects between the two subspaces.
A) Example schematics of switch…
Figure 4:. Behavioral switching cost effects between the two subspaces.
A) Example schematics of switch and no-switch JRD trial pairs; the red dot indicates the starting object, the full arrow indicates the facing direction, and the dashed arrow indicates the target object’s direction. B) Switching costs in accuracy – no significant effects. Switching – switching costs – same-subspace minus different-subspace; Subspace – subspace effect – courtyard minus building accuracy. Interaction – interaction between effects – (courtyard-no-switch minus courtyard-switch) minus (building-no-switch minus building-switch). C) Switching costs in response time – data shows a switching cost suggestive of asymmetrical representation, such that consecutive trials in a different starting subspaces take more time than in the same subspace, and an interaction shows that this effect is more pronounced in building-to-courtyard transitions than in courtyard-to-building transitions. Elements similar to panel B, but effect size calculations reversed (different minus same subspace, and building minus courtyard). Other plot elements similar to Figure 3.
Figure 5:. Integration and subspace effects in…
Figure 5:. Integration and subspace effects in univariate fMRI response.
A) Neural activity related to…
Figure 5:. Integration and subspace effects in univariate fMRI response.
A) Neural activity related to integration (within-subspace trials (W) that do not require across-subspace integration, vs. between-subspace trials (B) that require integration). The RSC and PPA show increased activity during trials that require between-subspace integration; OPA shows reduced activity during between-subspace integration trials; and ERC and HPC show deactivation during both trial types, and this deactivation is stronger in between-subspace integration trials. B) Whole-brain analysis (uncorrected) shows that the increased activity during between-subspace integration trials is localized to RSC, PPA and a region anterior to OPA, while integration-induced deactivations occur across multiple parts of the lateral occipito-temporal cortex. C) Activity in ROIs during trials in which the imagined location is in the building (B) and trials when it is in the courtyard (C). The RSC and PPA show increased activity during building trials compared to courtyard trials. D) Whole-brain analysis (uncorrected) shows that the increased activation during building trials is localized to RSC, PPA, a region anterior to OPA, and additional brain regions mainly in the insula and prefrontal cortex. Plot elements similar to Figure 2.
Figure 6:. Correlation between neural and behavioral…
Figure 6:. Correlation between neural and behavioral effects.
Dots represent individual subject values, dashed lines indicate regression line fit.
Figure 7:. Multivariate patterns show segmentation and…
Figure 7:. Multivariate patterns show segmentation and scale differences between the subspaces.
A) Multivariate pattern…
Figure 7:. Multivariate patterns show segmentation and scale differences between the subspaces.
A) Multivariate pattern dissimilarity between neural patterns corresponding to the 16 objects in each ROI. B) Left – a scheme of the environment with all objects’ distances; middle – the expected pattern dissimilarity if neural pattern distance corresponds to inter-object pattern distance; Right – correlation of the veridical distances model to the neural dissimilarity matrices across ROIs. All ROIs showed marginal or significant fit to the neural model. C) A regression of different factors that could together create the fit to the veridical distance model: distance variability between building objects, distance variability between courtyard objects, distance variability between building and courtyard objects, segmentation between the building and courtyard, and scale difference between the building and courtyard. The segmentation and scale effects are significant in most ROIs, but the inter-object distances within and between subspaces are not. Plot elements same as Figure 2. D) Multidimensional scaling of the pattern correlations in each ROIs (red – patterns corresponding to building object trials, green – patterns corresponding to courtyard object trials). In most ROIs, patterns for building objects are visibly separate than those of courtyard objects, and there is a difference in scale (building patterns are more clustered / similar to each other).
Figure 8:. Multivariate patterns show separation and…
Figure 8:. Multivariate patterns show separation and scale differences between integration and non-integration trials.
A)…
Figure 8:. Multivariate patterns show separation and scale differences between integration and non-integration trials.
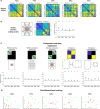
A) Multivariate pattern dissimilarity between neural patterns corresponding to the 32 regressors (16 objects, separated to between-subspace – integration – and within-subspace – non-integration – trials) in RSC. B) Regression results for the separation between integration and non-integration trials in each ROI. Left – model matrix, right – fit to the model matrix in each ROI. Plot elements same as Figure 2. C) Neural pattern dissimilarities across conditions in RSC and PPA. Multivoxel activity is dissimilar between subspaces and between integration and non-integration trials. D) Multidimensional scaling of the pattern correlations in RSC. Patterns for between-subspace (integration) trials are separate and more clustered than within-subspace (non-integration) trials. In addition, within each condition (integration and non-integration), patterns for building objects are separate and more clustered than those of courtyard objects.
A) Simulated results, based on univariate activity differences between conditions (see main text). B) The real experimental results. Both the simulated and real results show similar effects (subspace separation, subspace scale difference, integration vs. non-integration trial separation), suggesting that the observed multivariate results could potentially be explained by the univariate differences between experimental conditions. Plot elements similar to Fig. 2.
Adamou C., Avraamides M. N., & Kelly J. W. (2014). Integration of visuospatial information encoded from different viewpoints. Psychonomic Bulletin & Review, 21(3), 659–665. 10.3758/s13423-013-0538-5
-
DOI
-
PubMed
Aguirre G. K. (2007). Continuous carry-over designs for fMRI. NeuroImage, 35(4), 1480–1494. 10.1016/j.neuroimage.2007.02.005
-
DOI
-
PMC
-
PubMed
Balaguer J., Spiers H., Hassabis D., & Summerfield C. (2016). Neural Mechanisms of Hierarchical Planning in a Virtual Subway Network. Neuron, 90(4), 893–903. 10.1016/j.neuron.2016.03.037
-
DOI
-
PMC
-
PubMed
Baldassano C., Esteva A., Fei-Fei L., & Beck D. M. (2016). Two Distinct Scene-Processing Networks Connecting Vision and Memory. Eneuro, 3(5), ENEURO.0178-16.2016. 10.1523/ENEURO.0178-16.2016
-
DOI
-
PMC
-
PubMed
Behrens T. E. J., Muller T. H., Whittington J. C. R., Mark S., Baram A. B., Stachenfeld K. L., & Kurth-Nelson Z. (2018). What Is a Cognitive Map? Organizing Knowledge for Flexible Behavior. Neuron, 100(2), 490–509. 10.1016/j.neuron.2018.10.002
-
DOI
-
PubMed