[Preprint]. 2025 Aug 30:2025.01.27.635189.
doi: 10.1101/2025.01.27.635189.

Clonal relationships between Tph and Tfh cells in patients with SLE and in murine lupus

Affiliations

Clonal relationships between Tph and Tfh cells in patients with SLE and in murine lupus

Takanori Sasaki et al. bioRxiv. .

Abstract

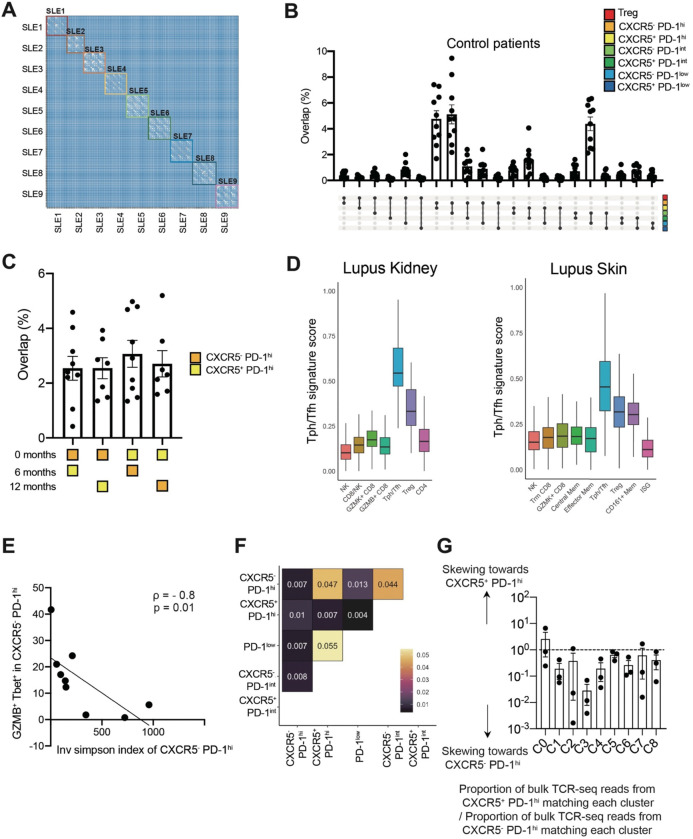
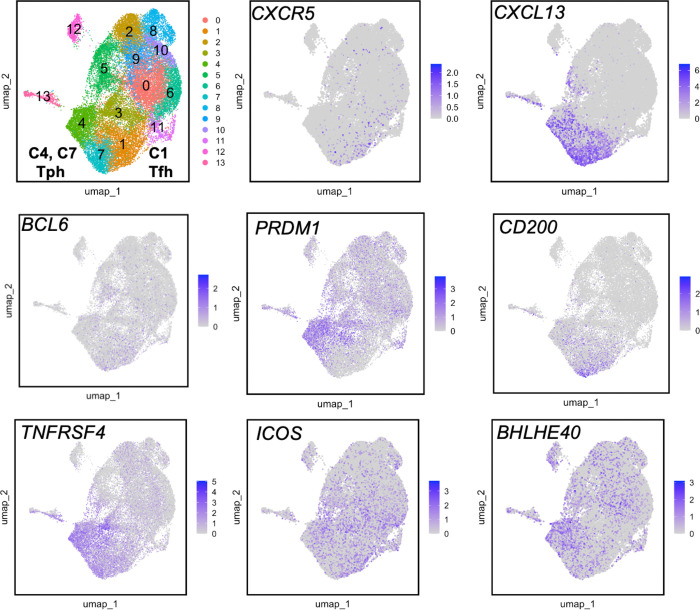
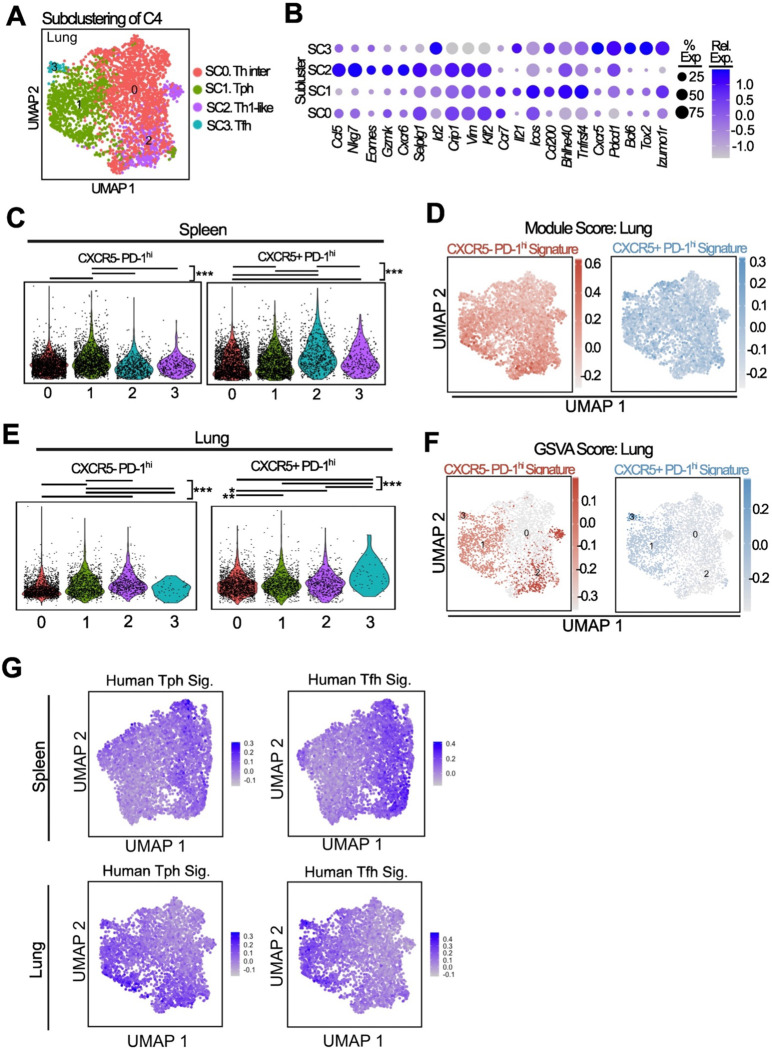
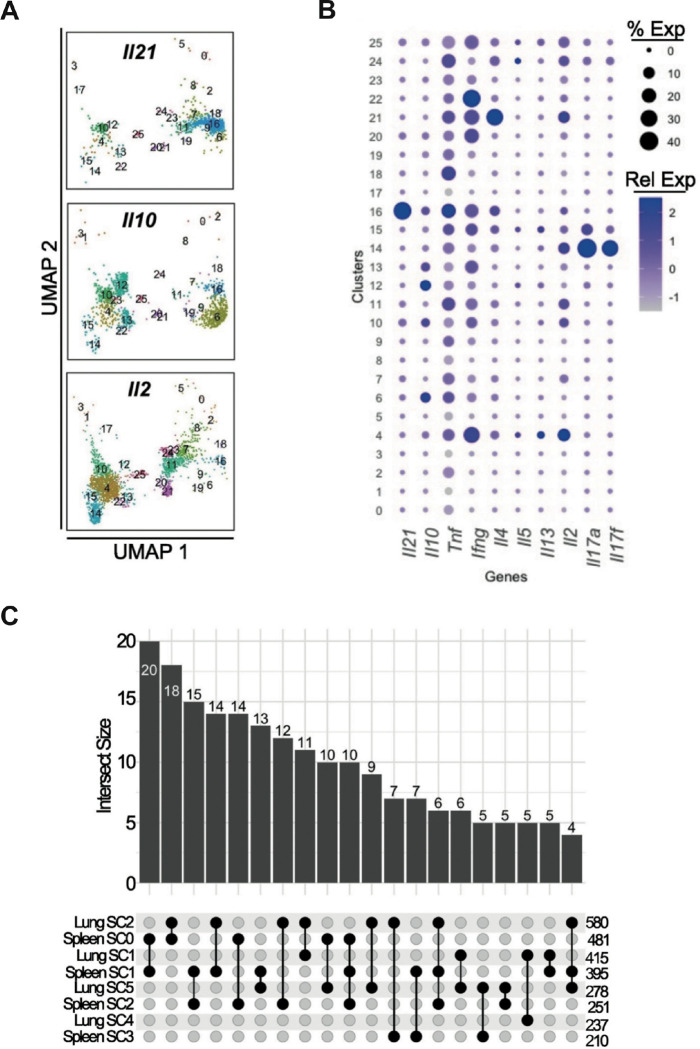
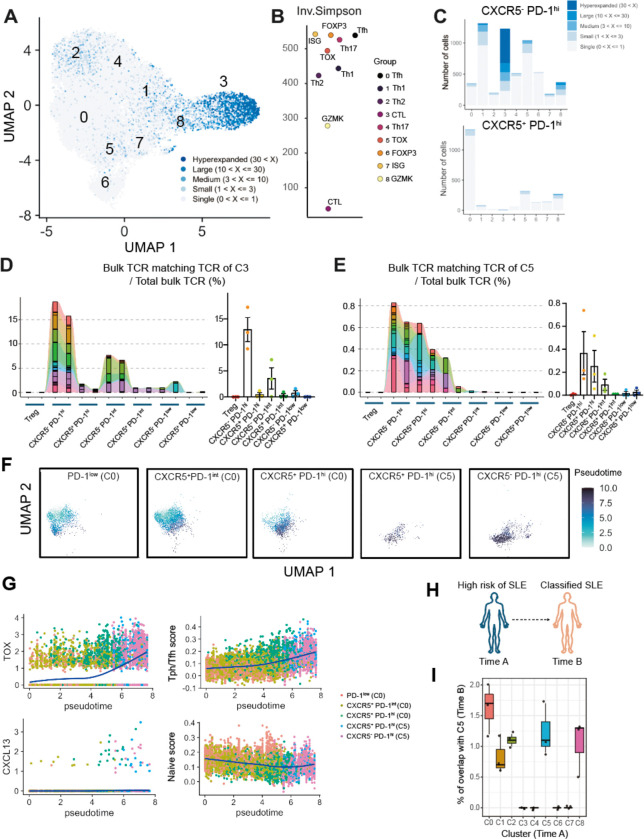
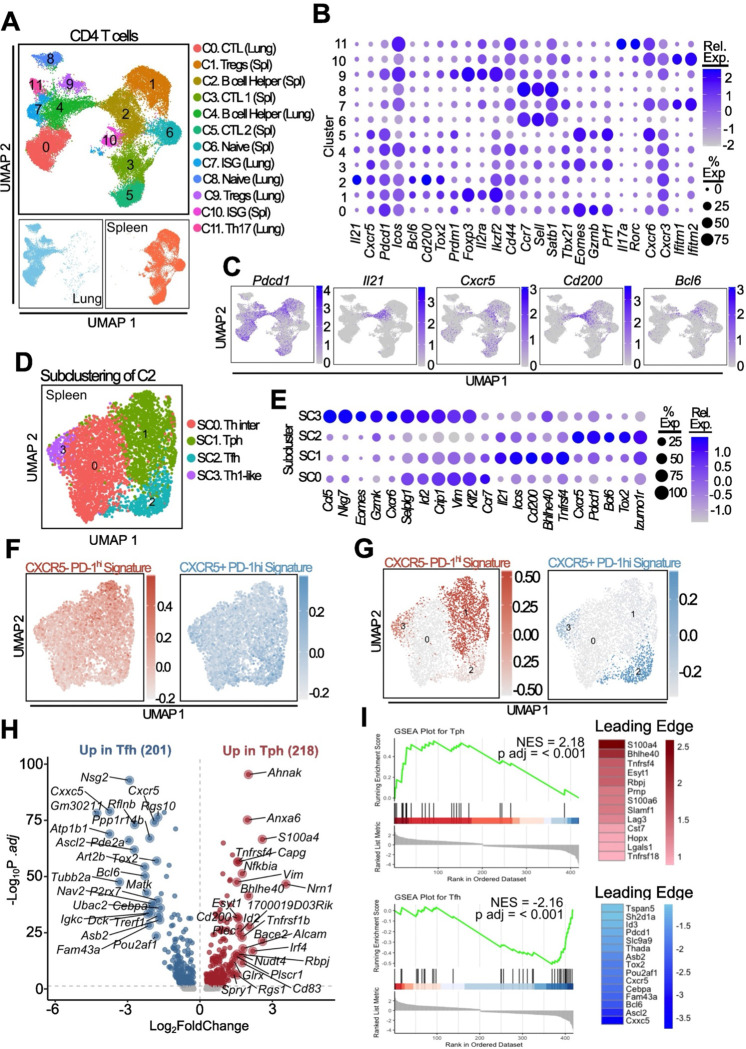
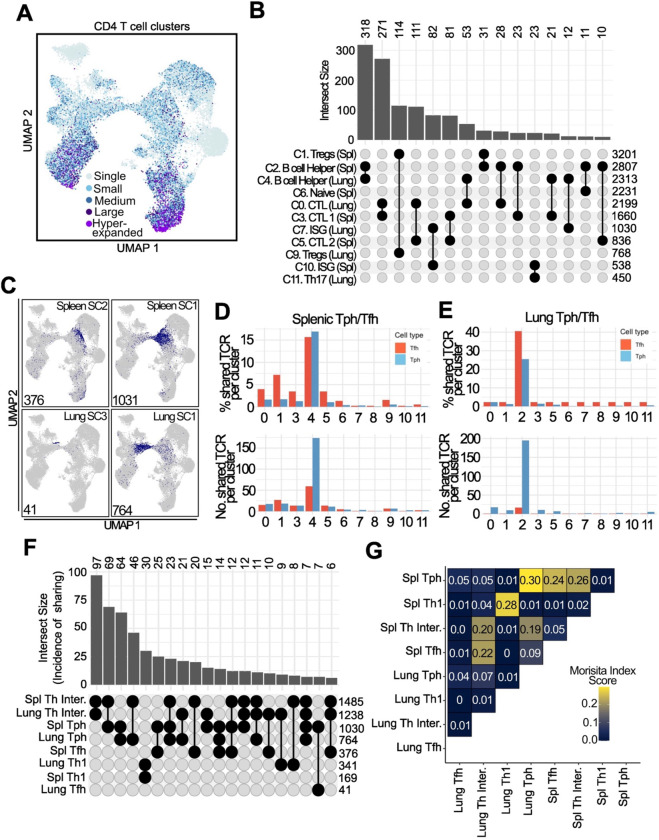
Pathologic T cell-B cell interactions drive disease in systemic lupus erythematosus (SLE). The T cells that activate B cell responses include T peripheral helper (Tph) and T follicular helper (Tfh) cells, yet the developmental and clonal relationships between these B cell-helper T cell populations are unclear. Here we use T cell receptor (TCR) profiling to demonstrate substantial clonal overlap between Tph and Tfh cells in the circulation of patients with SLE. Expanded Tph and Tfh cell clones persist over the course of 1 year in patients with a new diagnosis of SLE, and clones are observed to shift both from Tfh to Tph cells and from Tph to Tfh cells over time. High resolution analysis of cells sorted as Tph cells (CXCR5- PD-1hi) from SLE patients revealed considerable heterogeneity among these cells and highlighted a subpopulation of cells with transcriptomic features of activated B cell-helper T cells. This cell population, marked by expression of TOX and CXCL13, was found in both sorted Tph and Tfh cells, and was clonally linked in these two populations. Analysis of B cell-helper T cells in murine pristane-induced lupus demonstrated similar populations of Tph and Tfh cells in both lung and spleen with strong clonal overlap. T cell-specific loss of Bcl6 prevented accumulation of Tfh cells and reduced accumulation of Tph cells in pristane-treated mice, indicating a role for Bcl6 in the survival and expansion of both populations. Together, these observations demonstrate a shared developmental path among pathologically expanded Tph and Tfh cells in SLE. The persistence of expanded Tph and Tfh cells clones over time may explain the lack of stable tolerance induction by immunosuppressive medications or by B cell depletion.

Keywords: Systemic lupus erythematosus; T cell receptor repertoire; T follicular helper cell; T peripheral helper cell.


Conflict of interest statement

Competing interests The work was performed in part with grant support from Merck & Co., Inc. D.A.R. reports grant support from Janssen and Bristol-Myers Squibb outside of the current report, and reports personal fees from AstraZeneca, Pfizer, Merck, Abbvie, Simcere, Biogen, and Bristol-Myers Squibb. He is co-inventor on a patent using T peripheral helper cells as a biomarker of autoimmune diseases. Y.Q., M.A.S., S.E.A., and M.C.L. are employees of Merck & Co., Inc.

Figures

Extended Data Figure 1.
Extended Data Figure 1.. TCR repertoire features in SLE patients
A. Heatmap of TCR repertoire overlap based on CDR3 beta similarity across all samples from longitudinal SLE patients (n = 378 samples). B. TCR repertoire overlap between Tph cells, Tfh cells, Tregs, and 4 other comparator CD4 T cell subsets in non-inflammatory controls (n = 10, downsampled to 5000 reads). C. Frequency of unique TCR repertoire to Tph or Tfh cells at baseline detected at 6 months or 1 year (Time B : n = 9, Time C : n = 7, downsampled to 5000 reads). D. Tissue Tph/Tfh score of lupus kidney scRNAseq clusters (26) and lupus skin scRNAseq clusters (27). E. Correlation analysis between Inversion Simpson Index (shown in Figure 1B) and frequencies of GZMB+ Tbet+ cells in CXCR5 PD-1hi Tph cells using 9 baseline SLE samples. F. TCR repertoire overlap across flow-sorted populations: Tph, Tfh, CXCR5+ PD-1int, CXCR5 PD-1int, and PD-1low cells. G. The ratio of the proportion of CXCR5 PD-1hi bulk TCR-seq reads matching scTCRseq in each cluster to the proportion of CXCR5+ PD-1hi bulk TCR-seq reads matching scTCRseq in each cluster (n = 3).
Extended Data Figure 2.
Extended Data Figure 2.. Feature plots of B cell helper genes in CD4 T cells from human RA synovium
Expression of several genes associated with Tph (cluster 4 and 7) and Tfh (cluster 1) cells in human CD4 T cells from RA synovium.
Extended Data Figure 3.
Extended Data Figure 3.. TCR overlap and mass cytometric validation of C5 detected by scRNAseq
A. Circos plot showing the TCR sequence overlap in each cluster between CXCR5 PD-1hi cells and CXCR5 PD-1int cells. B. Marker expression of each cluster in the UMAP. C. ICOS+ Ki67+ cells in CXCR5 PD-1hi Tph, CXCR5+ PD-1hi Tfh, CXCR5 PD-1int, CXCR5+ PD-1int, CXCR5 PD-1low, CXCR5+ PD-1low cells. D. Frequencies of C in 10 non-inflammatory controls and baseline 9 SLE samples.
Extended Data Figure 4.
Extended Data Figure 4.. scRNAseq analysis of the high risk Lupus cohort
A. UMAP of CXCR5 PD-1hi cells and CXCR5+ PD-1hi cells from the high-risk for lupus cohort. B. Gene expression profiles of each cluster in the high-risk for lupus scRNA-seq data. C. Cluster abundances in CXCR5 PD-1hi cells and CXCR5+ PD-1hi cells from each sample. D. Clonality of each cluster in high-risk Lupus PBMC scRNAseq data. E. Volcano plot for the DEGs of CXCR5 PD-1hi cells between before (Time A) and after (Time B) the classification of SLE. F. Frequencies of C5 and C1 before (Time A) and after (Time B) meeting classification criteria for SLE.
Extended Data Figure 5.
Extended Data Figure 5.. Differential gene expression analysis between CXCR5− PD-1hi and naïve T cells across different tissues
A. Volcano plot of differentially expressed genes between spleen naïve CD4 T cells and lung CXCR5− PD-1hi CD4 T cells. Several significant DEGs are annotated relating to naïve, Th1, Treg and B cell helper function. B. Volcano plot of differentially expressed genes between lung naïve CD4 T cells and lung CXCR5− PD-1hi CD4 T cells. Several significant DEGs are annotated relating to naïve, Th1, Treg and B cell helper function. C. Volcano plot of differentially expressed genes between lymph node naïve CD4 T cells and lymph node CXCR5− PD-1hi CD4 T cells. Several significant DEGs are annotated relating to naïve, Th1, Treg and B cell helper function. D. Volcano plot of differentially expressed genes between granuloma naïve CD4 T cells and granuloma CXCR5− PD-1hi CD4 T cells. Several significant DEGs are annotated relating to naïve, Th1, Treg and B cell helper function.
Extended Data Figure 6.
Extended Data Figure 6.. Transcriptional profiles associated with Tfh and Tph cells in spleen and lung
A. Ratio of Bcl6 / Prdm1 in Tfh and Tph cells in spleen and lung. Normalized counts are shown as mean ± SD for 3–5 mice per group. B. Frequency of differentially expressed genes (DEGs) for each pairwise comparison across spleen and lung. Genes upregulated in CXCR5+ PD-1hi (Tfh) cells are shown in red, and genes upregulated in CXCR5 PD-1hi (Tph) cells are shown in blue. C. Cytokine expression across CD4 T cell clusters in spleen and lung, visualized by Feature Plots.
Extended Data Figure 7.
Extended Data Figure 7.. Subcluster analysis reveals distinct transcriptional states within spleen and lung
A. DimPlot showing subcluster analysis of lung cluster 4. B. DotPlot of gene expression for various functional T cell states. C. Single cell GSVA scoring of spleen subclusters with ANOVA analysis and Tukey’s post-hoc testing. *** p = <0.001 D. UMAP projection showing module scoring of lung cluster 4 subclusters using genes upregulated in CXCR5− PD1hi cells (red) or CXCR5+ PD1hi (blue) derived bulk-sorted populations. E. Single cell GSVA scoring of lung subclusters with ANOVA analysis and Tukey’s post-hoc testing.* p = < 0.05, ** p = < 0.01, *** p = <0.001. F. UMAP plot of aggregate lung subcluster expression analysed by GSVA for signatures in (Figure 6F). G. Module scoring of spleen and lung subclusters using human derived Tph and Tfh signatures.
Extended Data Figure 8.
Extended Data Figure 8.. Cytokine expression across CD4 T cell clusters in CD4 T cells from Bcl6-sufficient or deficient mice
A. FeaturePlot expression of Il21, Il10 and Il2. B. DotPlot of several different cytokines representative of different T cell functional states across all clusters, relative expression shown. C. Upset plot of TCR sharing between spleen cluster 16 subclusters and lung cluster 10 subclusters. Top 20 interections are shown.
Figure 1.
Figure 1.. Longitudinal changes of TCR repertoire features in SLE
A. Schematic of TCR repertoire analysis in SLE. Bulk TCRs of Tph cells, Tfh cells, Tregs, and 4 other comparator CD4 T cell subsets were generated from blood of 9 patients with a new diagnosis of SLE, followed across 3 timepoints and 10 control donors. B, C. TCR clonality changes over time (SLE: n = 9). TCR clonality was assessed by calculating the mean of inversion Simpson Index (downsampled to 5000 reads) for the duplicates. P-values by Wilcoxon test. D. TCR repertoire overlap between Tph cells, Tfh cells, Tregs, and 4 other comparator CD4 T cell subsets in SLE (n = 9, downsampled to 5000 reads). E. TCR repertoire overlap between Tph cells, Tfh cells, and Tregs across baseline and 6 months (SLE: n = 9, downsampled to 5000 reads). F. TCR repertoire overlap between Tph cells, Tfh cells, and Tregs across baseline and 1 year (SLE: n = 7, downsampled to 5000 reads).
Figure 2.
Figure 2.. Single cell RNA-seq revealed activated B cell helper T cells
A, B. Cluster composition of Tph, Tfh, CXCR5 PD-1int, CXCR5+ PD-1int, and PD-1low cells (SLE: n = 3). Tph, Tfh, CXCR5 PD-1int, CXCR5+ PD-1int, and PD-1low cells were sorted, and stained with Hashtag antibodies, and then generated the scRNA-seq data. C. Gene expression profiles of each cluster in Lupus PBMC scRNA-seq data. D. Tissue Tph/Tfh score of each cluster. E. Tissue Tph/Tfh score of Th1, Th2, Th17, and TOX+ CXCL13+ cells in PD-1low, CXCR5 PD-1int, and CXCR5 PD-1hi populations.
Figure 3.
Figure 3.. Clonal and developmental link between Tfh and Tph cells
A. Clonality of each cluster in Lupus PBMC scRNAseq data. Cells were classified based on the number of TCR clones detected. B. Inverse Simpson Index of each cluster. C. Clonality of each cluster divided by sorted Tph and sorted Tfh cells. D. Frequencies of TCR repertoire of C3 from patient SYL3 detected in bulk TCR-seq data at enrollment. Technical duplicate data are shown. E. Frequencies of TCR repertoire of C5 from SYL3 detected in bulk TCR-seq data at enrollment. F. Pseudotime analysis between C0 and C5 divided in to PD-1low, CXCR5 PD-1int, sorted Tfh and sorted Tph cells. G. Trend of gene expression, Tph/Tfh signature score, naive gene signature scores aligned along pseudotime. H. Experirmental scheme of the pre-SLE cohort. I. TCR overlap frequency between each subset at time A (pre-onset) and C5 at time B (post-onset).
Figure 4.
Figure 4.. C5 is a strong B cell activator population
A. Volcano plot for the DEGs between C5 and other clusters. Red: adj p values < 0.05, log2FC > 0.5, Green: adj p values > 0.05, Blue: adj p values < 0.05, log2FC < 0.5. B. Left: UMAP CD4 T cell clustering of mass cytometry from 14 non-inflammatory controls and 9 SLE patient samples. Right: CNA of mass cytometry data corrected for age and sex. N =14 non-inflammatory controls, 9 SLE patients (baseline samples). Red indicates neighborhoods positively associated with SLE, and blue indicates negative association with SLE. C. Correlation between serum CXCL13 and the frequencies of ICOS+ Ki67+ Tph/Tfh cluster, Tfh cluster CXCR5+ PD-1low cluster, and naive cluster at the baseline SLE samples. D. Linear mixed effect model analysis between mass cytometry clusters and the frequencies of IGHV4–34 on PB quantified by BCR-seq and Ki67+ PB quantified by mass cytometry. 27 SLE patient samples (9 SLE patients × 3 time points) were used, with time as fixed effect. E. Estimated proportion of C5 cells among total cells by deconvolution of ImmuNexUT bulk RNAseq from 495 donors (HC, healthy controls: 79, AAV, ANCA-associated vasculitis:22, AOSD, adult-onset Still’s disease: 17, BD, Behceťs disease : 22, IIM, idiopathic myositis: 64, RA, rheumatoid arthritis:24, SSc, systemic sclerosis:64, TAK, Takayasu disease:16, MCTD, mixed connect tissue disease: 19, SjS, Sjogren syndrome:18, SLE, systemic lupus erytomatosus:136). F. Spearman’s correlation between the estimated frequencies of C0 and C5 in ImmuNexUT study and SLEDAI-2K (n = 136). G. Frequencies of C0 and C5 in the SLE patients with or without autoantibodies and hypocomplementemia. Student t-test was used for the comparisons.
Figure 5.
Figure 5.. CXCR5 PD-1hi CD4 T cells in mouse have a B cell helper signature
A. Quantification of CXCR5 PD-1hi subset in pristane induced lupus in spleen (Spl), peritoneal fluid (PF), lung and granuloma (Grn) at indicated time-points. ANOVA results with indicated post-test significance. * p = <0.05, ** p = < 0.01, *** p = <0.001, n= 3–4 per experiment. Pool of 3 independent experiments. B. Sorting schematic of the RNA-seq experiment. C. PCA analysis of sorted cell subsets grouped by cell type (left) or tissue (right). D. Splenic Il21 expression of normalised counts across each of the sorted subsets. E. GSVA analysis using a Tfh gene signature across each of the different CD4 T cell subsets. F. DEG analysis of splenic CXCR5 PD-1hi vs CXCR5+ PD-1hi subset. Some of the top differentially expressed genes are highlighted. G. Heatmap of gene expression for a custom gene list comprised of lineage, functional, migratory and activation markers. Normalised gene expression is plotted (row normalised.
Figure 6.
Figure 6.. scRNA-seq analysis of CD4 T cells in murine lupus shows B cell helper T cell cluster heterogeneity
A. UMAP plot showing clustering of cell populations for both spleen and lung tissues. B. Dot plot of relative gene expression for various functional T cell states. C. Feature plots of single gene expression for labelled genes. D, E. UMAP and dot plot of gene expression for spleen cluster 2 sub-clustering. F. UMAP projection showing module scoring of splenic cluster 2 subclusters using genes upregulated in CXCR5 PD-1hi cells (red) or CXCR5+ PD-1hi (blue) derived bulk-sorted populations. G. UMAP plot of aggregate subcluster expression analysed by GSVA for signatures in (F). H. Differential gene expression between splenic Tph (subcluster 1) and Tfh (subcluster 2) subsets. Top 25 in each direction are annotated. I. GSEA analysis of DEGs in (H) using human derived Tph or Tfh signatures. Shown on the RHS are the genes contributing to the leading edge of the enrichment.
Figure 7.
Figure 7.. TCR analysis of B cell helper T cells shows high degree of sharing between Tph and Tfh cells in both spleen and lung
A. TCR expansion across the dataset in both spleen and lung. Single (1), Small (>1–5), Medium (>5–20), large (>20–100) and hyperexpanded (>100) are annotated on the plot. B. Upset plot of TCR sharing showing the occurrence of a TCR clones being shared between different clusters (number above bar). Only the top 15 comparisons are shown. Total TCRs for each cluster are shown on the right. C. TCR clones from spleen and lung Tph/Tfh subsets mapped onto the UMAP to show sharing across clusters. D, E. Quantification of C in both the spleen and lung, showing both the percentage of unique TCRs of either Tph/Tfh cells shared per cluster and the number of unique shared TCRs per cluster. F. Upset plot as in B but showing unique TCR sharing between spleen and lung B cell helper subclusters. G. Morisita index plot of spleen and lung B cell helper subclusters.
Figure 8.
Figure 8.. Bcl6 is necessary for B cell helper T cell development
A. UMAP plot of CD4 T cells (both spleen and lung) from 3 month treated Bcl6fl/fl CD4Cre−/+ mice. B. Module scoring of clusters with B cell helper signature (BCH) derived from 12-month scRNA-seq dataset using genes upregulated in spleen cluster 4. C. Subclustering analysis of cluster 16 from spleen showing UMAPs of: subclusters (top left), BCH signature (top right), Tph specific signature (bottom right) and Tfh specific signature (bottom left). D. Upset plot of TCR sharing between spleen cluster 16 subclusters. E and F. Similar analysis of lung cluster 10, as shown in C and D. G. CNA analysis showing cellular representation from either WT (CD4Cre−) or KO (CD4Cre+) cells across the UMAP. Areas of genotype overrepresentation are colour coded as displayed by the inset legend. H. Cell counts of Spleen and lung subclusters representing Tph and Tfh subsets, stratified by genotype. I. Sorted Tfh cells stimulated in vitro for 5 days and analysed by flow cytometry for expression of CXCR5 and PD-1. N=5. J. ELISA of total IgG and dsDNA-IgG in wildtype or Bcl6fl/fl CD4Cre+ mice. Mann-Whitney U test, ** p = < 0.01, n=4–6 per group.

References

    1. Tsokos G. C., Systemic lupus erythematosus. N. Engl. J. Med. 365, 2110–2121 (2011). - PubMed
    1. Jenks S. A., Cashman K. S., Woodruff M. C., Lee F. E.-H., Sanz I., Extrafollicular responses in humans and SLE. Immunol. Rev. 288, 136–148 (2019). - PMC - PubMed
    1. Rao D. A., Gurish M. F., Marshall J. L., Slowikowski K., Fonseka C. Y., Liu Y., Donlin L. T., Henderson L. A., Wei K., Mizoguchi F., Teslovich N. C., Weinblatt M. E., Massarotti E. M., Coblyn J. S., Helfgott S. M., Lee Y. C., Todd D. J., Bykerk V. P., Goodman S. M., Pernis A. B., Ivashkiv L. B., Karlson E. W., Nigrovic P. A., Filer A., Buckley C. D., Lederer J. A., Raychaudhuri S., Brenner M. B., Pathologically expanded peripheral T helper cell subset drives B cells in rheumatoid arthritis. Nature 542, 110–114 (2017). - PMC - PubMed
    1. Bocharnikov A. V., Keegan J., Wacleche V. S., Cao Y., Fonseka C. Y., Wang G., Muise E. S., Zhang K. X., Arazi A., Keras G., Li Z. J., Qu Y., Gurish M. F., Petri M., Buyon J. P., Putterman C., Wofsy D., James J. A., Guthridge J. M., Diamond B., Anolik J. H., Mackey M. F., Alves S. E., Nigrovic P. A., Costenbader K. H., Brenner M. B., Lederer J. A., Rao D. A., Accelerating Medicines Partnership (AMP) RA/SLE Network, PD-1hiCXCR5− T peripheral helper cells promote B cell responses in lupus via MAF and IL-21. JCI Insight 4 (2019).
    1. Makiyama A., Chiba A., Noto D., Murayama G., Yamaji K., Tamura N., Miyake S., Expanded circulating peripheral helper T cells in systemic lupus erythematosus: association with disease activity and B cell differentiation. Rheumatology (Oxford) 58, 1861–1869 (2019). - PubMed

Publication types

LinkOut - more resources