[Preprint]. 2025 Feb 15:2025.02.07.636951.
doi: 10.1101/2025.02.07.636951.

Multiplexed CRISPRi Reveals a Transcriptional Switch Between KLF Activators and Repressors in the Maturing Neocortex

Affiliations

Multiplexed CRISPRi Reveals a Transcriptional Switch Between KLF Activators and Repressors in the Maturing Neocortex

Ryan W Kirk et al. bioRxiv. .

Abstract

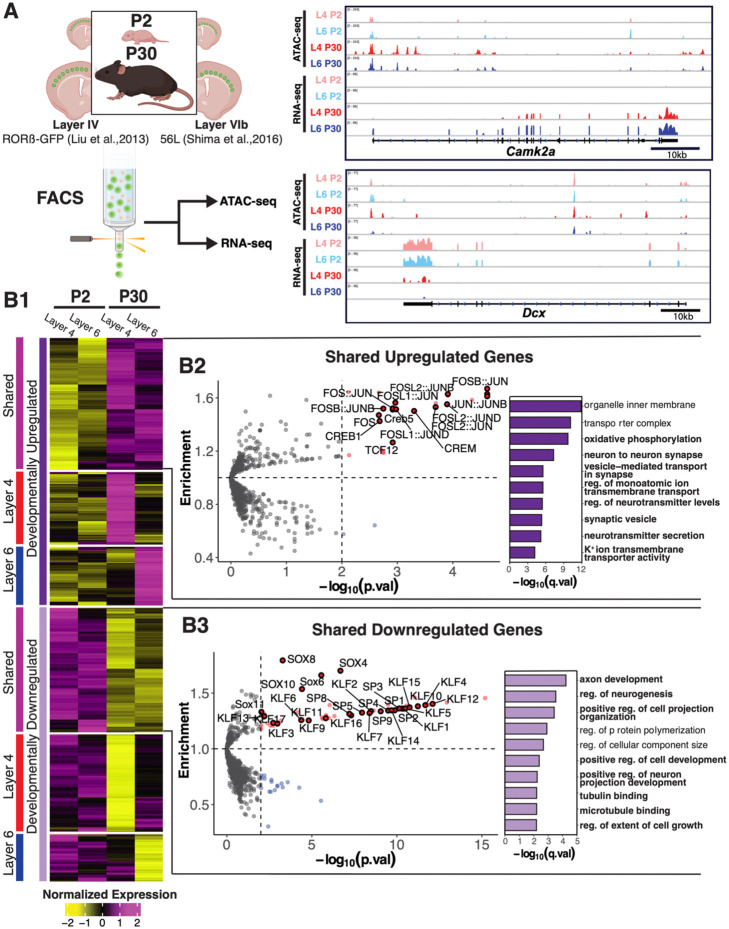
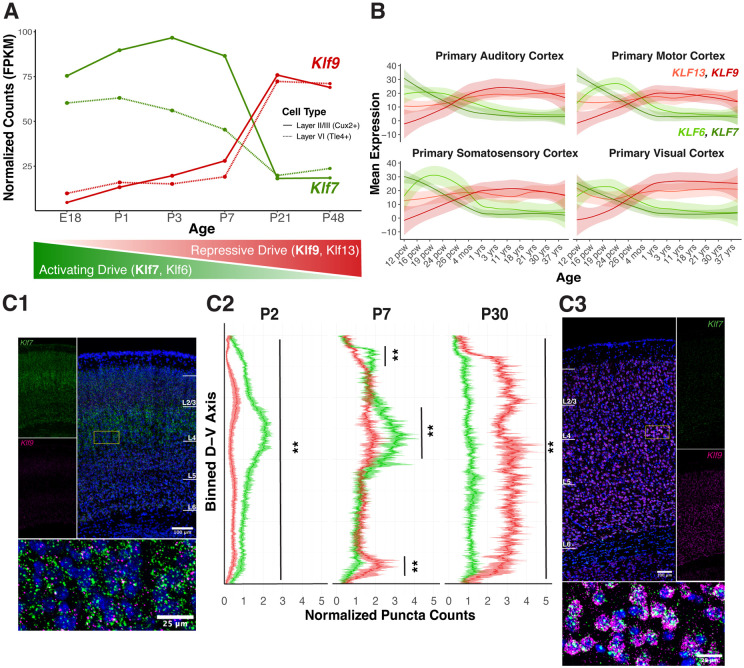
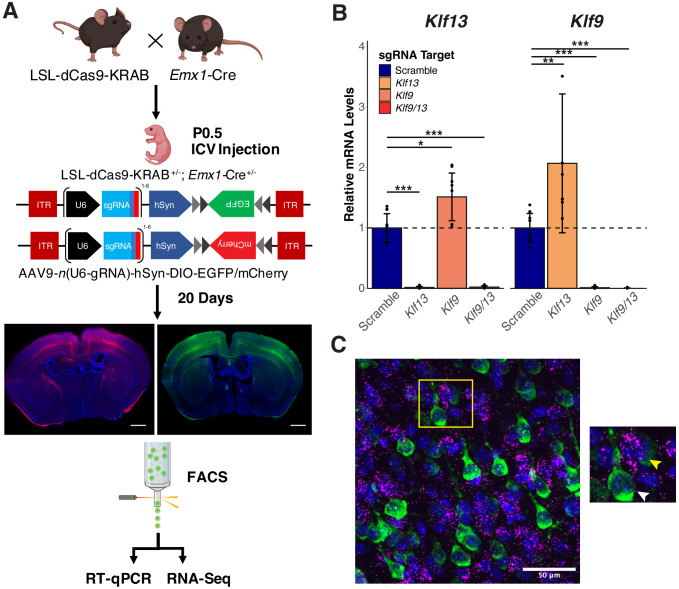
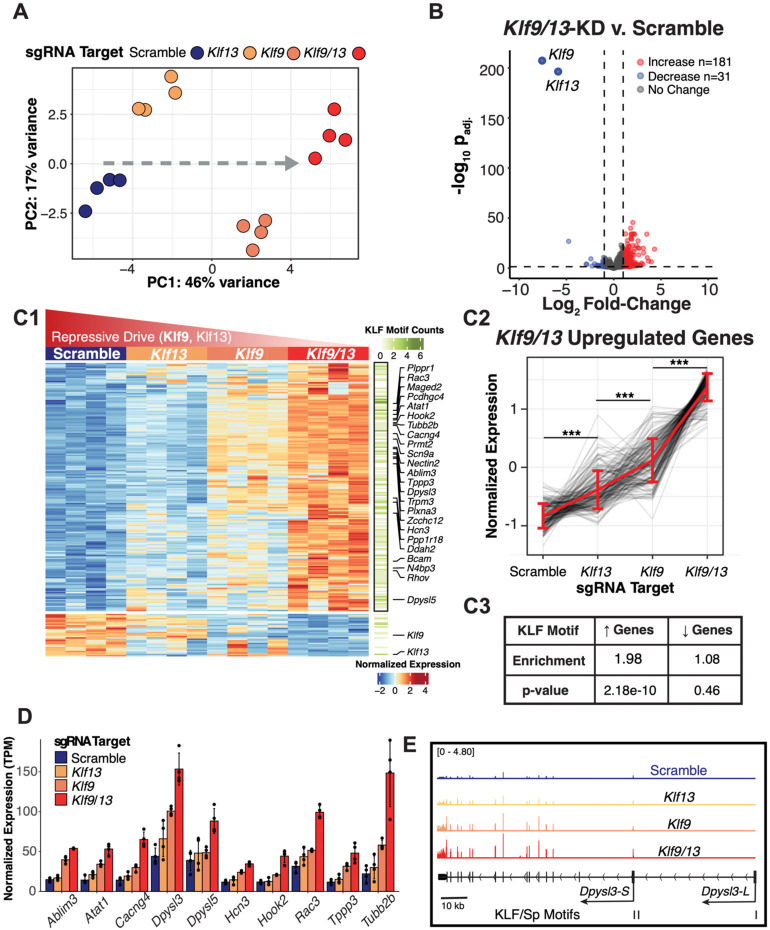
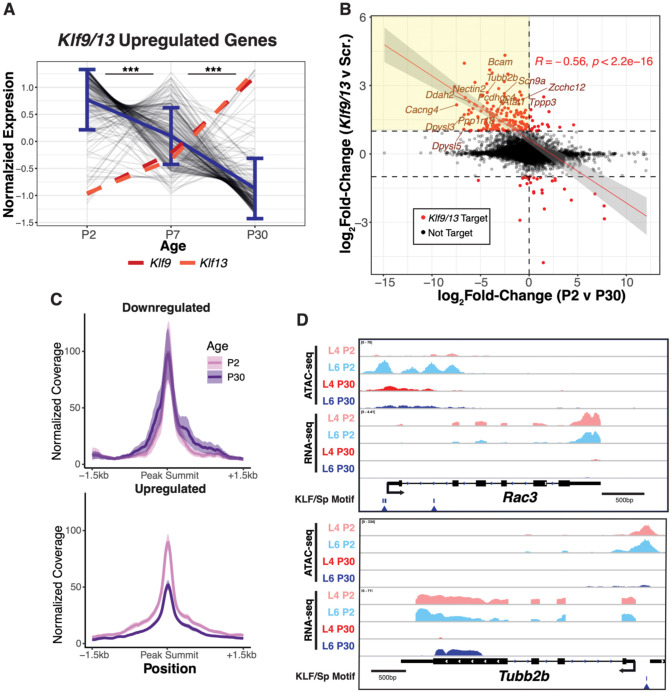
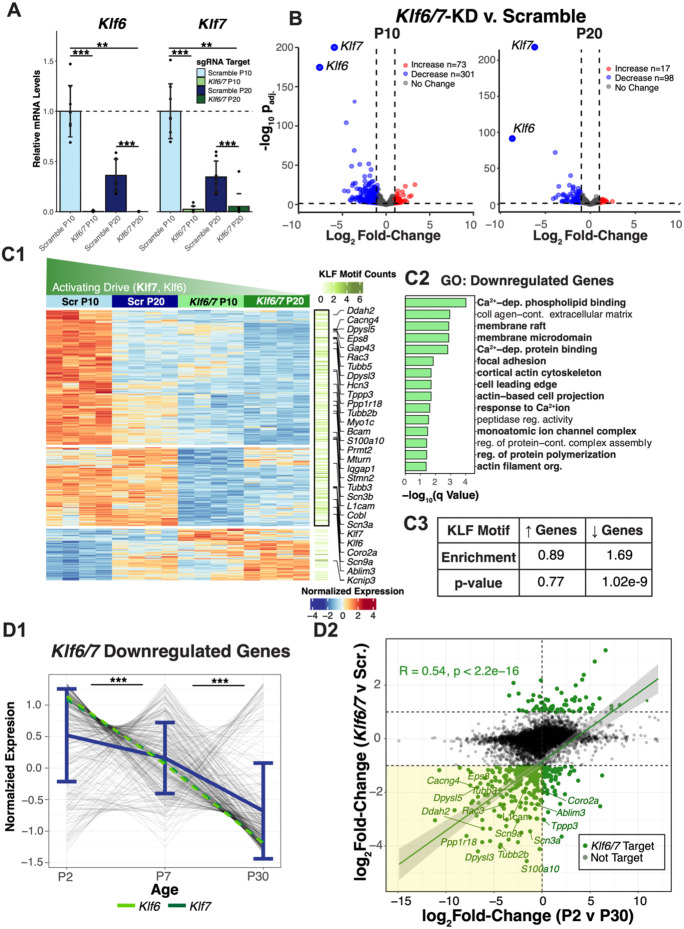
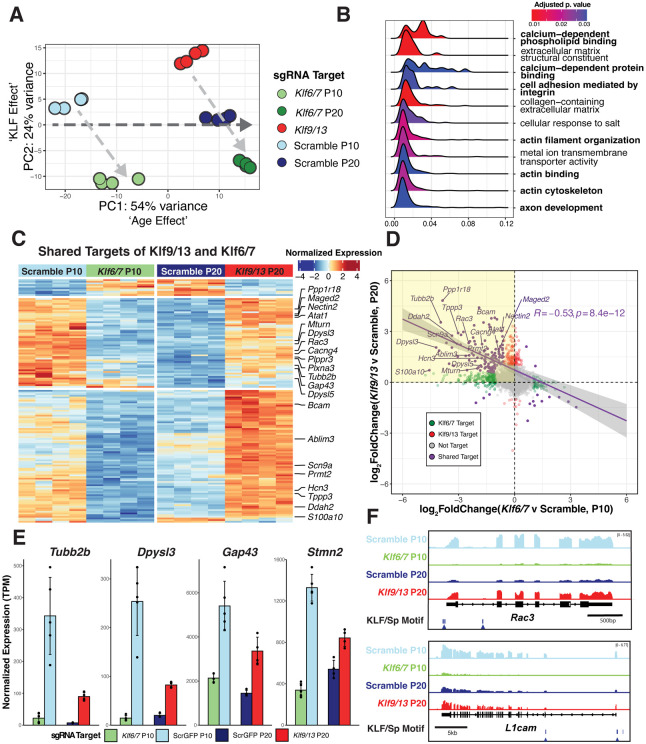
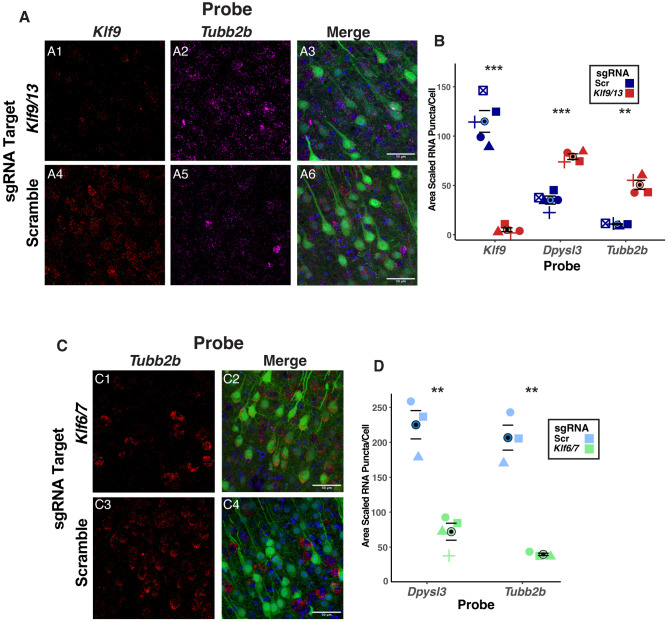
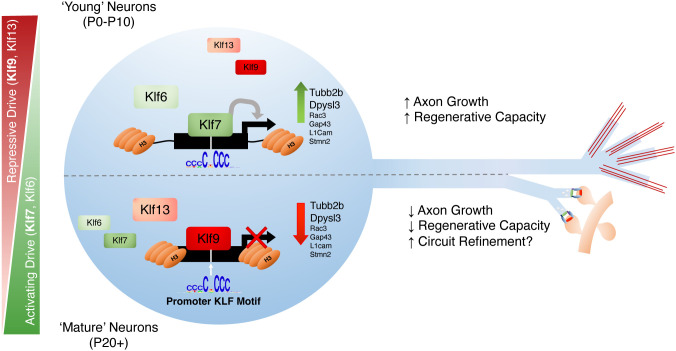
A critical phase of mammalian brain development takes place after birth. Neurons of the mouse neocortex undergo dramatic changes in their morphology, physiology, and synaptic connections during the first postnatal month, while properties of immature neurons, such as the capacity for robust axon outgrowth, are lost. The genetic and epigenetic programs controlling prenatal development are well studied, but our understanding of the transcriptional mechanisms that regulate postnatal neuronal maturation is comparatively lacking. By integrating chromatin accessibility and gene expression data from two subtypes of neocortical pyramidal neurons in the neonatal and maturing brain, we predicted a role for the Krüppel-Like Factor (KLF) family of Transcription Factors in the developmental regulation of neonatally expressed genes. Using a multiplexed CRISPR Interference (CRISPRi) knockdown strategy, we found that a shift in expression from KLF activators (Klf6, Klf7) to repressors (Klf9, Klf13) during early postnatal development functions as a transcriptional 'switch' to first activate, then repress a set of shared targets with cytoskeletal functions including Tubb2b and Dpysl3. We demonstrate that this switch is buffered by redundancy between KLF paralogs, which our multiplexed CRISPRi strategy is equipped to overcome and study. Our results indicate that competition between activators and repressors within the KLF family regulates a conserved component of the postnatal maturation program that may underlie the loss of intrinsic axon growth in maturing neurons. This could facilitate the transition from axon growth to synaptic refinement required to stabilize mature circuits.


Figures

Figure 1 -
Figure 1 -. Shared gene expression changes in maturing layer 4 and 6 cortical pyramidal neurons
A) Experimental Workflow: Rorb-GFP+/− (L4) or 56L (L6) mice were sacrificed at P2 or P30 and GFP+ neurons were isolated by FACS for RNA-seq or ATAC-seq (left). IGV tracks of Gene Expression (RNA-seq) and Chromatin Accessibility (ATAC-seq) of neonatally expressed Doublecortin (Dcx top right) and adult-expressed CaMKIIa (bottom right). B) RNA-Seq of FACS-sorted Rorb+ Layer 4 neurons and Bmp3+ Layer 6 neurons at P2 and P30 (n=4 mice per group). B1: Heatmap of All DEGs identified in either layer between P2 and P30 identifies k=6 unique clusters (DEGs defined as ∣log2FoldChange∣>1; p.adj<0.01 by Wald’s Test with BH correction; min TPM>10). Data plotted as group averages of z-scored relative log gene expression. B2 (right): Top Gene Ontology terms enriched in shared upregulated genes relative to all genes eligible for Differential Expression (Fisher Exact tests with BH adjustment). B2 (left): Transcription Factor Motif Enrichment in ATAC-seq peaks overlapping the Promoter (TSS −1000/+200 bp) of shared upregulated genes relative to all Promoter peaks using the JASPAR 2022 CORE Motif set (Fisher Exact tests with BH adjustment). B3: Same as B2 but for shared downregulated genes.
Figure 2 -
Figure 2 -. Activating (Klf6 and Klf7) and repressive (Klf9 and Klf13) members of the KLF family display opposing patterns of gene expression throughout the developing cortex
A) Developmental dynamics of Klf7 and Klf9 in Layer 2/3 and Layer 6 neurons between E18 and P48. Plotted as mean FPKM from n=2 mice (data replotted from Yuan et al., 2022). B) Expression of KLF6, KLF7, KLF9, and KLF13 mRNA across the human lifespan in 4 sensory cortical regions taken from the human BrainSpan Atlas (Kang et al., 2011). Data are plotted as smoothed loess fits +/− SE. C) RNAScope of Klf7 and Klf9 mRNA P2, P7, and P30 C57 mouse brains demonstrates Klf7 mRNA is more abundant than Klf9 mRNA at P2 (C1) while Klf9 mRNA is more abundant than Klf7 mRNA at P30, where laminar distribution is more uniform (C3. Scale bar: 100 μm (Insert: 25μm). Data quantified in C2 (n=3-4 mice per age, plotted as puncta normalized by nuclei density with 95% confidence intervals; **:p<0.001 , Mann-Whitney U Test)
Figure 3 -
Figure 3 -. A CRISPR Interference strategy for studying cell-autonomous Transcription Factor knockdown in excitatory cortical neurons.
A) Schematic of experimental approach: Mice harboring the dCas9-KRAB transgene are crossed with Emx1-Cre mice and double heterozygous offspring are intracerebroventricularly injected at Postnatal day 0.5 with AAV9 containing guide RNA’s targeting gene(s) of interest and a floxxed fluorophore. After a 10-20 waiting period, infected neurons are sorted based on fluorescence and processed for RT-qPCR or RNA-seq. (Scale bars = 500μm) B ) CRISPRi produces consistent and effective knockdown of Klf9 (99.0±1.7% ) and Klf13 (98.6±1.7%) individually or in combination (Klf9: 99.4±0.6%; Klf13: 97.9±2.2%) as measured by RT-qPCR (n=6-8 mice/condition; data plotted as average Fold Change relative to Scramble sgRNA Control ± standard deviation, Kruskal-Wallis test with post-hoc pairwise Mann-Whitney U test, * p<0.05 **p<0.01, ***p<0.001) C) Example RNA-scope image of P20 mouse cortex infected at P0.5 with AAV9-Klf9gg1,g2-Klf13g1,g2-hSyn-DIO-EGFP and probed for EGFP (Green) and Klf9 (Magenta). (Scale bar = 50μm)
Figure 4 -
Figure 4 -. Klf9 and Klf13 show compensatory activity and additive regulation of target genes
A) Principal component for top 500 most variable genes in all knockdown samples and scramble controls shows graded effect of KLF knockdown along PC1 (n=4 mice per condition). B) De-repression of target genes following Klf9/13 KD. Volcano plot of gene expression changes in Klf9/13 KD relative to Scramble Control mice (DEGs defined as ∣log2FoldChange∣>1; p.adj<0.05 by Wald’s Test with BH correction). C1) Heatmap of all DEGs identified in Klf9/13 KD (212 genes) across all libraries. Data plotted as z-scored, regularized log-transformed counts. Right bar represents KLF/Sp root cluster motif counts identified in ATAC-seq peaks overlapping respective Promoters (TSS −1000/+200bp) by FIMO (qval<0.05, quantified in C3, Fisher’s Exact Test). C2: Line plots of all upregulated Klf9/13 targets across all libraries. Grey lines are z-scored, regularized log-transformed RNA-seq counts of individual genes, blue lines represent average of all genes +/− SEM. (***:p<0.0001, Kruskal-Wallis test with post-hoc pairwise Mann-Whitney U test) D) Additive regulation of selected targets with roles in cytoskeletal or synaptic function (n=4 mice per group, average TPM +/− standard deviation). E) Example IGV traces of RNA-seq coverage at the Dpysl3 locus. Arrows indicate KLF/Sp motif matches (FIMO, q<0.05).
Figure 5 -
Figure 5 -. Putative Klf9/13 targets are developmentally downregulated in the maturing cortex
A) Expression of upregulated DEGs in Klf9/13 KD at early, mid, and late postnatal developmental time points. Grey lines are z-scored, regularized log-transformed RNA-seq counts of individual genes from sorted Rorb+ (Layer 4) excitatory neurons, blue lines represent average of all genes +/− SEM (n=4 mice per group, Kruskal-Wallis test with post-hoc pairwise Mann-Whitney U test, ***p<0.001). B) Gene expression changes in Klf9/13 KD relative to Scramble Controls at P18-20 (n=4 mice per group) relative to gene expression changes between P2 and P30 (n=8 mice per group, aggregate of 2 cell types). Points represent in individual genes, and red points are DEGs identified in Klf9/13 KD samples. Line is linear fit +/− 95% CI to Klf9/13 DEGs (red).C) RiP-normalized coverage of average ATAC-seq signal at Promoter peaks around DEGs identified from Klf9/13 KD RNA-seq (Shaded region = 95% CI; n=4 libraries per group, aggregate of 2 cell types). D) Example IGV traces from P2 & P30 ATAC-seq and RNA-seq for Klf9/13 Targets Rac3 (top, Developmental DEG without Promoter DAR) and Tubb2b (bottom, Developmental DEG with Promoter DAR). Arrows indicate putative KLF/Sp binding site identified by FIMO (q<0.05)
Figure 6 -
Figure 6 -. Klf6 and Klf7 promote expression of developmentally regulated genes in the perinatal cortex
A) RT-qPCR quantification of Klf6 and Klf7 in mice injected with Klf6 and Klf7-targeting sgRNA’s at P0, collected at early (P10-12) or late (P18-20) postnatal timepoints (n=7-9; data plotted as average fold-change relative to P10 Scramble control +/− standard deviation, Kruskal-Wallis test with post-hoc pairwise Mann-Whitney U test with BH adjustment, **p<0.005, ***p<0.001) B) Volcano plot of DEGs identified in Klf6/7 KD samples relative to Scramble Controls at P10 (B1) and P20 (B2, DEGs defined as ∣log2FoldChange∣>1; p.adj<0.05 by Wald’s Test with BH correction). C1) Heatmap of all DEGs identified in Klf6/7 KD at P10 (374 genes, k=3). Data plotted as z-scored, regularized log-transformed counts. Right bar represents KLF motif counts identified in ATAC-seq peaks overlapping respective Promoters (TSS −1000/+200bp) by FIMO (qval<0.05, quantified in C3, Fisher’s Exact Test ). Gene Ontology overrepresentation analysis of downregulated targets shown in C2. D) Developmental regulation of Klf6/7 Targets D1: Expression of downreguated DEGs in Klf6/7 KD at early, mid, and late postnatal developmental time points. Grey lines are z-scored, regularized log-transformed RNA-seq counts of individual genes from sorted Rorb+ (Layer 4) excitatory neurons, blue lines represent average of all genes +/− SEM (n=4 mice per group, Kruskal-Wallis test with post-hoc pairwise Mann-Whitney U test, ***p<0.001). D2: Gene expression changes in Klf6/7 KD relative to Scramble Controls at P10-12 (n=4 mice per group) relative to gene expression changes between P2 and P30 (n=8 mice per group, aggregate of 2 cell types). Points represent in individual genes, and green points are DEGs identified in Klf6/7 KD samples. Lines are linear fits +/− 95% CI to all points (black) or Klf6/7 DEGs (green).
Figure 7 -
Figure 7 -. The transition from KLF activators to repressors constitutes a developmental switch at shared targets
A) Principal component analysis of all RNA-seq libraries shows that Age and KLF valence account for >75% of variance (n=4 mice each). B) GSEA of genes ranked by the bidirectional effect of KLF KD (defined as absolute loadings of PC2 from A) C Heatmap of all DEGs shared between Klf9/13 KD and Klf6/7 KD ( ∣log2FoldChange∣>1; p.adj<0.05) shows bidirectional regulation by the KLF family and developmental regulation of all shared targets. Data plotted as z-scored, regularized log-transformed counts. D) Gene expression changes in Klf6/7 KD relative to Scramble Controls at P10 are significantly negatively correlated with gene expression changes in Klf9/13 KD relative to Scramble controls at P20, especially at shared DEGs (p.adj<0.05 by Wald’s Test with BH correction). E) Bidirectional regulation of novel (Dpysl3, Tubb2b), and established (Gap43, Stmn2) targets Klf7. (Data plotted as TPM +/− standard deviation, n=4 mice) F) Representative IGV tracks of RNA-seq data at targets of Klf7 Rac3 (top) and L1cam (bottom) across treatment groups. Arrows indicate the presence of a KLF/Sp motif identified by FIMO (q<0.05).
Figure 8 -
Figure 8 -. FISH validation of bidirectional regulation of Tubb2b and Dpyls3 by KLF activators and repressors
A) Maximum intensity projections of slices taken from P20 mice receiving P0.5 i.c.v. injections of Scramble sgRNA or Klf9/13-targeting sgRNA AAV9 probed for Klf9 (A1,A4) and Tubb2b (A2,A5). Infected cells receiving sgRNA are EGFP-positive (A3,A6). Scale bars: 50μm. B) Quantification of results in A. Data plotted as average number of RNA puncta per cell scaled by cell pixel area ± s.e.m. (n=4 mice per condition, n=5 for ScrGFP Dpysl3 and Klf9; ***: p<0.001, **: p<0.005 independent samples t-test). C) Maximum intensity projections of slices taken from P10 mice receiving i.c.v. injections of Scramble sgRNA or Klf6/7-targeting sgRNA AAV9 at P0.5 probed for Tubb2b (C1,C3). Infected cells receiving sgRNA are EGFP-positive (C2,C4). Scale bars: 50μm. D) Quantification of results in C. (n=3 mice per condition, n=4 for Klf6/7 Dpysl3; **: p<0.01 independent samples t-test). Shaded shapes represent individual animals.
Figure 9 -
Figure 9 -. A model for the postnatal loss of axon growth capacity through competition between KLF paralogs
During the first week of postnatal development when Klf6 and Klf7 expression are high, the KLF family functions to activate transcription of genes with roles in axon growth including (but not limited to) Tubb2b, Dplys3, Rac3, and Gap43 by binding GC-rich regions in target gene promoters (Top). During the second and third week of postnatal development, the expression of transcriptional repressors Klf9 and Klf13 increases while Klf6 and Klf7 expression decreases, leading to displacement of KLF activators at target promoters and repression of pro-growth transcripts (bottom)

Similar articles

References

    1. Ahmed N. I., Khandelwal N., Anderson A. G., Oh E., Vollmer R. M., Kulkarni A., Gibson J. R., & Konopka G. (2024). Compensation between FOXP transcription factors maintains proper striatal function. Cell Reports, 43(5), 114257. 10.1016/j.celrep.2024.114257 - DOI - PMC - PubMed
    1. Amemiya H. M., Kundaje A., & Boyle A. P. (2019). The ENCODE Blacklist: Identification of Problematic Regions of the Genome. Scientific Reports, 9(1), 9354. 10.1038/s41598-019-45839-z - DOI - PMC - PubMed
    1. Apara A., Galvao J., Wang Y., Blackmore M., Trillo A., Iwao K., Brown D. P., Fernandes K. A., Huang A., Nguyen T., Ashouri M., Zhang X., Shaw P. X., Kunzevitzky N. J., Moore D. L., Libby R. T., & Goldberg J. L. (2017). KLF9 and JNK3 Interact to Suppress Axon Regeneration in the Adult CNS. Journal of Neuroscience, 37(40), 9632–9644. 10.1523/JNEUROSCI.0643-16.2017 - DOI - PMC - PubMed
    1. Avci H. X., Lebrun C., Wehrlé R., Doulazmi M., Chatonnet F., Morel M.-P., Ema M., Vodjdani G., Sotelo C., Flamant F., & Dusart I. (2012). Thyroid hormone triggers the developmental loss of axonal regenerative capacity via thyroid hormone receptor α1 and Krüppel-Like factor 9 in Purkinje cells. Proceedings of the National Academy of Sciences of the United States of America, 109(35), 14206–14211. 10.1073/pnas.1119853109 - DOI - PMC - PubMed
    1. Ávila-Mendoza J., Subramani A., & Denver R. J. (2020). Krüppel-Like Factors 9 and 13 Block Axon Growth by Transcriptional Repression of Key Components of the cAMP Signaling Pathway. Frontiers in Molecular Neuroscience, 13. 10.3389/fnmol.2020.602638 - DOI - PMC - PubMed

Publication types

LinkOut - more resources