[Preprint]. 2025 Jan 27:2025.01.27.635041.
doi: 10.1101/2025.01.27.635041.

A brainstem map of orofacial rhythms

Affiliations

A brainstem map of orofacial rhythms

Heet Kaku et al. bioRxiv. .

Abstract

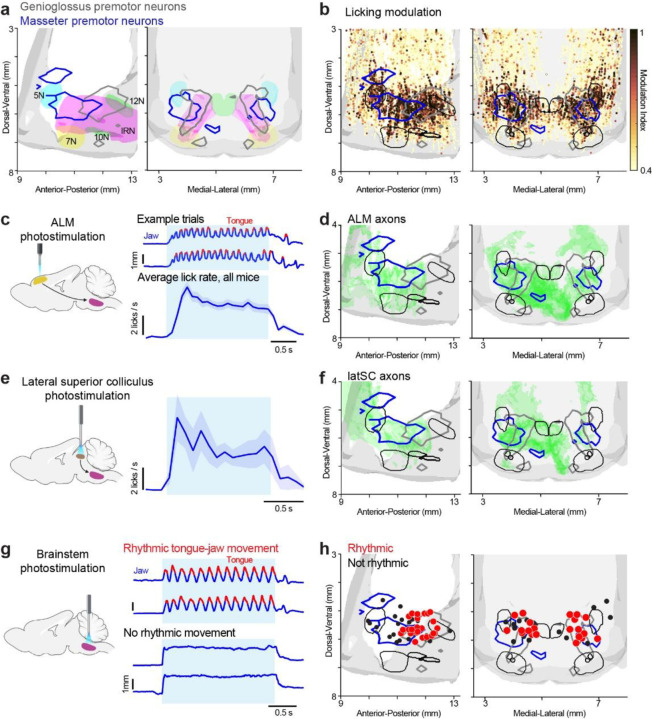
Rhythmic orofacial movements, such as eating, drinking, or vocalization, are controlled by distinct premotor oscillator networks in the brainstem. Orofacial movements must be coordinated with rhythmic breathing to avoid aspiration and because they share muscles. Understanding how brainstem circuits coordinate rhythmic motor programs requires neurophysiological measurements in behaving animals. We used Neuropixels probe recordings to map brainstem neural activity related to breathing, licking, and swallowing in mice drinking water. Breathing and licking rhythms were tightly coordinated and phase-locked, whereas intermittent swallowing paused breathing and licking. Multiple clusters of neurons, each recruited during different orofacial rhythms, delineated a lingual premotor network in the intermediate nucleus of the reticular formation (IRN). Local optogenetic perturbation experiments identified a region in the IRN where constant stimulation can drive sustained rhythmic licking, consistent with a central pattern generator for licking. Stimulation to artificially induce licking showed that coupled brainstem oscillators autonomously coordinated licking and breathing. The brainstem oscillators were further patterned by descending inputs at moments of licking initiation. Our results reveal the logic governing interactions of orofacial rhythms during behavior and outline their neural circuit dynamics, providing a model for dissecting multi-oscillator systems controlling rhythmic motor programs.


Conflict of interest statement

Declaration of interests: Authors declare no competing interests.

Figures

Figure 1.
Figure 1.. Coordination of orofacial rhythms in drinking mice.
a) Multi-directional licking task. On a given trial, the lick spout moved to one of nine possible positions and the animals licked the spout to retrieve a water reward. High-speed videography was made from the bottom view and side view cameras. b) Example bottom view and side view video frames with the tip of the tongue and the jaw labelled. c) Example traces of tongue protrusions (red), jaw movement (blue), breathing (green), and swallowing (gray). Inset, zoomed in view of the example swallow indicated by the arrow. d) Histograms of licking and breathing frequencies. e) Schematic illustrating bidirectional coupling of the breathing and licking oscillators. f) Left, licks aligned to breaths in an example session. The timing of each lick is represented by a dot plotted against inspiration onset, red lines. The inspirations are ranked by the inter-breath interval where the shortest breath is at the top. Right, lick times for trials with two licks within a breathing cycle, sorted by breath frequency. Blue, the top half of the trials; black, the bottom half of the trials. The licks precede inspirations with a fixed latency, and the peak time for the second lick is delayed for slower breath frequency (blue vs. black dot). g) The distribution of lick time difference between top and bottom half of trials (blue vs. black dot in f) for all sessions. The distribution is shifted to positive. h-i) Breaths aligned to licking; same as panels f-g. j) Schematic of the swallowing pattern generator inhibiting the breathing and licking oscillators. k) Left, licks aligned to swallows in an example mouse. The timing of each lick is represented by a dot plotted against swallow onset, red lines. The licks are ranked by the inter-lick interval where the faster licking frequency is at the top. Right, lick times of the top 1/3 of the trials (blue) and the bottom 1/3 of the trials (black). l) The change in inter-lick intervals for bottom 1/3 of the trials. Lick cycles ‘−1’, ‘0’, and ‘1’ are labeled in k. Δ(1, −1), difference between the inter-lick intervals before and after swallowing (cycle ‘1’ minus ‘−1’). Δ(0, −1), difference between the inter-lick intervals before and during swallowing (cycle ‘0’ minus ‘−1’). Inter-lick interval is prolonged during swallowing but recovers after swallowing. m-n) Inspirations aligned to swallowing; same panels as k-l.
Figure 2.
Figure 2.. A brainstem activity map during orofacial behaviors.
a) Neuropixels recordings in the brainstem. b) Example warped image to the Allen anatomical template brain and example probe insertion. The gray is autofluorescence and red is DiI fluorescence from the probe track. c) Example tongue, jaw, and airflow tracking with spikes along a probe insertion. Scale bars, 2 mm. Spikes along the probe are averaged in time bins of 2.5 ms and depth of 20 μm. The example probe insertion shows licking-related activity in the IRN. The ARA annotation of the localized electrode sites is shown on the right. d) Coverage of the recordings in CCF with probe tracks labelled in red and brainstem nuclei. 5N: Trigeminal Nucleus. 7N: Facial Nucleus. 8N: Vestibular Nucleus. 10N: Nucleus Ambiguus. 12N: Hypoglossal Nucleus. IRN: Intermediate Reticular Nucleus. e) Localized units as dots and spike rate indicated by the color. The outlines denote the motor nuclei in d. f) Top, a breathing-related unit with three trials of airflow traces in green and spike times indicated by ticks on top. The tuning curve of the unit is shown on the right. Bottom, activity map of breathing. The modulation index for breathing of every unit is indicated by the darkness of the color. Regions with high density of black dots indicate highly tuned units to breathing. pre-Bot, the preBötzinger complex. g) Top, a licking-related unit with three trials of jaw movement traces in red and spike times indicated by ticks on top. The tuning curve for the unit is shown on the right. Bottom, activity map of licking. Same as f. h) Top, rasters and PSTHs of two swallowing-related units with spike times aligned to swallowing onset (gray line). Bottom, activity map of swallowing. Same as f.
Figure 3.
Figure 3.. Brainstem premotor network for licking.
a) Boundaries of the premotor neurons for the masseter (blue) and genioglossus (grey) muscles. Colored regions indicate the motor nuclei. 5N: Trigeminal Nucleus. 7N: Facial Nucleus. 10N: Nucleus Ambiguus. 12N: Hypoglossal Nucleus. IRN: Intermediate Reticular Nucleus. b) Activity map of licking. Same as Fig 2g, with the boundaries of tongue-jaw premotor regions and motor nuclei overlaid. c) Photostimulation of ALM evokes sustained rhythmic licking. Example jaw movement (blue) and tongue protrusions (red segments) for example photostimulation trials and average lick rate during photostimulation (cyan). Mean ± SEM across mice. n=11 mice. d) Fluorescence from ALM axon projections (green), with the boundaries of tongue-jaw premotor regions and motor nuclei overlaid. e) Photostimulation of the lateral SC (latSC) evokes sustained rhythmic licking. Same as c. n=3 mice. f) Fluorescence from latSC axon projections (green), with the boundaries of tongue-jaw premotor regions and motor nuclei overlaid. g) Photostimulation of the brainstem. Example jaw movement (blue) and tongue protrusions (red segments) for a photostimulation site where sustained rhythmic licking was evoked and a photostimulation site where rhythmic licking could not be evoked. Cyan, photostimulation epoch. h) Spatial map of photostimulation sites. Each dot shows one optical fiber implant, n=46 photostimulation sites, 27 mice. Red dots, photostimulation sites where rhythmic licking was elicited. Black dots, photostimulation sites where rhythmic licking was not elicited.
Figure 4.
Figure 4.. Coupled brainstem oscillators coordinate licking and breathing.
a) ChR2 stimulation of ALM to activate the licking oscillator and elicit licking. b) Left, lick-breath temporal relationship during voluntary licking and artificially induced licking. Data from an example session. Right, the distribution of lick time difference for slow vs. fast breath across all mice. Same as Fig 1f–g. The same lick-breath temporal relationship is preserved during artificially induced licking. c) Breaths aligned to lick; same as Fig 1h–i. d) Simultaneous recording from the licking and breathing oscillators. e) An example unit from the licking oscillator. Left, lick timing and spike timing aligned to breaths. Right, the distribution of spike time difference for slow vs. fast breath across all sessions. Same as b. f) An example unit from the breathing oscillator with activity following breathing. Same as e. g) Left, cross-correlogram of an example pair of breathing unit and licking unit plotted in black. The trial-shuffled mean cross-correlogram is plotted as the gray line, 95% confidence interval is indicated by the dashed lines. Right, the difference between the measured crosscorrelogram and the shuffle for all unit pairs. Unit pairs without significant cross correlation are shown on the bottom; units with positive cross correlations are shown in the middle; units with anticorrelated activity are shown on the top. h) Left, cross-correlogram of an example pair of breathing unit and non-licking unit. Right, population summary for all pairs as in g.
Figure 5.
Figure 5.. Coordination of licking initiation and breathing.
a) Schematic of licking initiation that influences both breathing and licking oscillators. b) Example breathing (green), jaw movement (blue), and tongue protrusions (red) showing that breathing frequency is altered at licking initiation. Vertical line, Go cue onset. Arrow, onset of the first lick. c) Pre-emptive adjustment of breathing during licking initiation. Top, the polar plots show the distribution of breathing phase around the initiation of a licking bout. Bottom, the phase distributions plotted as a function of time relative to the onset of licking. Significant deviation from random distribution is detected at 115 ms before lick onset (dashed line), P<0.0001, two sample Kuiper test with Bonferroni correction. d) Artificially activating the licking oscillator by photostimulating ALM. e) Example breathing, jaw movement, and licking traces for artificially induced licking. Cyan, photostimulation. f) Breathing phase relative to licking onset for artificially induced licking. Same as c. Significant deviation of breathing phase is detected at 47.6 ms before lick onset (dashed line).

References

    1. Ross C. F., Laurence-Chasen J. D., Li P., Orsbon C. & Hatsopoulos N. G. Biomechanical and Cortical Control of Tongue Movements During Chewing and Swallowing. Dysphagia 39, 1–32, doi:10.1007/s00455-023-10596-9 (2024). - DOI - PMC - PubMed
    1. Kleinfeld D. et al. Low- and high-level coordination of orofacial motor actions. Current opinion in neurobiology 83, 102784, doi:10.1016/j.conb.2023.102784 (2023). - DOI - PMC - PubMed
    1. Moore J. D., Kleinfeld D. & Wang F. How the brainstem controls orofacial behaviors comprised of rhythmic actions. Trends Neurosci 37, 370–380, doi:10.1016/j.tins.2014.05.001 (2014). - DOI - PMC - PubMed
    1. Woods J. W. Behavior of Chronic Decerebrate Rats. Journal of neurophysiology 27, 635–644, doi:10.1152/jn.1964.27.4.635 (1964). - DOI - PubMed
    1. Travers J. B., Dinardo L. A. & Karimnamazi H. Motor and premotor mechanisms of licking. Neurosci Biobehav Rev 21, 631–647, doi:S0149–7634(96)00045–0 [pii] (1997). - PubMed

Publication types

LinkOut - more resources