[Preprint]. 2025 Jan 27:2025.01.22.634301.
doi: 10.1101/2025.01.22.634301.

Attenuated adenosine mediated immune-dampening increases natural killer cell activity in early age-related macular degeneration

Affiliations

Attenuated adenosine mediated immune-dampening increases natural killer cell activity in early age-related macular degeneration

Archana Padmanabhan Nair et al. bioRxiv. .

Abstract

Non-exudative age-related macular degeneration (AMD) involves retinal pigment epithelium (RPE) dysfunction and has been linked to altered intraocular immunity. Our investigation focuses on immune cell subsets and inflammation-associated factors in the eyes with early and intermediate AMD. We observed elevated levels of activated natural killer (NK) cells and interferon-γ, concurrent with reduced myeloid-derived suppressor cells (MDSCs) and adenosine in AMD eyes. Aqueous humor from AMD patients had diminished ability to dampen NK cell activation, an effect rescued by adenosine supplementation. The Cryba1 cKO mouse model recapitulated these immune alterations, and single-cell RNA-sequencing identified NK cell-related genes and NK cell-RPE interactions. Co-culture of activated NK cells with RPE cells induced barrier dysfunction and Gasdermin-E driven pyroptosis providing a functional link relevant to AMD. These findings suggest a double-hit model where elevated immune activation and loss of immune dampening mechanisms drive AMD progression. Resetting the intraocular immune balance may be a promising therapeutic strategy for managing early and intermediate AMD.


Figures

Figure 1.
Figure 1.. Increase in NK cells and their subsets (with activating and inhibitory receptors) in early AMD subjects and AMD donor retinae.
(A) Representative images (top panel left to right) on Optos Ultra-widefield retinal imaging system showed hypopigmented spots at posterior pole and Radial optical coherence tomography (OCT) scan passing through lesion shows hyporeflective sub-RPE deposits (yellow arrow) suggestive of drusen (early AMD) while images in bottom panel (left to right) showed no retinal changes (cataract control). (B) Schema shows aqueous humor and retinal immune cell staining and analysis workflow, created with BioRender.com. Graphs showing increased percentage of (C) CD45+ cells (Leukocytes) (D) CD45+CD56+ (Total Natural killer cells), (E) CD45+CD16CD56dim+ (a degranulating NK cell subset) (F) CD45+CD16CD56bright+ (Cytokine producing Natural killer cells) in early AMD AH, (G) CD45+CD16+CD56dim+ (Cytotoxic Natural killer cells) show no difference in early AMD and control AH. (H) NK cell subsets show increase in proportions of NKG2D+ cells, NKp44+cells and NKG2C+ cells (activating receptors), PanKIR2D+ cells, CD159a+ cells, CD161+ NK cells (inhibitory receptors) in early AMD. Cell proportions were determined by calculating individual counts within total cell numbers acquired. Each data point represented a pool of 5 subjects, 6 data points (cataract control, N=30 subjects) and 11 data points (early AMD, N= 55 subjects). Graph shows increased proportions of (I) CD45+CD56+ (Total Natural killer cells) and (J) CD45+CD16CD56dim+(a degranulating NK cell subset); no change in proportions of (K) CD45+CD16CD56bright+ (Cytokine producing Natural killer cells) and (L) CD45+CD16+CD56dim+ (Cytotoxic Natural killer cells) observed in donor retina of control (n=9) and AMD (n=9). (M) Subsets of NK cells show increased proportions of NKG2D+ cells (significant difference seen); NKp44+cells, NKG2C+ cells (activating receptors) and PanKIR2D+ cells, CD159a+ cells, CD161+ NK cells (inhibitory receptors) show no differences in control and AMD donor retinae. Cell proportions were determined by calculating individual counts within total cell numbers acquired. Box and whiskers plot show Min to Max (all points); *P< 0.05, **P<0.01, Mann–Whitney test.
Figure 2.
Figure 2.. Increased immune cell proportions and elevated levels of NK effector molecules (IFN𝛄, IL-12, Granzyme) in AH of early AMD subjects, human AMD donor vitreous humor and Cryba1 cKO mice.
(A-H) Graph shows increased percentages of leukocytes, total natural killer cells, cytotoxic NK cells, cytokine producing NK cells, neutrophils (activated and quiescent); monocyte proportions were not altered in AH of individual subjects with controls (n=15) and early AMD (n=12). (I) Heat map showing differential levels of soluble factors in early AMD AH (n=12) compared to controls (n=15). Higher (↑) and lower (↓) soluble factor levels are highlighted, respectively (*significant analytes). (J,K) Absolute levels of IFNγ were significantly higher in early AMD subjects (early AMD, n=12; controls, n=15) and AMD donor eye (AMD, n=8; healthy donor, n=9). (L-Q) Graph shows increased proportions of leukocytes, NK1.1+ NK cells (total, dim and bright), monocytes and neutrophils in pooled AH of Cryba1 floxed (n=4) and Cryba1 cKO mice (n=4) at 15 months. (R,S) ELISA showed increased Granzyme and IL-12 levels in Cryba1 floxed (n=4) and Cryba1 cKO mice (n=4) at 15 months. Box and whiskers plot show Min to Max (all points); *p value < 0.05, Mann–Whitney test.
Figure 3.
Figure 3.. scRNA sequencing of cells from sub-retinal space (SRS: RPE-choroid) in cKO mice and control mice at 15 months shows NK cell clusters and interaction patterns between NK-RPE cell.
(A) UMAP plot depicting single cell transcriptomes of different cells types including NK cells, neutrophils, MDSCs in Cryba1 cKO and control mouse RPE, at 15 months (n=3 in each group). (B) Volcano plot shows differentially expressed genes from NK cell cluster in Cryba1 cKO mice relative to control. (C) Major gene ontology(GO) functions are related to NK cell cytotoxicity and responses in Cryba1 cKO mice relative to control at 15months. The size and color of the bubble represents the percentage of identifiers within the biological process and number of genes enriched in the biological process that is of statistical significance, respectively. The process with upregulated genes are indicated in ‘red’ and downregulated genes are indicated in ‘blue’. NES, normalized enrichment score. (D,E) Dot plot comparing ligand expression in NK cells and receptor expression in RPE cells in control and Cryba1 cKO mice. (F) Ligand-receptor(L-R) interaction scores identified unidirectional NK cell-RPE interaction pairs in control and Cryba1 cKO mice at 15 months.
Figure 4.
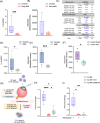
Figure 4.. Lower MDSC proportions and adenosine levels (NK dampener) in AMD patient samples with loss of immune dampening function upon addition of early AMD AH.
(A) M-MDSC proportions show significant reduction in early AMD AH. (B). Untargeted metabolomics shows lower intensity of adenosine in early AMD AH (n=3) compared to controls (n=3) (metabolomics run in triplicate for each sample). (C) Panel indicates negative correlation between NK cell subsets and M-MDSC in AH (n=17). NK cell subtypes show positive association with IFNγ, perforins, cataract controls and early AMD subjects (n=27); IFNγ shows negative correlation with adenosine (n=16).(D) Reduced M-MDSC proportions in retinal lysates in AMD donor retina compared to healthy retina (n=9 in both groups) (E) Graph shows lower intensity of adenosine in donor AMD retinal lysate (n=4) compared to controls (n=4) by untargeted metabolomics (metabolomics run in triplicate for each sample). (F) Significant reduction in adenosine levels seen in Cryba1 cKO mice. (G) Method schema showing in-vitro assay for assessing immune dampening function in activated NK cells. (H) Graphs show loss of immune dampening due to increased IFNγ levels (represented as fold change) in activated NK cells (isolated from peripheral blood of 5 healthy donors) on addition of early AMD AH versus control AH. (I) Graph shows reduced IFNγ levels (represented as fold change) in activated NK cells (isolated from peripheral blood of 3 healthy donors) on addition of adenosine (5μM). Box and whiskers plot show Min to Max(all points); *P< 0.05, **P<0.01, ****P<0.0001, Mann–Whitney test (A,B,D), Unpaired t test with Welch’s correction (E,F). Kruskal-Wallis test followed by Dunn multiple comparison test (H,I). Table shows r = Spearman rank correlation coefficient, p value<0.05 (C)
Figure 5.
Figure 5.. Interaction of RPE with NK cells impairs barrier function and triggers pyroptotic death in RPE.
(A) Schema showing procedure to assess effect of activated NK cells and adenosine on iRPE cultured in matrigel-coated Transwell inserts. (B) Net TEER (Ωcm2) of iRPE cells (+/−NK cells and adenosine) shows significant reduction in presence of activated NK cells with significant rescue by addition of adenosine. (C) Zonula occludin (ZO-1) staining of iRPE cells (control cells), iRPE with activated NK cells, iRPE cells with adenosine (5μM) and activated NK cells at 40X magnification; ZO-1-Alexa Fluor 488- Green, DAPI – nuclear stain(blue) and Merge indicated as Blue-Green, in Olympus CKX53 microscope, Scale bar: 20 μm. In presence of activated NK cells, ZO-1 staining and arrangement was disrupted, while with further addition of adenosine the cell morphology was similar to control iRPE cells. Images shown are representative of images obtained on addition of NK cells from 2 donors. (D) Graph shows significant increase in IL-1β mRNA levels, an indicator of pyroptotic cell death, in co-cultures of iRPE cells and activated NK cells; IL-1β mRNA levels are lower on addition of activated NK cells treated with adenosine. (E) Secreted IFNγ levels were higher in iRPE cell supernatants from cells exposed to activated NK cells and reduced after adenosine treatment (5μM) (F,G) Western blot and densitometry of ARPE-19 cells co-cultured with activated NK cells (+/− adenosine) shows increased expression of GSDME in cultures with activated NK cells, with significant reduction on addition of adenosine. Major difference in GSDME-N expression was not seen with activated NK cells, on addition of adenosine, reduction in GSDME-N expression was observed. (H,I) Live cell imaging of NK cell-RPE co-culture was performed on 3D Cell Explorer, NANOLIVE for 16h with and without activated NK cells, Scale bar =20 μm. NK cells were stained with PKH26 Red Fluorescent cell membrane cell linker kit (orange colored).Figure H shows no changes in morphology/vacuolations were observed in ARPE-19 cells. Figure I shows activated NK cells interacting with ARPE-19 cells suggestive of pyroptosis like increased cell swelling and localized vacuolations (vacuolations on ARPE-19 cells are indicated with yellow arrows). Graphs show Min to Max (all points); P values (< 0.05) obtained using Ordinary one way ANOVA followed by Tukey’s multiple comparison test.
Figure 6.
Figure 6.. Intravitreal adenosine reduces aqueous humor immune cell infiltration and rescues NK cell-RPE interaction dependent pyroptotic death in-vivo.
(A-E) Lower proportions of NK1.1+ NK cells (total, dim and bright), monocytes and neutrophils found in pooled AH of Cryba1 cKO mice injected with adenosine (n=4) compared Cryba1 cKO mice prior to intravitreal adenosine injection. (F) Granzyme levels as measured by ELISA are elevated in AH from 15 month old Cryba1 cKO mice, but reduced to level of control mice post intravitreal adenosine injection (n=4). (G) Representative immunofluorescence images (40X magnification) of human donor retina and RPE choroid complex stained with Granzyme B and Occludin antibodies, Scale bar: 20μm (n=3 each). (H) Representative phase contrast image (10X magnification) showing H&E-stained tissue section of AMD show characteristic drusen deposition (indicated by ∗) in RPE layer, no retinal changes are seen in healthy donor (control) eye (n=3 each), Scale bar: 100μm. Inset shows H& E stained eye globe slice in AMD and healthy donor respectively (I-K) RPE cell lysates show increasing trend in expression of GSDME and GSDME-N in Cryba1 cKO mice and reduces in RPE lysates of adenosine treated eyes. Box and whiskers plot show Min to Max(all points), *P< 0.05, **P<0.01,****P<0.0001, Ordinary one-way ANOVA followed by Tukey’s multiple comparison test (B-H, J, K).

References

    1. Flaxman S. R. et al. Global causes of blindness and distance vision impairment 1990–2020: a systematic review and meta-analysis. Lancet Glob Health 5, e1221–e1234 (2017). 10.1016/S2214-109X(17)30393-5 - DOI - PubMed
    1. Somasundaran S., Constable I. J., Mellough C. B. & Carvalho L. S. Retinal pigment epithelium and age-related macular degeneration: A review of major disease mechanisms. Clin Exp Ophthalmol 48, 1043–1056 (2020). 10.1111/ceo.13834 - DOI - PMC - PubMed
    1. Boopathiraj N., Wagner I. V., Dorairaj S. K., Miller D. D. & Stewart M. W. Recent Updates on the Diagnosis and Management of Age-Related Macular Degeneration. Mayo Clin Proc Innov Qual Outcomes 8, 364–374 (2024). 10.1016/j.mayocpiqo.2024.05.003 - DOI - PMC - PubMed
    1. Nebbioso M. et al. Therapeutic Approaches with Intravitreal Injections in Geographic Atrophy Secondary to Age-Related Macular Degeneration: Current Drugs and Potential Molecules. Int J Mol Sci 20 (2019). 10.3390/ijms20071693 - DOI - PMC - PubMed
    1. Davis M. D. et al. The Age-Related Eye Disease Study severity scale for age-related macular degeneration: AREDS Report No. 17. Arch Ophthalmol 123, 1484–1498 (2005). 10.1001/archopht.123.11.1484 - DOI - PMC - PubMed

Publication types

LinkOut - more resources