[Preprint]. 2025 Jan 29:2025.01.28.635336.
doi: 10.1101/2025.01.28.635336.

Receptor Allostery Promotes Context-Dependent Sonic Hedgehog Signaling During Embryonic Development

Affiliations

Receptor Allostery Promotes Context-Dependent Sonic Hedgehog Signaling During Embryonic Development

Shariq S Ansari et al. bioRxiv. .

Abstract

Sonic Hedgehog (SHH) signaling functions in temporal- and context-dependent manners to pattern diverse tissues during embryogenesis. The signal transducer Smoothened (SMO) is activated by sterols, oxysterols, and arachidonic acid (AA) through binding pockets in its extracellular cysteine-rich domain (CRD) and 7-transmembrane (7TM) bundle. In vitro analyses suggest SMO signaling is allosterically enhanced by combinatorial ligand binding to these pockets but in vivo evidence of SMO allostery is lacking. Herein, we map an AA binding pocket at the top of the 7TM bundle and show that its disruption attenuates SHH and sterol-stimulated SMO induction. A knockin mouse model of compromised AA binding reveals that homozygous mutant mice are cyanotic, exhibit high perinatal lethality, and show congenital heart disease. Surviving mutants demonstrate pulmonary maldevelopment and fail to thrive. Neurodevelopment is unaltered in these mice, suggesting that context-dependent allosteric regulation of SMO signaling allows for precise tuning of pathway activity during cardiopulmonary development.


Conflict of interest statement

Competing Interests The authors declare no competing interests.

Figures

Figure 1.
Figure 1.. Specificity of cPLA2α contributions to ciliary trafficking.
(A) SMO signal induction by a CRD-binding agonist (blue) activates Gαiβγ to stimulate cPLA2α production of arachidonic acid (AA). AA is proposed to interact with the 7TM domain of active SMO to enhance its enrichment in the PC for increased signaling to GLI2/3 transcriptional effectors (pink). (B) A fraction of endogenous phospho-cPLA2α (magenta) localizes to the base of the PC (marked by γ-tubulin, cyan) in NIH-3T3 cells. ARL13B-GFP (green) marks the ciliary axoneme. Scale bar = 2 μm. (C) NIH-3T3 cells expressing SSTR3-GFP were treated with vehicle (DMSO), GIRI (2μM), and control or SHH conditioned media as indicated for 18h. The ciliary axoneme is marked with ARL13B (magenta). Endogenous SMO is cyan. DAPI is blue. Scale bar = 5 μm. (C’) Quantification of ciliary signal intensity for SSTR3-GFP, SMO, and ARL13B in cells treated with control or SHH conditioned media plus 2 μM GIRI or vehicle control. The experiment was performed twice with 30 cilia imaged per condition per experiment and all data were pooled. (D) NIH-3T3 cells were treated with control or SHH conditioned media in the presence of 2 μM GIRI or vehicle. IFT88 is shown in magenta, SMO is green, DAPI (blue) marks nuclei. Scale bar = 5 μm. (D’) Quantification of ciliary signal intensity for IFT88 and SMO in cells treated with control or SHH conditioned media, 2 μM GIRI, or vehicle control. The experiment was performed twice with ≥30 cilia imaged per condition per experiment and all data were pooled. For all graphs, significance was determined using a one-way ANOVA. Significance is indicated as follows: *<0.05, **<0.01, ***<0.001, ****<0.0001, and ns, p > 0.05. Data are represented as mean ± SD.
Figure 2.
Figure 2.. AA enhances sterol-mediated SMO activation.
(A) SHH Light II cells were treated with the indicated concentrations of AA. The average Luciferase/Renilla value is shown as fold change over vehicle. The experiment was repeated three times with 3–4 technical replicates per experiment and all data were pooled. (B) A diagram of reported binding regions for oxysterols (7β,27-DHC and 24(S),25-EpCHO) and cholesterol (CHO) on SMO. (C) SHH Light II cells were treated with control or SHH conditioned media, and 15 μM 7β,27-DHC or 24(S),25-EpCHO alone or in combination with increasing concentrations of AA (1x=12.5 μM). The average Luciferase/Renilla value is shown as fold change over vehicle. The experiment was repeated three times with 2–3 technical replicates per experiment and all data were pooled. (D) Activation of SHH pathway in response to increasing CHO:MβCD (1:10) was measured in SHH Light II cells. The average fold change was calculated from three independent experiments, all done in triplicate. All data were pooled. (E) SHH Light II cells were treated with 50 μM CHO:MβCD plus vehicle or increasing concentrations of arachidonic acid (1x=12.5 μM). The maximum response is shown using 250μM CHO:MβCD. The average fold change was calculated from three independent experiments done in triplicate. All data were pooled. (F-F’) Quantification of SMO ciliary signal intensity in NIH-3T3 cells. (F) Cells were treated with DMSO, 30 μM 7β,27-DHC or 24(S),25-EpCHO following pretreatment with 4 μM GIRI or vehicle. (F’) Cells were treated with MβCD or CHO:MβCD (250 μM) plus control or SHH conditioned media following pretreatment with 1 μM GIRI or vehicle control. Lower concentrations of GIRI were used when combined with MβCD to prevent cells sloughing off the dish. Experiments were repeated twice with ≥75 cilia imaged per condition per experiment and all data pooled. (G-G’) cPLA2α is required downstream of SHH and SMO sterol agonists for maximal downstream transcriptional activation. SHH Light II cells were incubated with vehicle, 30 μM 7β,27-DHC, 30 μM 24(S),25-EpCHO, 250 μM CHO-MβCD (G’) and control or SHH conditioned media following vehicle or 4 μM GIRI pretreatment. Luciferase expression was normalized to Renilla. The average fold change over vehicle control was calculated from three independent experiments done in triplicate and all data were pooled. Error bars indicate SD. Statistical significance was determined using one-way ANOVA and indicated as follows: *<0.05, **<0.01, ***<0.001, ****<0.0001, and ns, p > 0.05.
Figure 3.
Figure 3.. In silico docking predicts an AA binding site on SMO.
(A) In silico docking (yellow) of cholesterol recapitulates the native (green) binding pose observed in the crystal structure of cholesterol bound to the human SMO extracellular CRD (PDB ID: 5L7D). Docking of cyclopamine occupies the same pocket with a similar binding pose as in the crystal structure of cyclopamine bound to the Xenopus SMO transmembrane domain (PDB ID: 6D32). (B) In silico docking of cyclopamine and AA onto Xenopus SMO using Maestro software predicts cyclopamine and AA bind through an overlapping pocket near the top of the 7TM of SMO. (C) Cyclopamine is anchored by Xenopus SMO E491 (E522 in murine SMO) in transmembrane helix 7. (C’) AA is predicted to form a salt bridge with Xenopus SMO K368 (murine SMO K399) in EC2. (D) In silico docking predicts that the AA (yellow) binding pocket overlaps with the SAG (blue) pocket, but not with the deep 7TM cholesterol (green) binding pocket of the murine SMO structure (PDB ID: 6O3C). (E) Alignment of EC2 sequence from SMO proteins. The predicted AA anchoring residue is conserved across most vertebrate species (dotted box).
Figure 4.
Figure 4.. K399 facilitates AA binding to murine SMO.
(A-B”) Ligand-induced thermal stability changes were evaluated for wild-type (WT), K399A (AA binding mutant) and E522A (cyclopamine binding mutant) SMO-YFP proteins. Membrane fractions from cells expressing the indicated SMO-YFP proteins were incubated with vehicle, 12.5 μM AA, or 10 μM cyclopamine and then incubated at the indicated temperatures. Thermal stability was assessed by western blot. Signal intensity relative to the 34°C start point (set to 100%) is shown. The experiment was repeated twice for SMOE522A-YFP + AA and three times for all other conditions. All data were pooled and shown on the summary graphs. Error bars indicate SEM.
Figure 5.
Figure 5.. SMOK399A shows reduced ligand responsiveness.
(A) Smo/ Flp-In-NIH-3T3 cells were stably transfected with SmoWT-YFP, SmoK399A-YFP, or SmoE522A-YFP cDNAs. Protein levels in cell lysates were analyzed by western blot. Kinesin is the loading control. (B) Cell surface biotinylation was performed on Smo/ cells stably expressing YFP-tagged SmoWT, SmoK399A or SmoE522A. Biotinylated proteins were collected on streptavidin beads and analyzed by western blot. Kinesin marks the cytoplasmic input. (C) SHH-stimulated SMO ciliary translocation in the indicated cell lines was evaluated by confocal microscopy. The ciliary axoneme is marked by acetylated α-tubulin (magenta) and SMO is shown in green. DAPI (blue) marks nuclei. Scale bar = 5 μm. (C’) Flp-In-NIH-3T3 cells expressing the indicated SMO constructs were treated with control or SHH-containing conditioned media and vehicle, SAG, or cyclopamine, and then SMO ciliary localization was quantified. Results are presented as percent cilia with positive SMO signal. The experiment was performed twice with ≥50 cells counted for each condition. All data were pooled. (D-E) GLI1 and SMO protein levels were analyzed in lysates from control or SHH conditioned media treated Smo/ Flp-In-NIH-3T3 cells stably transfected with the indicated Smo-YFP cDNAs. β-actin is the loading control. Experiments were performed three times. Representative blots are shown. (E’) Densitometry analysis of GLI1, SMO, and β-actin was performed. GLI1:SMO ratios relative to β-actin are shown. The graph shows pooled data from 3 independent experiments. For all panels, significance was determined using a one-way ANOVA. Significance is indicated as follows: *<0.05, **<0.01, ***<0.001, ****<0.0001, and ns, p > 0.05.
Figure 6.
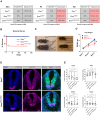
Figure 6.. SmoK399A/K399A knockin mice fail to thrive.
(A) SmoK399A/K399A knockin mice show normal Mendelian ratios at E9.5 and exhibit skewed Mendelian ratios at P5 and P21. Overall Chi-square values are shown for each timepoint. (B) A Kaplan-Meier survival curve shows reduced viability of SmoK399A/K399A mice compared to SmoK399A/+ and Smo+/+ controls. Litters were monitored weekly from P0. n ≥ 200 total mice analyzed. (C-C’) SmoK399A/K399A mice are reduced in size (C) and weight (C’) compared to controls. (D) Cardiac level sections of developing neural tubes of E9.5/25–29 somite stage embryos were stained for the floor plate marker FOXA2 and ventral progenitor markers NKX2.2, OLIG2, and PAX6. DAPI marks nuclei. Scale bar = 50μm. (E) Mean expression domain areas of the indicated progenitor markers were measured and normalized to overall neural tube area. At least 3 embryos per genotype with 3–5 sections per embryo were analyzed. Data are represented as mean ± SD. For C’ and E, statistical significance was calculated using a Student’s t-test between Smo+/+ and SmoK399A/K399A and is indicated by *p < 0.01 and ns = not significant.
Figure 7.
Figure 7.. SmoK399A/K399A mice have cardiopulmonary defects.
(A) A P0 litter shows the cyanotic appearance of SmoK399A/K399A mice compared to Smo+/+ and SmoK399A/+ littermates. (B) Overall Chi-square analysis correlating the effect of SmoK399A/K399A mutation with cardiac mispatterning. (C-E”) Transverse cardiac sections of E14.5 embryos were stained with Hematoxylin/Eosin (H&E). Whole heart sections (C, D, E) and higher magnifications (C’-E”) of Smo+/+ and SmoK399A/K399A embryos reveal AVSD (C’-D’) and IVS (C”-E”) patterning defects (arrow). DMP = Dorsal Mesenchymal Protrusion, IVS = Interventricular Septum, * = Atrioventricular Septal Defect. Scale bar = 200μm. (F) Hearts and lungs of P0 Smo+/+ and SmoK399A/K399A mice are shown. (G) qRT-PCR analysis of Gli1 expression in PDGFRA+ cells isolated from E18.5 lungs of Smo+/+ and SmoK399A/K399A mutant mice is shown. Fold-change in expression was determined using the 2–ΔΔCt method. Average fold change was calculated across 3 technical replicates each from 5 Smo+/+ and 4 SmoK399A/K399A embryos. (H) Saturated phosphatidylcholine (SatPC) was measured in dissected embryonic (E18.5-E19.5) and P0 lungs. Total SatPC for each mouse was normalized to lung weight. At least 3 mice per genotype per timepoint were analyzed and all data were pooled. Error bars indicate SD. (I-I’) H&E stains of adult (P27) lung sections from Smo+/+ and SmoK399A/K399A mice are shown. Scale bar = 0.5 mm. (I”) Quantification of vacuole area in lung sections from Smo+/+ and SmoK399A/K399A animals. At least 2 randomly chosen 8x zoom regions of lung sections from 5 mice each were evaluated. The yellow dots indicate the sections shown in (I). Significance was calculated using a Student’s t-test and denoted as: *<0.05, **<0.01, ****<0.0001. Error bars indicate SD. (J) SmoK399A/+ and SmoK399A/K399A mice were subjected to whole-body plethysmography. Enhanced pause (Penh) values were recorded over 45 minutes at 5-minute intervals. Results are plotted as maximal fold increase in Penh relative to baseline and expressed as mean ± SE, where n=6 mice per group. (K) Airway resistance was evaluated before and after exposure to the indicated concentrations of aerosolized methacholine (MeCH). * Difference from the SmoK399A/+ mice, p< 0.05.

References

    1. Jiang J. & Hui C. C. Hedgehog signaling in development and cancer. Dev Cell 15, 801–812 (2008). https://doi.org/S1534-5807(08)00484-X [pii] 10.1016/j.devcel.2008.11.010 - DOI - PMC - PubMed
    1. Chiang C. et al. Cyclopia and defective axial patterning in mice lacking Sonic hedgehog gene function. Nature 383, 407–413 (1996). 10.1038/383407a0 - DOI - PubMed
    1. Morrisey E. E. & Hogan B. L. Preparing for the first breath: genetic and cellular mechanisms in lung development. Dev Cell 18, 8–23 (2010). 10.1016/j.devcel.2009.12.010 - DOI - PMC - PubMed
    1. Rowton M. et al. Hedgehog signaling activates a mammalian heterochronic gene regulatory network controlling differentiation timing across lineages. Dev Cell 57, 2181–2203 e2189 (2022). 10.1016/j.devcel.2022.08.009 - DOI - PMC - PubMed
    1. Kugler M. C., Joyner A. L., Loomis C. A. & Munger J. S. Sonic hedgehog signaling in the lung. From development to disease. Am J Respir Cell Mol Biol 52, 1–13 (2015). 10.1165/rcmb.2014-0132TR - DOI - PMC - PubMed

Publication types

LinkOut - more resources