[Preprint]. 2025 Jan 30:2025.01.27.635108.
doi: 10.1101/2025.01.27.635108.

Uridine Metabolism as a Targetable Metabolic Achilles' Heel for chemo-resistant B-ALL

Affiliations

Uridine Metabolism as a Targetable Metabolic Achilles' Heel for chemo-resistant B-ALL

Yuxuan Liu et al. bioRxiv. .

Abstract

Relapse continues to limit survival for patients with B-cell acute lymphoblastic leukemia (B-ALL). Previous studies have independently implicated activation of B-cell developmental signaling pathways and increased glucose consumption with chemo-resistance and relapse risk. Here, we connect these observations, demonstrating that B-ALL cells with active signaling, defined by high expression of phosphorylated ribosomal protein S6 ("pS6+ cells"), are metabolically unique and glucose dependent. Isotope tracing and metabolic flux analysis confirm that pS6+ cells are highly glycolytic and notably sensitive to glucose deprivation, relying on glucose for de novo nucleotide synthesis. Uridine, but not purine or pyrimidine, rescues pS6+ cells from glucose deprivation, highlighting uridine is essential for their survival. Active signaling in pS6+ cells drives uridine production through activating phosphorylation of carbamoyl phosphate synthetase (CAD), the enzyme catalyzing the initial steps of uridine synthesis. Inhibition of signaling abolishes glucose dependency and CAD phosphorylation in pS6+ cells. Primary pS6+ cells demonstrate high expression of uridine synthesis proteins, including dihydroorotate dehydrogenase (DHODH), the rate-limiting catalyst of de novo uridine synthesis. Gene expression demonstrates that increased expression of DHODH is associated with relapse and inferior event-free survival after chemotherapy. Further, the majority of B-ALL genomic subtypes demonstrate activity of DHODH. Inhibiting DHODH using BAY2402232 effectively kills pS6+ cells in vitro, with its IC50 correlated with the strength of pS6 signaling across 14 B-ALL cell lines and patient-derived xenografts (PDX). In vivo DHODH inhibition prolongs survival and decreases leukemia burden in pS6+ B-ALL cell line and PDX models. These findings link active signaling to uridine dependency in B-ALL cells and an associated risk of relapse. Targeting uridine synthesis through DHODH inhibition offers a promising therapeutic strategy for chemo-resistant B-ALL as a novel therapeutic approach for resistant disease.


Figures

Fig. 1:
Fig. 1:. pS6+ cells have distinct metabolic gene signatures and are glucose dependent
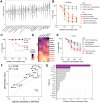
A. Whole transcriptome sequencing was performed in primary diagnostic bone marrow (BM) samples from known pS6+ patients who would go on relapse (n=3) and pS6− patients who remain in continued remission (n=3). B. Differential expression analysis between primary pS6+ and pS6− cells. Gene set enrichment analysis (GSEA) was performed with the Hallmark database (FDR < 0.05). Diagnostic pS6+ cells are enriched for genes in PI3K and mTOR pathways (blue) as well as several metabolic pathways (red). C. Z-score based on frequency of cells positive for phosphorylated S6, AKT, ERK, 4EBP1 and CREB in B-ALL cell lines in basal state defines pS6+ lines (n=6, Nalm6, RCH-ACV, 697, Kasumi2, Nalm16 and REH) and pS6− lines (n=3, RS4;11, Nalm20, MHH-CALL-4). D. Expression (arcsinh transformed mean) of pS6 (S235/236), pAKT (S273), pERK (T202/Y204) and pCREB (S133) in pS6+ and pS6− cell lines (pS6, P = 0.002; pERK, P=0.004; pAKT, p=0.095, ns; p4EBP1, p=0.095, ns; pCREB, p = 0.095, ns). E. Extracellular acidification rate (ECAR) indicating glycolytic activity in pS6+ cell lines (red) compared to pS6− cell lines (black; p = 0.0039). F. Correlation between the frequency of pS6+ cells and the glycolytic activity (measured by ECAR) in B-ALL cell lines (n=9, p = 0.021, R2 = 0.56). Each dot represents individual cell line colored by pS6 relative expression level (z-score of arcsinh transformed mean value) measured by mass cytometry. G. Cell viability after culture in medium with or without glucose (open bar) for 48 hours in pS6+ cells (red, n = 5) and pS6− cells (gray, n = 3). Cell death is measured by annexin V and PI staining by flow cytometry. Nalm6 p = 0.00098; 697 p = 0.0064; Kasumi2 p = 0.0022; Nalm16 p = 0.026; REH p = 0.0183; RS4;11, p = 0.614; MHH-CALL-4 p = 0.523; Nalm20 p = 0.081. Three or four biological replicates of experiments were performed. All data in dot plots and bar graphs are mean ± SD. Statistical tests used were Welch’s t test followed by Holm-Sidak multiple comparison test (D); Welch’s t test (E, I); and multiple paired t test followed using Šídák-Bonferroni method (G). ns, not significant, *p < 0.05, **p < 0.01, ***p < 0.001.
Fig. 2:
Fig. 2:. PI3K/mTOR signaling drives glucose-dependent uridine synthesis in B-ALL cells
A. Schematic of 13C6 glucose tracing to illustrate glucose flow through glycolysis, pentose phosphate pathway, and purine/pyrimidine synthesis. De novo synthesis converts phosphoribosyl pyrophosphate (PRPP) into uridine monophosphate (UMP) or inosine monophosphate (IMP), while the salvage pathway recycles nucleosides and nucleobases into nucleoside 5′-monophosphates (NMPs) or deoxy NMPs in one adenosine triphosphate (ATP)- or PRPP-dependent step. Pyrimidine synthesis pathways are highlighted: red for de novo, blue for salvage. Key enzymes include CAD (carbamoyl phosphate synthetase II, aspartate transcarbamoylase and dihydroorotase), CTPS1 (CTP synthase 1), DHODH (dihydroorotate dehydrogenase), TS (thymidylate synthase), UCK1/2 (uridine–cytidine kinases 1 and 2), UMPS (UMP synthase); UPP1 (uridine phosphorylase 1). B. Fractional labeling of m+5 glucose carbons in pentose phosphate pathway products: UDP (uridine diphosphate, p = 0.0233); UTP (uridine triphosphate, p = 0.002) and ATP (adenosine triphosphate, p = 0.0342) in glutamine deprived conditions in pS6+ and pS6− cell lines. C. Cell viability after glucose deprivation (GD) for 48 hours with and without supplementation of various metabolites: uridine (1mM), pyruvate (5mM), aspartate (5mM), pyrimidine (1mM) and purine (1mM). D. Pathway of carbamoyl phosphate synthetase (CAD) phosphorylation (left panel). Western blot of pCAD (S1859), pS6 (S235/S236), total CAD, total ribosomal protein S6 and GAPDH (as loading control) in pS6+ (Nalm6, 697, Nalm16, in red) and pS6− (RS4;11, Nalm20, MHH-CALL4, in black) cell lines. Band intensities were analyzed by Image J software and normalized to first lane and loading control as indicated under each lane. E, Western blot of pCAD (S1859), pS6 (S235/S236), total CAD, total ribosomal protein S6 and GAPDH (as loading control) in B-ALL cell line Nalm6 and PDX sample (SJ18305) in the presence or absence of tyrosine kinase inhibitors targeting kinases in the PI3K/mTOR pathway. S6K1 (PF-4708671: 10, 20μM) PI3K (LY294002: 10, 20μM), mTOR (rapamycin: 2.5, 5μM), SYK (PRT062607 HCl: 2.5, 5μM) for 24 hours. F. Mass cytometry panel utilized to evaluate expression of glycolysis, PPP, and pyrimidine synthesis proteins along with signaling molecules in primary cells. Measured proteins are in color, non-measured proteins are in gray. G. Expression of metabolic proteins between healthy bone marrow (n = 5) cell populations and primary B-ALL bone marrow cells from diagnosis (n = 31). Bubbles colored by fold change of median expression (arsinh transformed) and size indicates P value of the difference. The frequency of each classified subpopulation is indicated to the right. Frequencies summarized as mean ± SEM (B-ALL in purple; healthy control in gray). Pro-BII, P = 0.00024; Pre-BI, P = 0.0036; Early-non-BI, P = 0.000352. H. Differential expression of proteins in primary cells gated based on pS6 expression. Proteins in purple are significantly increased in pS6+ cells compared to pS6− cells within Pro-BII and Pre-BI cells from primary patient samples. I. Differential expression of proteins in pS6+ (n = 6) compared to pS6− cell lines (n = 3). Proteins in blue are significantly increased in pS6+ cells. J. Proteins upregulated in pS6+ cells from primary B-ALL samples (n=31) or B-ALL cell lines (n=9). DHODH is the sole shared protein from both cohorts. Data is displayed as mean ± SD. Statistical test used to compare 13C labelling fraction between pS6+ and pS6− cells is Welch t test (B). Statistical test used to compare the rescue effect of metabolites from glucose deprivation (C) and compare pS6+ and pS6− cells (H and I) and compare protein expression in different subpopulations between B-ALL and healthy BM (G, left panel) are two-way ANOVA followed by Šidák’s multiple comparisons test. Statistical test used to compare and to compare the frequency of subpopulations in leukemia samples and healthy bone marrows is Welch’s t test followed by Holm-Šidák method for multiple comparison correction (G, right panel). *p < 0.05, **p < 0.01, ***p < 0.001.
Fig. 3:
Fig. 3:. De novo uridine synthesis is a metabolic vulnerability in B-ALL
A. Effect of DHODH KO in cell lines across cancer subtypes in the genome-wide CRISPR screen (DepMap 22Q2 Public+Score, Chronos). B-ALL (in red) is the most dependent on DHODH for growth and survival among 17 cancer subtypes. The x-axis shows cancer subtypes of cell lines. The y-axis shows the DHODH dependency score (gene effect) per cell line. Commonly essential genes exhibit a median Chronos score of −1 as indicated (dashed line). B. Comparison of dependencies in B-cell leukemia (B-ALL) vs solid tumors. The x-axis displays the difference in average CRISPR score per gene between B-ALL and solid tumors, while the y-axis represents significance using −log10(p-value). Purple dots represent “dependency” genes that are preferentially dependent in B-ALL compared to solid tumors. Their loss is more detrimental to B-ALL cells than to solid tumor cells. Blue dots show “tolerance” genes that are not essential in B-ALL. A series of genes involved in pyrimidine synthesis (DHODH, UMPS, CAD, TYMS and CTPS1, red) are among the most essential genes in B-ALL. C. GSEA for KEGG_pyrimidine_metabolism signature between relapsed (n=426) vs non-relapsed (n=1039) patients in the MP2PRT dataset. Enrichment score 0.489, Kolmogorov–Smirnov (KS) test of rank distribution p = 3.49e-05. D. GSEA for KEGG pyrimidine metabolism signature between relapsed (n=112) vs non-relapsed (n=75) patients with B-ALL in the NCI TARGET dataset. Enrichment score 0.354, KS test of rank distribution p = 8.08e-08. E. DHODH and UMPS relative expression in relapsed (n=426) vs non-relapsed (n=1039) patients from MP2PRT dataset (DHODH, P=0.025; UMPS, p = 0.021). The line indicates mean value. F. DHODH and UMPS relative expression in the diagnostic samples from relapsed (n=112) vs non-relapsed (n=75) patients from NCI TARGET dataset (DHODH p = 0.133; UMPS p = 0.008). The line indicates mean value. G. Event-free survival (EFS) based on DHODH and UMPS expression in MP2PRT dataset when comparing top 10 percentile (N = 147) versus lowest 90% (n=1,318) MP2PRT, Molecular Profiling to Predict Responses to Therapy. Significance determined by Cox regression; DHODH p = 0.002; p = 0.214. H. EFS based on DHODH and UMPS expression in the NCI TARGET dataset when comparing the highest quartile (n = 46) to the lowest quartiles (n = 135) Significance determined by Cox regression; DHODH p = 0.036; UMPS p = 0.019. Data in box-whisker plot (A) are shown as median value with the range of values from 10th to 90th percentiles. The dots above or below the lines are outliers. The Kolmogorov–Smirnov test was applied to determine whether the rank distributions of these pathways were statistically different between diagnostic samples from patients who would relapse and patients who are in remission (C and D). Statistical test between relapse vs none was Welch t test. *p < 0.05, **p < 0.01, ***p < 0.001.
Figure 4.
Figure 4.. Active pS6 signaling predicts sensitivity to DHODH inhibition
A. DHODH activity in 1985 molecularly defined B-ALL cases. Bold indicates subtypes tested for DHODH inhibition (DHODHi) sensitivity in vitro. B. In vitro killing after treatment with DHODHi BAY-2402234 in cell lines (n=9). Cells were treated with increasing concentrations of BAY-2402234 for 48 hours. Apoptosis was measured by flow cytometry with Annexin V/7AAD staining. pS6+ magnitude is indicated by color with red/orange representing highest pS6 magnitude (n=5) while pS6− cells (n=3) are indicated in gray. C. Viability of REH or 697 pS6+ cells treated with increasing concentration of BAY-2402234 with or without the addition of uridine (1mM) to the cultures over 48 hours. Cell apoptosis was measured by flow cytometry with Annexin V/7AAD staining. D. Z-score based on the median expression of signaling molecules pS6, pERK, pAKT, p4EBP1 and pCREB in Pro-BII and Pre-BI cells from patient-derived xenograft (PDX) samples (n=12). Phospho-protein profiles were measured in CyTOF and each cell was classified by developmental classification. We defined cell lines and PDXs with pS6 median expression values (arcsinh transformed) greater than 3 as pS6+ and those no greater than 3 as pS6−. pS6+ PDXs are shown in red, while pS6− PDXs are in black. PDXs marked in bold were used for DHODHi treatment in panel E. E. In vitro killing after treatment with BAY-2402234 in PDX samples (n=6). Cells were treated with increasing concentrations of BAY-2402234 for 48 hours. Cell viability was measured by flow cytometry with Annexin V/7AAD. pS6+ PDXs = red; pS6− PDXs = black. F. Correlation between the strength of pS6 signaling (median expression) and the sensitivity to DHODHi (-logIC50) in cell lines and PDXs (p = 0.036, R2 = 0.32). IC50 values were determined from panel B and E. pS6 median value (arcsinh transformed) was determined by CyTOF. G. Cellular features ranked by importance in predicting sensitivity to DHODH inhibition with BAY-2402234 as selected by XGBoost. The top 2 features (> 0.1) are highlighted in the purple. Data in bar graph (A) are shown as median ± SD. Data in curves (B, C, E) are mean ± SD. Linear regression correlation was evaluated in F. The best fit line was shown with 95% confidence bands (dashed curves). *p < 0.05, **p < 0.01, ***p < 0.001.
Figure 5.
Figure 5.. DHODH inhibition prolongs survival of pS6+ B-ALL xenograft models
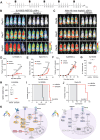
A. Half million B-ALL cells were injected by tail vein in NSG mice. Starting on day +3 following injection, xenografts were treated daily with 5mg/kg BAY-2402234 for 24 dosing days (5 days on, 2 days off). The treatment stopped at 34th day after iv injection. Bioluminescence imaging (BLI) was performed once a week for 5 weeks. B. Bioluminescent images of NSG mice at Day 10, Day 17, and Day 24 post engraftment with PDX SJ18305/Luc+ cells. Crossed-out mice indicate experimental mice excluded from the analysis due to death unrelated to leukemia (see methods). C. Bioluminescent images of NSG mice at Day 24, Day 31, and Day 34 post engraftment with Nalm16/Luc+ cells. D. Leukemia progression in SJ18305 xenografts by bioluminescence in DHODHi (red curve) treated and vehicle (black curve) mice. E. Leukemia progression in Nalm16 xenografts by bioluminescence in DHODHi (red curve) treated and vehicle (black curve) mice. F. Leukemia progression in SJ45503 xenografts by bioluminescence in DHODHi (red curve) treated and vehicle (black curve) mice. G. Leukemia engraftment in DHODHi or vehicle-treated SJ18305 xenografts. H. Spleen weight in SJ18305 PDX xenografts in DHODHi treated and vehicle group. I. Survival of SJ18305 xenografts treated with DHODHi (red curve) and vehicle (black curve). Gray area indicates the dosing period. J. Survival of Nalm16 xenografts treated by DHODHi (red curve) and vehicle mice (black curve). Gray area indicates the dosing period. K. Model of uridine dependency and sensitivity to DHODH inhibition in B-ALL. B-ALL cells characterized by active pS6 signaling (left) are glucose dependent for uridine production. Active signaling downstream of PI3K/mTOR pathways activates S6-kinase which phosphorylates CAD, driving uridine synthesis. Consequently, these cells are reliant on de novo pyrimidine/uridine synthesis, making them susceptible to inhibition by targeting DHODH. In contrast, cells lacking pS6 signaling (pS6−) do not depend on uridine synthesis and, therefore, show minimal response to DHODHi treatment. Data in primary samples suggests patients may contain a mixture of pS6+ and pS6− cells but that pS6+, DHODH active cells are associated with chemoresistance. Data in (D) and (E) are mean ± SD tested for significance using a two-way ANOVA mixed model followed by Sidak’s test for multiple comparisons. Data in box plots (F) and (G) are mean ± SD; Welch’s t test was used. Log-rank test was used in Kaplan Meier curves (H). *p < 0.05, **p < 0.01, ***p < 0.001, ****p < 0.0001.

References

    1. Hanahan D. & Weinberg R. A. Hallmarks of cancer: the next generation. Cell 144, 646–674 (2011). 10.1016/j.cell.2011.02.013 - DOI - PubMed
    1. Jones C. L., Inguva A. & Jordan C. T. Targeting Energy Metabolism in Cancer Stem Cells: Progress and Challenges in Leukemia and Solid Tumors. Cell Stem Cell 28, 378–393 (2021). 10.1016/j.stem.2021.02.013 - DOI - PMC - PubMed
    1. Mishra S. K., Millman S. E. & Zhang L. Metabolism in acute myeloid leukemia: mechanistic insights and therapeutic targets. Blood 141, 1119–1135 (2023). 10.1182/blood.2022018092 - DOI - PMC - PubMed
    1. DeBerardinis R. J. & Chandel N. S. We need to talk about the Warburg effect. Nature Metabolism 2, 127–129 (2020). 10.1038/s42255-020-0172-2 - DOI - PubMed
    1. De Carli E., Wang X. & Puget S. IDH1 and IDH2 mutations in gliomas. N Engl J Med 360, 2248; author reply 2249 (2009). 10.1056/NEJMc090593 - DOI - PubMed

Publication types

LinkOut - more resources