[Preprint]. 2025 Jan 29:2025.01.29.634860.
doi: 10.1101/2025.01.29.634860.

Strategies to decipher neuron identity from extracellular recordings in the cerebellum of behaving non-human primates

Affiliations

Strategies to decipher neuron identity from extracellular recordings in the cerebellum of behaving non-human primates

David J Herzfeld et al. bioRxiv. .

Update in

Abstract

Identification of neuron type is critical to understand computation in neural circuits through extracellular recordings in awake, behaving animal subjects. Yet, modern recording probes have limited power to resolve neuron type. Here, we leverage the well-characterized architecture of the cerebellar circuit to perform expert identification of neuron type from extracellular recordings in behaving non-human primates. Using deep-learning classifiers we evaluate the information contained in readily accessible extracellular features for neuron identification. Waveform, discharge statistics, anatomical layer, and functional interactions each can inform neuron labels for a sizable fraction of cerebellar units. Together, as inputs to a deep-learning classifier, the features perform even better. Our tools and methodologies, validated during smooth pursuit eye movements in the cerebellar floccular complex of awake behaving monkeys, can guide expert identification of neuron type during cerebellar-dependent tasks in behaving animals across species. They lay the groundwork for characterization of information processing in the cerebellar cortex.

Keywords: Golgi cell; Purkinje cell; cell type; classification; molecular layer interneuron; mossy fiber; unipolar brush cell.


Conflict of interest statement

Conflicts of interest The authors declare no conflicts of interest.

Figures

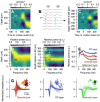
Figure 1.
Figure 1.. Properties of the neurophysiological recordings used to identify cerebellar neurons from monkeys.
(A) Diagram of the canonical cerebellar circuit, simplified. (B) Exemplar recording from the floccular complex using a 16-contact Plexon S-Probe; the 8 traces show electrical activity on 8 channels in one column. Red box denotes an identified complex spike across contacts. (C) Distribution of signal-to-noise ratios across our full sample of neurons computed on the primary channel. (D) Distribution of the percent of spikes that occur within an assumed absolute refractory period of 1 ms across our full sample. Red lines in C-D denote the mean across all recorded units. (E) Distributions of scalar firing rate statistics of n=1,152 recorded units shown as histograms. Left: the mean firing rate computed across each complete recording session. Middle: the mean CV2. Right: the log of the coefficient of variation,.
Figure 2.
Figure 2.. Firing rate properties of ground-truth identified Purkinje cell simple and complex spikes.
(A) Example recording of a Purkinje cell’s simple spikes and complex spikes aligned to the 250 random occurrences of a complex spike (black arrowhead). Note the complex-spike-induced pause in the Purkinje cell’s simple spikes. (B) Simple spike cross-correlogram aligned to the occurrence of a complex spike at t=0 ms (top, red) and simple spike auto-correlogram (blue, bottom), both for the Purkinje cell shown in (A). (C) Distribution of the duration of complex-spike-induced simple spike pauses across n=111 ground-truth Purkinje cells. (D) Primary channel waveforms of ground-truth Purkinje cell simple spikes, normalized. (E) Same as (D) except for ground-truth Purkinje cell complex spikes. Black arrowhead points to presumed somatic complex spikes whereas red arrowhead points to dendritic complex spikes. (F) Probability of cell-type labels generated by a previously established classification algorithm when supplied with ground-truth Purkinje cell simple spikes from our data as input.
Figure 3.
Figure 3.. Identification of cerebellar layer from extracellular recordings.
(A) Current source density computed from the local field potential for an example recording session. Horizontal lines denote the depth relative to the tip of the probe for the primary contact of simple spikes (black) and complex spikes (white) for a ground-truth Purkinje cell. (B) Complex spikes (red, left) and simple spikes (blue, right) for the ground-truth Purkinje cell recorded in (A) across contacts. Vertical position of each trace corresponds to the depth axis in (A). Arrowheads show the primary channel for the complex (white) and simple spikes (black). (C) Mean current source density across all recordings with a ground-truth Purkinje cell. Current source density maps were aligned with the primary channel of Purkinje cell simple spikes at a relative depth of 0 μm across recordings. Each recording was reflected about the 0 μm axis, if necessary, to ensure that the primary channel of the Purkinje cell complex spike had a positive value of relative depth. (D) Relative power of the LFP as a function of frequency across channels for the same recording from A-B. (E) Relative power of the LFP across channels, averaged across recording sessions with a ground-truth Purkinje cell. Preprocessing was performed as in (C). (F) Relative power of the LFP computed on primary contacts identified in the granule, Purkinje cell, and molecular layers. (G) Primary channel waveforms recorded in the identified granule (left), Purkinje cell (middle), and molecular (right) layers. We used K-means clustering following principal component analysis to split each layer’s waveforms into clusters (insets).
Figure 4.
Figure 4.. Functional identification of molecular layer interneurons.
(A) Example recording aligned to the time of spikes in a functionally-identified putative molecular layer interneuron. Top: superimposed traces from the molecular layer interneuron’s primary channel, aligned at the arrowhead to n=250 randomly selected spikes. Bottom: the simultaneously-recorded primary channel of a ground-truth Purkinje cell’s simple spikes aligned to the same spikes and time points as the top plot. Note the subtle decrease in density of Purkinje cell simple spikes following the occurrence of a spike in the molecular layer neuron. (B) Top: auto-correlogram for the molecular layer interneuron in (A). Middle: simple spike cross-correlogram aligned to the time of a complex spike for the ground-truth Purkinje cell shown in (A). Bottom: simple spike cross-correlogram aligned to the time of a spike in the functionally identified molecular layer interneuron. (C) Mean cross-correlogram across 23 paired recordings showing the change from baseline of ground-truth Purkinje cell simple spike firing rates, aligned to the time of a simultaneously recorded putative molecular layer interneuron spike. (D) Normalized primary channel waveform for functionally identified molecular layer interneurons. (E) Primary channel waveforms of molecular layer interneurons identified functionally via their interaction with ground-truth Purkinje cells or their presence in the molecular layer. Waveforms shown in (D) are a subset of those in (E). Grey and black waveforms show the results of splitting the full sample based on hierarchical clustering into two groups with different typical waveform profiles. (F) Evidence for gap-junction coupling between a pair of molecular layer interneurons. Plot shows the rate-corrected cross-correlogram denoting the relative firing rate of the first molecular layer interneuron aligned to the time of a spike in the second molecular layer interneuron at t=0 ms.
Figure 5.
Figure 5.. Characterization and identification of neural units in the granule cell layer.
(A) Distribution of waveform durations on each neural unit’s primary channel, measured from the waveform’s peak to its trough. Arrow denotes the peak of the subpopulation of units with very brief waveforms. (B) Putative mossy fiber waveforms, with amplitude normalized. Arrowhead highlights the presence of a negative after wave. (C) Interspike-interval distribution for an exemplar mossy fiber. Red arrow highlights the short absolute refractory period of this fiber. (D) Normalized primary channel waveforms across a population of putative Golgi cells. (E) Rate-corrected cross-correlogram across unique pairs of simultaneously recorded Golgi cells. (F) Distribution of the 95th percentile of the instantaneous firing rate for putative Golgi cells (left, green) and mossy fibers (right, pink) shown as a swarm plot. (G) Exemplar putative unipolar brush cells (UBCs) identified functionally by their response aligned to bursts of simultaneously recorded mossy fibers. Olive and orange traces show an exemplar on- and off- UBC. (H) Primary channel waveforms for the On- and Off-UBCs shown in (G). (I). Scatter plot showing that CV-log and mean firing rate together do not discriminate granule layer neurons. Green, red, and orange symbols show data for putative Golgi cells, mossy fibers, and UBCs, defined by our criteria for expert identification.
Figure 6.
Figure 6.. A tool to assess intrinsic regularity properties independent of stimulus-and response-related modulation of firing rate.
(A) 3D-ACG for an example putative unipolar brush cell recorded in the granule cell layer. (B) Conventional (2D) auto-correlogram for the same neuron used in (A). The auto-correlogram is computed across the duration of the recording session. (C) The color axis shows the mean firing rate for the example UBC shown in A as the monkey fixated a stationary dot at each of nine points on a grid. (D) Conventional auto-correlograms for the same neuron shown in A-C, stratified based on the monkey’s vertical eye position. Colors of the traces in D correspond to the horizontal rectangles in C showing the monkey’s vertical fixation position.
Figure 7.
Figure 7.. Features of expert-identified neurons in the primate cerebellum.
(A) Conventional (2D) auto-correlograms for a random subset of n=40 neurons for each putative neuron type. (B) 3D-ACG for a representative example neuron of each cell type. (C) Primary channel waveform for all neurons of each type. (D) Spike-triggered LFP recorded on each neuron’s primary channel. Waveforms in (C) and spike-triggered LFPs in (D) have normalized amplitudes and potentially have been inverted, as described in the text.
Figure 8.
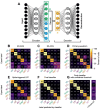
Figure 8.. Assessment of classifier performance for expert-identified neurons across waveform and regularity features.
(A) Deep-learning strategy for an unbiased quantification of information content for classification based on differently-sized input features. Diagram shows a variational autoencoder that encodes high dimensional inputs into a lower dimensional bottle neck (squared regions). A decoding arm learns to sample from the encoder and recapitulate the inputs. (B-E) Cross-validated classification performance for various extracellular features, each compressed via an optimized variational autoencoder. Each panel shows a “confusion matrix” where each column in the matrix reports, as percentages, the distribution of expert labels as a function of the neuron type predicted by the classifier. (F) Performance of a “full” classifier that takes 3 features as inputs: 3D-ACG, primary channel waveform, and spike-triggered LFP. (G) Full classifier performance when we threshold its output according to a confidence ratio computed across 25 training replicates. Far right column in (G) denotes the percentage of each expert-labeled neuron type that did not exceed the confidence threshold of 2.0.

Similar articles

References

    1. Lisberger S. G. Visual Guidance of Smooth Pursuit Eye Movements. Annu. Rev. Vis. Sci. 1, 447–468 (2015). - PubMed
    1. Lisberger S. G. Visual Guidance of Smooth-Pursuit Eye Movements: Sensation, Action, and What Happens in Between. Neuron 66, 477–491 (2010). - PMC - PubMed
    1. Ramón y Cajal S. Histologie Du Système Nerveux de l’homme & Des Vertébrés. (Maloine, Paris, 1909). doi: 10.5962/bhl.title.48637. - DOI
    1. Luo L., Callaway E. M. & Svoboda K. Genetic Dissection of Neural Circuits. Neuron 57, 634–660 (2008). - PMC - PubMed
    1. Fishell G. & Heintz N. The Neuron Identity Problem: Form Meets Function. Neuron 80, 602–612 (2013). - PubMed

Publication types

LinkOut - more resources