[Preprint]. 2025 Feb 6:2025.01.31.635509.
doi: 10.1101/2025.01.31.635509.

A Temporal and Spatial Atlas of Adaptive Immune Responses in the Lymph Node Following Viral Infection

Affiliations

A Temporal and Spatial Atlas of Adaptive Immune Responses in the Lymph Node Following Viral Infection

Shaowen Jiang et al. bioRxiv. .

Abstract

The spatial organization of adaptive immune cells within lymph nodes is critical for understanding immune responses during infection and disease. Here, we introduce AIR-SPACE, an integrative approach that combines high-resolution spatial transcriptomics with paired, high-fidelity long-read sequencing of T and B cell receptors. This method enables the simultaneous analysis of cellular transcriptomes and adaptive immune receptor (AIR) repertoires within their native spatial context. We applied AIR-SPACE to mouse popliteal lymph nodes at five distinct time points after Vaccinia virus footpad infection and constructed a comprehensive map of the developing adaptive immune response. Our analysis revealed heterogeneous activation niches, characterized by Interferon-gamma (IFN-γ) production, during the early stages of infection. At later stages, we delineated sub-anatomical structures within the germinal center (GC) and observed evidence that antibody-producing plasma cells differentiate and exit the GC through the dark zone. Furthermore, by combining clonotype data with spatial lineage tracing, we demonstrate that B cell clones are shared among multiple GCs within the same lymph node, reinforcing the concept of a dynamic, interconnected network of GCs. Overall, our study demonstrates how AIR-SPACE can be used to gain insight into the spatial dynamics of infection responses within lymphoid organs.


Conflict of interest statement

CONFLICTS The authors declare no competing interests.

Figures

Figure 1.
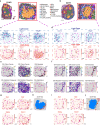
Figure 1.. AIR-SPACE enables the mapping of adaptive immune receptor clonotype and transcriptomics in situ.
a. Schematic of the experimental design and methodology, including the generation of long-read (LR) and short-read (SR). b. Spatial mapping of cell types across the LN sections at different time points post-infection; scale bars represent 500 μm. c. Spatial mapping of adaptive immune receptor (AIR) clonotypes across the LN sections, with immunoglobulin (IG) clones shown in blue and T cell receptor (TCR) clones shown in red.
Figure 2.
Figure 2.. Comprehensive analysis of adaptive immune receptor profiles from long-read sequencing.
a. Swarm plots comparing the accuracy of ONT reads post-basecalling (ONT), following R2C2 processing (R2C2), and after UMI correction and barcode sequences were mapped to the Curio barcode whitelist (R2C2-UMI overlap). b. Barplot displaying the average number of unique clones identified for each receptor type (IGH, IGK, IGL, TRB, TRA) from LRs (R2C2-UMI overlap), with individual sample values represented by dots. c. The fraction of beads containing a single or multiple clonotype sequence for each receptor type across samples. d. Barplot showing the number of beads with detected heavy chains, categorized by the presence of paired IG receptors (HK: IGH and IGK; HL: IGH and IGL; HKL: IGH and IGK&L; no L-chain: no light chains were detected). e. Spatial mapping of Shannon entropy index on LN of D14PI, calculated by potential combinations between heavy and light chains. Scale bars represent 500 μm. f. The Gini index represents the diversity of clonotypes for each receptor type across samples. g. Boxplot showing the CDR3 length (aa) for each receptor across samples. h. Boxplot showing the mutation frequency among IG receptors across samples. i. Bar charts show the composition of IGH chain isotypes across samples, with M as the membrane-bound BCR and S as the secreted antibody.
Figure 3.
Figure 3.. Heatmap of individual beads with IGH clonotype sequences.
Left column: Spatial mapping of regions across the LN sections at different time points post-infection; scale bars represent 500 μm; Right column: Heatmap showing individual beads across all samples containing IGH clonotype sequences, mapped to its structural location within the LN (Region), its expression of Aicda, its mutation frequency of IGH, its isotype composition, isoform of BCR or antibody, and its CDR3 length. (To maintain consistent heatmap widths for visualization, the number of beads shown was downsampled to 300, following the same region composition ratios for each sample)
Figure 4.
Figure 4.. Niches of activation from the expression on Ifng.
a. Total expression of Ifng across all samples at different time points post-infection. b. Spatial expression of Ifng in D3PI LN. c. Left: Identification of Ifng activation niches, categorized as inner (blue), Outer (red), and Control (orange), corresponding to niches in the inner cortex, outer cortex, and central areas with low expression of Ifng in the inner cortex, respectively; Right: Ifng expression levels as a function of distance away from the centroid of the three groups of niches, the color was shared with the right panel. d. Heatmap showing the expression levels of significantly spatial auto-correlated genes as a function of distance away from the centroid of the niches. e. Spatial map on examples of genes positively correlated with Ifng in Gaussian smoothing value. f. Composition of TRBV gene segments in the three groups of niches, with a detailed focus on TRBV13–3 and TRBV4 composition as a function of distance away from the centroid of niches. The color
Figure 5.
Figure 5.. AIR-SPACE uncovers dynamic changes in germinal centers.
a&b. Zoomed-in view of one GC from both the D14PI and D21PI samples, colored by different cell types; Spatial mapping of cell types across the LN sections at different time points post-infection; scale bars represent 500 μm. c&d. Spatial expression of LZ (Cxcl13, Cxcr5, Mfge8) and DZ (Cxcl12, Cxcr4, Aicda) marker genes. e&f. Spatial mapping of adaptive immune repertoire information from LR. g&i. Spatial expression of pre-plasma cell marker genes (Xbp1, Bst2, Selplg, Edem1). h&j. Spatial maps of the spatial location of different IGH clones on the GCs from D14PI and D21PI, color-coded by different IGH clones.
Figure 6.
Figure 6.. AIR-SPACE uncovers dynamic changes in germinal centers.
a. Percentage of IGH clones found in multiple GCs (brown) or single GC (black) at different time points (D10PI, D14PI, and D21PI). b. The distribution of the number of IGH clones by the number of GCs for each sample. c. Spatial map showing examples of IGH clones shared across multiple GCs for different time points (D10PI, D14PI, and D21PI). Blue dots represent individual GCs, black dots indicate beads not assigned to any GC, while colored dots correspond to beads assigned to adjacent GCs. d. Clonal evolution of a single IGH clone family from the D14PI sample. Spatial mapping and lineage tree represent each individual bead within the family, colored by different isoforms and CDR3 sequences. Branch lengths reflect the number of mutations (nt) accumulated from the germline (black node: root), and its spatial map.

References

    1. Hirano M., Das S., Guo P. & Cooper M. D. The evolution of adaptive immunity in vertebrates. Adv Immunol 109, 125–157 (2011). - PubMed
    1. Roth D. B. V(D)J Recombination: Mechanism, Errors, and Fidelity. Microbiol Spectr 2, (2014). - PMC - PubMed
    1. Di Noia J. M. & Neuberger M. S. Molecular Mechanisms of Antibody Somatic Hypermutation. Annu. Rev. Biochem. 76, 1–22 (2007). - PubMed
    1. Qi H., Kastenmüller W. & Germain R. N. Spatiotemporal Basis of Innate and Adaptive Immunity in Secondary Lymphoid Tissue. Annu. Rev. Cell Dev. Biol. 30, 141–167 (2014). - PubMed
    1. Reynoso G. V. et al. Lymph node conduits transport virions for rapid T cell activation. Nat Immunol 20, 602–612 (2019). - PMC - PubMed

Publication types

LinkOut - more resources